Now at: ]Helsinki Institute of Physics, Finland ††thanks: Deceased ††thanks: Deceased
SLAC E158 Collaboration
Observation of Parity Nonconservation in Møller Scattering
Abstract
We report a measurement of the parity-violating asymmetry in fixed target electron-electron (Møller) scattering: . This first direct observation of parity nonconservation in Møller scattering leads to a measurement of the electron’s weak charge at low energy . This is consistent with the Standard Model expectation at the current level of precision: .
pacs:
11.30.Er, 12.15.Lk, 12.15.Mm, 13.66.Lm, 13.88.+e, 14.60.CdPrecision measurements of weak neutral current (WNC) processes mediated by Z0 exchange stringently test the Standard Model of electroweak interactions. While most WNC measurements have been performed at high energy colliders, the comprehensive search for new physics at TeV energies also requires precision measurements at low momentum transfer ().
One class of such measurements involves the scattering of longitudinally polarized electrons from unpolarized targets, allowing the determination of a parity-violating asymmetry , where is the cross section for incident right(left)-handed electrons. arises from the interference of the weak and electromagnetic amplitudes zeld and is sensitive to WNC coupling constants and thus the weak mixing angle .
The first observation of was made at the Stanford Linear Accelerator Center (SLAC) using a deuteron target e122 . That experiment established the basic experimental technique to determine small asymmetries which typically range from 0.1 to 100 parts per million (ppm). Subsequent measurements yielded improved precision and accuracy expt ; kkreview . However, theoretical uncertainties related to the use of hadronic targets restricted the interpretation of the experimental results at the quantum loop level.
In this paper we report the first observation of in electron-electron (Møller) scattering. This purely leptonic reaction has a large cross section and has little theoretical uncertainty. The development of the 50 GeV electron beam in SLAC End Station A (ESA) made possible a measurement of modphy with a precision that tests electroweak radiative corrections and probes physics beyond the Standard Model at the TeV scale.
At 50 GeV and a center-of-mass scattering angle of , in Møller scattering is predicted to be parts per billion (ppb) darman at tree level. Electroweak radiative corrections marciano1 ; otherad and the experimental acceptance reduce the measured asymmetry by more than 50%. The principal components of the experimental apparatus, designed to measure to better than 10%, were the polarized electron beam, a liquid hydrogen target, a spectrometer/collimator system, and detectors. Møller-scattered electrons were directed into a calorimeter by a magnetic spectrometer. The asymmetry was measured by extracting the fractional difference in the integrated calorimeter response for incident right- and left-handed beam pulses.
The longitudinally polarized electron beam, with up to electrons in ns pulses at 120 Hz, was produced by optical pumping of a strained GaAs photocathode takashi by circularly polarized laser light brian . The sign of the laser circular polarization state determined the electron beam helicity. The helicity sequence of the pulse train was made up of quadruplets consisting of two consecutive pulses with pseudo-randomly chosen helicities, followed by their complements, yielding two independent right-left “pulse pairs” every 33 ms.
Careful optimization of optical components brian minimized intrinsic intensity and position differences between right- and left-helicity beams that resulted from imperfections in the laser light and the photocathode response. Additionally, helicity-dependent corrections were applied to the laser beam in a feedback loop using periodic average measurements of beam asymmetries. The beam intensity and position were measured at the upstream and downstream ends of the accelerator with typical accuracies per pulse pair of 50 ppm in intensity, 50 ppm in energy and 2 m yury in position. Cumulative beam asymmetries at the target were reduced to ppb in intensity, ppb in energy, and nm in position.
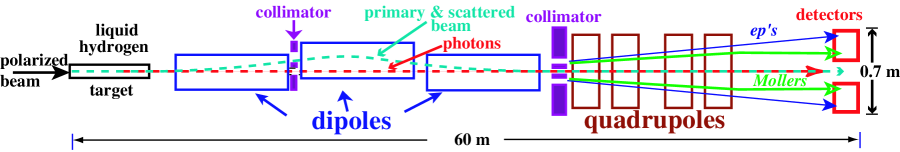
A schematic diagram of the apparatus in ESA is shown in Fig. 1. The 0.5 MW electron beam first passed through a 1.57 m long cylindrical cell filled with liquid hydrogen target . The cell was part of a target loop consisting of a motor, impeller, and heat exchanger, which circulated the liquid hydrogen at m/s. Aluminum meshes in the fluid path surrounding the electron beam enhanced turbulence and mixing. These features allowed the absorption of W deposited by the beam while keeping density fluctuations below 40 ppm per pulse pair.
Scattered particles with laboratory scattering angle between 4.4 and 7.5 mr over the full range of the azimuth were selected by the magnetic spectrometer davidthesis while the primary beam and forward angle photons passed unimpeded to the beam dump. Sixty meters downstream of the target, the charged particle flux was approximately azimuthally symmetric about the beam axis. Møller electrons in the range 13-24 GeV formed a ring spatially separated from electrons scattered from target protons ( scattering). This Møller ring contained electrons per pulse.
A scanning detector system provided a complete radial and azimuthal map of the charged particle flux. Figure 2 compares the measured radial profile at one azimuthal angle with Monte Carlo simulations of Møller and scattering.
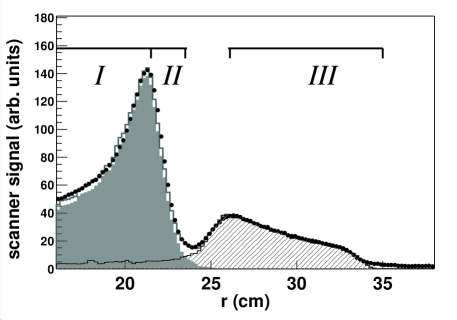
The flux within the Møller ring was the dominant background, estimated to be %.
For the asymmetry measurement, the charged particle flux was intercepted by the primary calorimeter, a 25 cm long cylindrical structure with a 15(35) cm inner(outer) radius. It was assembled by layering planes of flexible fused-silica fibers between elliptical copper plates so as to withstand a 100 Mrad radiation dose. The fibers directed Cherenkov light to air light-guides, each of which terminated into a shielded photomultiplier tube (PMT). The regions I, II and III in Fig. 2 were covered by 30, 20 and 10 PMTs, respectively, providing radial and azimuthal segmentation.
The small contribution of neutral particles, such as photons and neutrons, to the calorimeter response was measured in calibration runs. The asymmetry from pions was measured by using ten quartz bars arranged in azimuthal symmetry behind the Møller detector and lead shielding. Eight ionization chambers arranged in azimuthal sections intercepted charged particles with mr. This “luminosity” detector monitored target density fluctuations and provided a check of the null asymmetry expected at such small scattering angles.
The data sample, constituting a total flux of just over electrons on target, was collected at beam energies of 45.0 and 48.3 GeV. Due to precession as the beam traversed a bend after acceleration, the two beam energies corresponded to opposite orientations of longitudinal beam polarization in ESA. Roughly equal statistics were thus accumulated with opposite signs for the measured asymmetry, which suppressed many systematic effects. In addition, the state of a half-wave plate in the laser line was toggled every other day, passively reversing the sign of the electron beam polarization. This guarded against helicity-correlated electronics crosstalk.
For each beam pulse at 120 Hz, a distributed data acquisition (DAQ) system was triggered to collect data from the polarized source electronics and the digitized integrated response of the detectors and beam monitors with negligibly small electronic dead time. Alternate DAQ triggers fell into two 60 Hz fixed-phase “time slots”. Within these time slots, right-left pulse pairs were formed for independent asymmetry analyses.
Loose requirements were imposed on beam quality and beam monitor linearity. However, no helicity-dependent cuts were applied, other than the demand that the beam intensity asymmetry measured by two independent monitors agreed to within for each pulse-pair. In total, pulse pairs satisfied all selection criteria. The right-left asymmetry in the integrated detector response for each pulse pair was computed and then corrected for fluctuations in the beam trajectory.
To first order, six correlated beam parameters described the trajectory of a beam pulse: intensity, energy, and horizontal and vertical position and angle. Each beam parameter was measured by two independent monitors, such that device resolution and systematic effects could be studied.
Two methods were used to calibrate the detector sensitivity to each beam parameter and thus remove beam-induced random and systematic effects from the raw asymmetry. One method used a calibration subset of the pulses, where each beam parameter was modulated periodically around its average value by an amount large compared to nominal beam fluctuations with a 4% duty cycle. The other method applied an unbinned least squares linear regression to the pulses used for physics analysis. They yielded statistically consistent results to within 12 ppb. Final results were obtained with the latter, statistically more powerful technique.
The integrated responses of region I PMTs (see Fig. 2) were averaged to form the raw asymmetry . Near-perfect azimuthal symmetry reduced the sensitivity to beam fluctuations and right-left asymmetries. The pulse-pair distribution had an RMS of ppm. The cumulative beam asymmetry correction was ppb. A correction due to an azimuthal modulation of transverse from a small non-zero transverse beam polarization component was found to be ppb.
Additional bias to may arise from asymmetries in unmeasured beam quantities, such as higher order moments of beam distributions. Region II PMT channels were significantly more sensitive to such fluctuations and helped to limit possible bias in to 10 ppb. Likewise, the luminosity detector was very sensitive to higher order effects, where the cumulative raw right-left asymmetry was ppb. This is consistent with the theoretical expectation, providing additional confirmation that higher order effects are under control. A separate study limited the bias due to beam spot-size fluctuations on to 1 ppb, using data from a retractable wire array that was inserted into the beam during some of the data collection.
The physics asymmetry was formed from by correcting for background contributions, detector linearity and beam polarization:
and dilutions for various background sources are listed in Table 1.
| Source | (ppb) | |
|---|---|---|
| Beam (first order) | ||
| Beam (higher order) | ||
| Transverse polarization | ||
| High energy photons | ||
| Synchrotron photons | ||
| Neutrons | ||
| Pions |
The largest correction of ppb was due to electrons from inelastic electron- and photon-proton interactions. The measured asymmetry in region III PMTs was used as input, along with reasonable assumptions for the kinematic extrapolation to region I.
The electron beam polarization was , measured every other day by a dedicated polarimeter using Møller scattering of beam electrons off a magnetized foil placed just upstream of the hydrogen target. The linearity of the calorimeter response was determined to be .
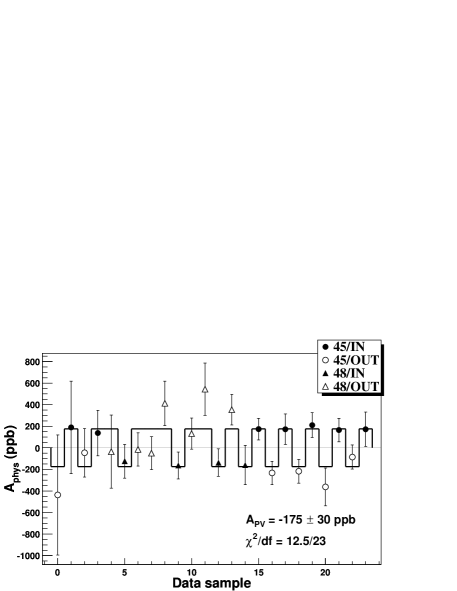
Figure 3 shows for all data, divided into 24 sequential samples. Each measurement has sign reversals depending on the beam energy and the state of the half-wave plate. is obtained by correcting each result by the appropriate sign. The combined result is
establishing parity nonconservation in Møller scattering at the level.
is proportional to the product of the electron’s vector and axial-vector neutral current couplings, parameterized as the weak charge :
where and are the Fermi and fine structure constants, respectively PDG2002 , and accounted for kinematically weighted hard initial and final state radiation effects Zykunov . The effective analyzing power ppm was determined from a Monte Carlo simulation that accounted for energy losses in the target and systematic uncertainties in the spectrometer setup. The average values of the kinematic variables were and , where is the square of the center-of-mass energy.
We find , consistent with the Standard Model expectation marciano1 ; PDG2002 of . As an example of the sensitivity of the measurement, the result can be used to limit the scale of a new left-handed contact interaction characterized by a term in the Lagrangian eichten ; mikelambda . At 95% C.L. a tree-level calculation yields TeV and TeV, for potential positive and negative deviations, respectively.
In the context of the Standard Model, we find
The last error comes from the evolution to the Z-pole.
The reported result is the most precise measurement of any asymmetry in electron scattering. The consistency of the result with the theoretical prediction provides significant new limits on TeV scale physics, comparable in sensitivity and complementary to other WNC measurements at low csnutev . Data from the first of three E158 run periods were used; the measurement accuracy is expected to improve by more than a factor of two when analysis of all the data is complete. The experimental techniques described in this Letter demonstrate the feasibility of measuring asymmetries with accuracies better than 10 ppb, applicable to new experiments under development kkreview .
Acknowledgements.
We thank the SLAC staff for their efforts in helping develop and operate the E158 apparatus, and especially A. Brachmann and T. Maruyama for their essential work on the polarized electron source. This work was supported by Department of Energy contract DE-AC03-76SF00515, and by the Division of Nuclear Physics at the Department of Energy and the Nuclear Physics Division of the National Science Foundation in the United States and the Commissariat à l’Énergie Atomique and the Centre National de la Recherche Scientifique in France.References
- (1) Ya.B. Zel’dovich, Sov. Phys. JETP 94, 262 (1959).
- (2) C.Y. Prescott et al., Phys. Lett. B84, 524 (1979).
- (3) W. Heil et al., Nucl. Phys. B327, 1 (1989); P.A. Souder et al., Phys. Rev. Lett. 65, 694 (1990); D.T. Spayde et al., Phys. Rev. Lett. 84, 1106 (2000); K. Aniol et al., Phys. Lett. B509, 211 (2001).
- (4) K.S. Kumar and P.A. Souder, Prog. Part. Nucl. Phys. 45, S333 (2000), and references therein.
- (5) K.S. Kumar, R.S. Holmes, E.W. Hughes, and P.A. Souder, Mod. Phys. Lett. A10, 2979 (1995); SLAC-E158 proposal, R. Carr et al., 1997, unpublished.
- (6) E. Derman and W.J. Marciano, Ann. Phys. 121, 147 (1979).
- (7) A. Czarnecki and W.J. Marciano, Phys. Rev. D53, 1066 (1996).
- (8) A. Czarnecki and W.J. Marciano, Int. J. Mod. Phy. A15, 2365 (2000); J. Erler, A. Kurylov, and M.J. Ramsey-Musolf, Phys. Rev. D68, 016006 (2003); F.J. Petriello, Phys. Rev. D68, 033006 (2003); A. Ferroglia, G. Ossola, and A. Sirlin, eprint hep-ph/0307200 (2003).
- (9) T. Maruyama et al., Nucl. Instrum. Methods A492, 199 (2002).
- (10) T.B. Humensky et al., eprint physics/0209067 (2002), Nucl. Instrum. Methods (to be published).
- (11) D. Whittum and Yu. Kolomensky, Rev. Sci. Instrum. 70, 2300 (1999).
- (12) J. Gao et al., Nucl. Instrum. Methods A498, 90 (2003).
- (13) D. Relyea, Ph.D. Thesis, Princeton University, 2003 (unpublished).
- (14) A.O. Barut and C. Fronsdal, Phys. Rev. 120, 1871 (1960); L.L. DeRaad, Jr. and Y.J. Ng, Phys. Rev. D11, 1586 (1975).
- (15) Particle Data Group, K. Hagiwara et al., Phys. Rev. 66, 010001 (2002).
- (16) V. Zykunov, Yad. Fiz. 66, annot. (2003).
- (17) E.J. Eichten, K.D. Lane, and M.E. Peskin, Phys. Rev. Lett. 50, 811 (1983).
- (18) M.J. Ramsey-Musolf, Phys. Rev. C60, 015501 (1999).
- (19) S.C. Bennett and C.E. Wieman, Phys. Rev. Lett. 82, 2484 (1999); G.P. Zeller et al., Phys. Rev. Lett. 88, 091802-1 (2002).