Measurement of the polar-angle distribution of leptons from boson decay as a function of the transverse momentum in collisions at =1.8 TeV
D. Acosta,14 T. Affolder,7 M.G. Albrow,13 D. Ambrose,36 D. Amidei,27 K. Anikeev,26 J. Antos,1 G. Apollinari,13 T. Arisawa,50 A. Artikov,11 W. Ashmanskas,2 F. Azfar,34 P. Azzi-Bacchetta,35 N. Bacchetta,35 H. Bachacou,24 W. Badgett,13 A. Barbaro-Galtieri,24 V.E. Barnes,39 B.A. Barnett,21 S. Baroiant,5 M. Barone,15 G. Bauer,26 F. Bedeschi,37 S. Behari,21 S. Belforte,47 W.H. Bell,17 G. Bellettini,37 J. Bellinger,51 D. Benjamin,12 A. Beretvas,13 A. Bhatti,41 M. Binkley,13 D. Bisello,35 M. Bishai,13 R.E. Blair,2 C. Blocker,4 K. Bloom,27 B. Blumenfeld,21 A. Bocci,41 A. Bodek,40 G. Bolla,39 A. Bolshov,26 D. Bortoletto,39 J. Boudreau,38 C. Bromberg,28 E. Brubaker,24 J. Budagov,11 H.S. Budd,40 K. Burkett,13 G. Busetto,35 K.L. Byrum,2 S. Cabrera,12 M. Campbell,27 W. Carithers,24 D. Carlsmith,51 A. Castro,3 D. Cauz,47 A. Cerri,24 L. Cerrito,20 J. Chapman,27 C. Chen,36 Y.C. Chen,1 M. Chertok,5 G. Chiarelli,37 G. Chlachidze,13 F. Chlebana,13 M.L. Chu,1 J.Y. Chung,32 W.-H. Chung,51 Y.S. Chung,40 C.I. Ciobanu,20 A.G. Clark,16 M. Coca,40 A. Connolly,24 M. Convery,41 J. Conway,43 M. Cordelli,15 J. Cranshaw,45 R. Culbertson,13 D. Dagenhart,4 S. D’Auria,17 P. de Barbaro,40 S. De Cecco,42 S. Dell’Agnello,15 M. Dell’Orso,37 S. Demers,40 L. Demortier,41 M. Deninno,3 D. De Pedis,42 P.F. Derwent,13 C. Dionisi,42 J.R. Dittmann,13 A. Dominguez,24 S. Donati,37 M. D’Onofrio,16 T. Dorigo,35 N. Eddy,20 R. Erbacher,13 D. Errede,20 S. Errede,20 R. Eusebi,40 S. Farrington,17 R.G. Feild,52 J.P. Fernandez,39 C. Ferretti,27 R.D. Field,14 I. Fiori,37 B. Flaugher,13 L.R. Flores-Castillo,38 G.W. Foster,13 M. Franklin,18 J. Friedman,26 I. Furic,26 M. Gallinaro,41 M. Garcia-Sciveres,24 A.F. Garfinkel,39 C. Gay,52 D.W. Gerdes,27 E. Gerstein,9 S. Giagu,42 P. Giannetti,37 K. Giolo,39 M. Giordani,47 P. Giromini,15 V. Glagolev,11 D. Glenzinski,13 M. Gold,30 N. Goldschmidt,27 J. Goldstein,34 G. Gomez,8 M. Goncharov,44 I. Gorelov,30 A.T. Goshaw,12 Y. Gotra,38 K. Goulianos,41 A. Gresele,3 C. Grosso-Pilcher,10 M. Guenther,39 J. Guimaraes da Costa,18 C. Haber,24 S.R. Hahn,13 E. Halkiadakis,40 R. Handler,51 F. Happacher,15 K. Hara,48 R.M. Harris,13 F. Hartmann,22 K. Hatakeyama,41 J. Hauser,6 S.J. Haywood,53 J. Heinrich,36 M. Hennecke,22 M. Herndon,21 C. Hill,7 A. Hocker,40 K.D. Hoffman,10 S. Hou,1 B.T. Huffman,34 R. Hughes,32 J. Huston,28 C. Issever,7 J. Incandela,7 G. Introzzi,37 M. Iori,42 A. Ivanov,40 Y. Iwata,19 B. Iyutin,26 E. James,13 M. Jones,39 T. Kamon,44 J. Kang,27 M. Karagoz Unel,31 S. Kartal,13 H. Kasha,52 Y. Kato,33 R.D. Kennedy,13 R. Kephart,13 B. Kilminster,40 D.H. Kim,23 H.S. Kim,20 M.J. Kim,9 S.B. Kim,23 S.H. Kim,48 T.H. Kim,26 Y.K. Kim,10 M. Kirby,12 L. Kirsch,4 S. Klimenko,14 P. Koehn,32 K. Kondo,50 J. Konigsberg,14 A. Korn,26 A. Korytov,14 J. Kroll,36 M. Kruse,12 V. Krutelyov,44 S.E. Kuhlmann,2 N. Kuznetsova,13 A.T. Laasanen,39 S. Lami,41 S. Lammel,13 J. Lancaster,12 K. Lannon,32 M. Lancaster,25 R. Lander,5 A. Lath,43 G. Latino,30 T. LeCompte,2 Y. Le,21 J. Lee,40 S.W. Lee,44 N. Leonardo,26 S. Leone,37 J.D. Lewis,13 K. Li,52 C.S. Lin,13 M. Lindgren,6 T.M. Liss,20 T. Liu,13 D.O. Litvintsev,13 N.S. Lockyer,36 A. Loginov,29 M. Loreti,35 D. Lucchesi,35 P. Lukens,13 L. Lyons,34 J. Lys,24 R. Madrak,18 K. Maeshima,13 P. Maksimovic,21 L. Malferrari,3 M. Mangano,37 G. Manca,34 M. Mariotti,35 M. Martin,21 A. Martin,52 V. Martin,31 M. Martínez,13 P. Mazzanti,3 K.S. McFarland,40 P. McIntyre,44 M. Menguzzato,35 A. Menzione,37 P. Merkel,13 C. Mesropian,41 A. Meyer,13 T. Miao,13 R. Miller,28 J.S. Miller,27 S. Miscetti,15 G. Mitselmakher,14 N. Moggi,3 R. Moore,13 T. Moulik,39 M. Mulhearn,26 A. Mukherjee,13 T. Muller,22 A. Munar,36 P. Murat,13 J. Nachtman,13 S. Nahn,52 I. Nakano,19 R. Napora,21 F. Niell,27 C. Nelson,13 T. Nelson,13 C. Neu,32 M.S. Neubauer,26 C. Newman-Holmes,13 T. Nigmanov,38 L. Nodulman,2 S.H. Oh,12 Y.D. Oh,23 T. Ohsugi,19 T. Okusawa,33 W. Orejudos,24 C. Pagliarone,37 F. Palmonari,37 R. Paoletti,37 V. Papadimitriou,45 J. Patrick,13 G. Pauletta,47 M. Paulini,9 T. Pauly,34 C. Paus,26 D. Pellett,5 A. Penzo,47 T.J. Phillips,12 G. Piacentino,37 J. Piedra,8 K.T. Pitts,20 A. Pompoš,39 L. Pondrom,51 G. Pope,38 T. Pratt,34 F. Prokoshin,11 J. Proudfoot,2 F. Ptohos,15 O. Poukhov,11 G. Punzi,37 J. Rademacker,34 A. Rakitine,26 F. Ratnikov,43 H. Ray,27 A. Reichold,34 P. Renton,34 M. Rescigno,42 F. Rimondi,3 L. Ristori,37 W.J. Robertson,12 T. Rodrigo,8 S. Rolli,49 L. Rosenson,26 R. Roser,13 R. Rossin,35 C. Rott,39 A. Roy,39 A. Ruiz,8 D. Ryan,49 A. Safonov,5 R. St. Denis,17 W.K. Sakumoto,40 D. Saltzberg,6 C. Sanchez,32 A. Sansoni,15 L. Santi,47 S. Sarkar,42 P. Savard,46 A. Savoy-Navarro,13 P. Schlabach,13 E.E. Schmidt,13 M.P. Schmidt,52 M. Schmitt,31 L. Scodellaro,35 A. Scribano,37 A. Sedov,39 S. Seidel,30 Y. Seiya,48 A. Semenov,11 F. Semeria,3 M.D. Shapiro,24 P.F. Shepard,38 T. Shibayama,48 M. Shimojima,48 M. Shochet,10 A. Sidoti,35 A. Sill,45 P. Sinervo,46 A.J. Slaughter,52 K. Sliwa,49 F.D. Snider,13 R. Snihur,25 M. Spezziga,45 F. Spinella,37 M. Spiropulu,7 L. Spiegel,13 A. Stefanini,37 J. Strologas,30 D. Stuart,7 A. Sukhanov,14 K. Sumorok,26 T. Suzuki,48 R. Takashima,19 K. Takikawa,48 M. Tanaka,2 M. Tecchio,27 R.J. Tesarek,13 P.K. Teng,1 K. Terashi,41 S. Tether,26 J. Thom,13 A.S. Thompson,17 E. Thomson,32 P. Tipton,40 S. Tkaczyk,13 D. Toback,44 K. Tollefson,28 D. Tonelli,37 M. Tönnesmann,28 H. Toyoda,33 W. Trischuk,46 J. Tseng,26 D. Tsybychev,14 N. Turini,37 F. Ukegawa,48 T. Unverhau,17 T. Vaiciulis,40 A. Varganov,27 E. Vataga,37 S. Vejcik III,13 G. Velev,13 G. Veramendi,24 R. Vidal,13 I. Vila,8 R. Vilar,8 I. Volobouev,24 M. von der Mey,6 R.G. Wagner,2 R.L. Wagner,13 W. Wagner,22 Z. Wan,43 C. Wang,12 M.J. Wang,1 S.M. Wang,14 B. Ward,17 S. Waschke,17 D. Waters,25 T. Watts,43 M. Weber,24 W.C. Wester III,13 B. Whitehouse,49 A.B. Wicklund,2 E. Wicklund,13 H.H. Williams,36 P. Wilson,13 B.L. Winer,32 S. Wolbers,13 M. Wolter,49 S. Worm,43 X. Wu,16 F. Würthwein,26 U.K. Yang,10 W. Yao,24 G.P. Yeh,13 K. Yi,21 J. Yoh,13 T. Yoshida,33 I. Yu,23 S. Yu,36 J.C. Yun,13 L. Zanello,42 A. Zanetti,47 F. Zetti,24 and S. Zucchelli3
(CDF Collaboration)
1 Institute of Physics, Academia Sinica, Taipei, Taiwan 11529, Republic of China
2 Argonne National Laboratory, Argonne, Illinois 60439
3 Istituto Nazionale di Fisica Nucleare, University of Bologna, I-40127 Bologna, Italy
4 Brandeis University, Waltham, Massachusetts 02254
5 University of California at Davis, Davis, California 95616
6 University of California at Los Angeles, Los Angeles, California 90024
7 University of California at Santa Barbara, Santa Barbara, California 93106
8 Instituto de Fisica de Cantabria, CSIC-University of Cantabria, 39005 Santander, Spain
9 Carnegie Mellon University, Pittsburgh, Pennsylvania 15213
10 Enrico Fermi Institute, University of Chicago, Chicago, Illinois 60637
11 Joint Institute for Nuclear Research, RU-141980 Dubna, Russia
12 Duke University, Durham, North Carolina 27708
13 Fermi National Accelerator Laboratory, Batavia, Illinois 60510
14 University of Florida, Gainesville, Florida 32611
15 Laboratori Nazionali di Frascati, Istituto Nazionale di Fisica Nucleare, I-00044 Frascati, Italy
16 University of Geneva, CH-1211 Geneva 4, Switzerland
17 Glasgow University, Glasgow G12 8QQ, United Kingdom
18 Harvard University, Cambridge, Massachusetts 02138
19 Hiroshima University, Higashi-Hiroshima 724, Japan
20 University of Illinois, Urbana, Illinois 61801
21 The Johns Hopkins University, Baltimore, Maryland 21218
22 Institut für Experimentelle Kernphysik, Universität Karlsruhe, 76128 Karlsruhe, Germany
23 Center for High Energy Physics: Kyungpook National University, Taegu 702-701; Seoul National University, Seoul 151-742; and SungKyunKwan University, Suwon 440-746; Korea
24 Ernest Orlando Lawrence Berkeley National Laboratory, Berkeley, California 94720
25 University College London, London WC1E 6BT, United Kingdom
26 Massachusetts Institute of Technology, Cambridge, Massachusetts 02139
27 University of Michigan, Ann Arbor, Michigan 48109
28 Michigan State University, East Lansing, Michigan 48824
29 Institution for Theoretical and Experimental Physics, ITEP, Moscow 117259, Russia
30 University of New Mexico, Albuquerque, New Mexico 87131
31 Northwestern University, Evanston, Illinois 60208
32 The Ohio State University, Columbus, Ohio 43210
33 Osaka City University, Osaka 588, Japan
34 University of Oxford, Oxford OX1 3RH, United Kingdom
35 Universita di Padova, Istituto Nazionale di Fisica Nucleare, Sezione di Padova, I-35131 Padova, Italy
36 University of Pennsylvania, Philadelphia, Pennsylvania 19104
37 Istituto Nazionale di Fisica Nucleare, University and Scuola Normale Superiore of Pisa, I-56100 Pisa, Italy
38 University of Pittsburgh, Pittsburgh, Pennsylvania 15260
39 Purdue University, West Lafayette, Indiana 47907
40 University of Rochester, Rochester, New York 14627
41 Rockefeller University, New York, New York 10021
42 Instituto Nazionale de Fisica Nucleare, Sezione di Roma,
University di Roma I, ‘‘La Sapienza," I-00185 Roma, Italy
43 Rutgers University, Piscataway, New Jersey 08855
44 Texas A&M University, College Station, Texas 77843
45 Texas Tech University, Lubbock, Texas 79409
46 Institute of Particle Physics, University of Toronto, Toronto M5S 1A7, Canada
47 Istituto Nazionale di Fisica Nucleare, University of Trieste/ Udine, Italy
48 University of Tsukuba, Tsukuba, Ibaraki 305, Japan
49 Tufts University, Medford, Massachusetts 02155
50 Waseda University, Tokyo 169, Japan
51 University of Wisconsin, Madison, Wisconsin 53706
52 Yale University, New Haven, Connecticut 06520
53 CCLRC Rutherford Appleton Laboratory, Didcot OX11 0QX, UK
Abstract
We present a measurement of the coefficient of the leptonic polar-angle distribution from boson decays, as a function of the transverse momentum. The measurement uses an 804 pb-1 sample of collisions at =1.8 TeV collected by the CDF detector and includes data from both the and decay channels. We fit the boson transverse mass distribution to a set of templates from a Monte Carlo event generator and detector simulation in several ranges of the transverse momentum. The measurement agrees with the Standard Model expectation, whereby the ratio of longitudinally to transversely polarized bosons, in the Collins-Soper rest frame, increases with the transverse momentum at a rate of approximately 15% per 10 GeV/.
PACS numbers: 12.15.Ji, 12.38.Qk, 13.85.Qk, 13.38.Be, 14.70.Fm
I. INTRODUCTION
According to the Standard Model (SM), the polarization of bosons produced at high transverse momentum () is strongly affected by initial-state gluon radiation and quark-gluon scattering (the QCD leading-order diagrams for high- production are shown in Fig. 1). The angular distribution of the leptons from the decay reflects the changes in the polarization. In the Collins-Soper rest frame [1] the dependence of the cross section on the leptonic polar-angle at hadron level can be parametrized as
| (1) |
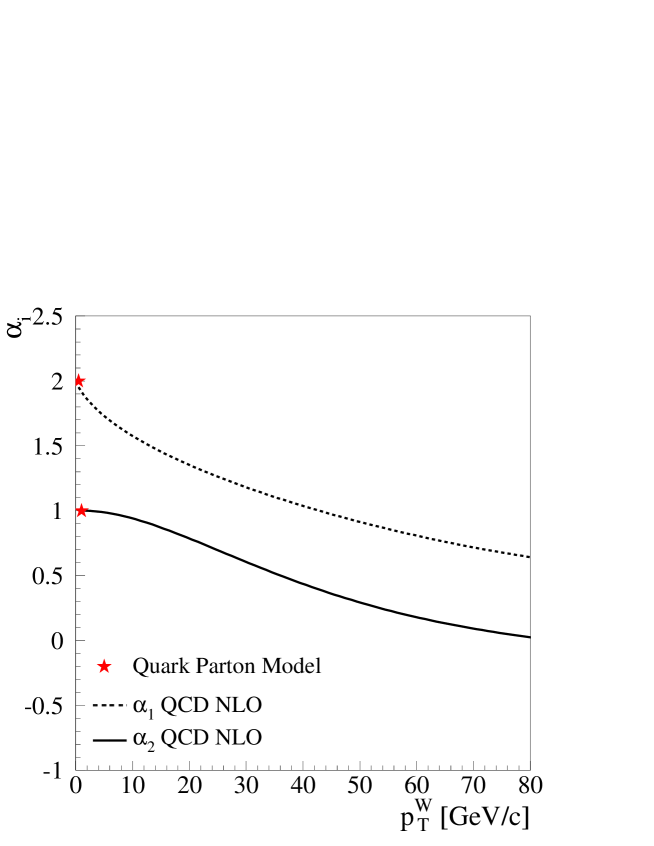
where is the lepton charge. The effects of QCD contribute to the coefficients and , which are functions of . Fig. 2 shows the theoretical expectation for and , neglecting a correction from sea-quarks, calculated up to next-to-leading order in QCD [3, 4]. Sea quarks give an opposite sign contribution to the term when the is produced by an antiquark in the proton and a quark in the antiproton, reducing the value of . Only in the limit GeV/, when and , does Eq. (1) describe the distribution of leptons from a transversely polarized boson: , which is typical of a pure interaction. As decreases, the contribution from longitudinally polarized bosons increases and so does the probability for the decay lepton to be emitted at large polar angle. On the other hand, measures the forward-backward leptonic-decay asymmetry. Fig. 2 indicates that the asymmetry is reduced at higher .
Understanding how QCD corrections affect lepton angular distributions is important in the measurement of the mass () and rapidity distributions in experiments. The lepton angular distribution changes the shape of the transverse mass distribution, which is used to measure . It has been estimated that an uncertainty of 1% on corresponds to a shift of the measured value of , determined by fitting the transverse mass distribution, of approximately 10 MeV/ [5].
We present the measurement of at various transverse momenta, using both the electron and muon channels. The sensitivity for a measurement of is too low, due to the fact that the sign of is undetermined without a full reconstruction of the kinematics of the neutrino from the decay. Hence, the only sensitivity to comes from the correlation between the geometrical acceptance of the detector and the phase space of the observed events. The current best measurement of is reported in [4]. The results presented here reduce the uncertainty on by about 50% up to 30 GeV/, and are of comparable uncertainty at higher transverse momenta of the .
For completeness, the cross section differential in the azimuthal and polar lepton angles can be expressed in the most general form as
| (2) | |||||
where is the rapidity of the boson, is the total (angle integrated) rate, and the terms weight the relative contributions to the total cross section due to the different polarizations of the boson. By integrating Eq. (2) over and comparing with Eq. (1) it follows that
| (3) |
which relates the and with the coefficients. The coefficients are explicitly calculated in [3, 6].
This paper is structured as follows: Sections II and III describe the CDF detector and the boson data sample, Sections IV and V outline the measurement method and detail the Monte Carlo event generator and detector simulation. Section VI contains the estimate of the background to the data sample and Section VII summarizes the fits and the systematic uncertainties. The results and conclusions are presented in Section VIII.
II. THE COLLIDER DETECTOR AT FERMILAB (CDF)
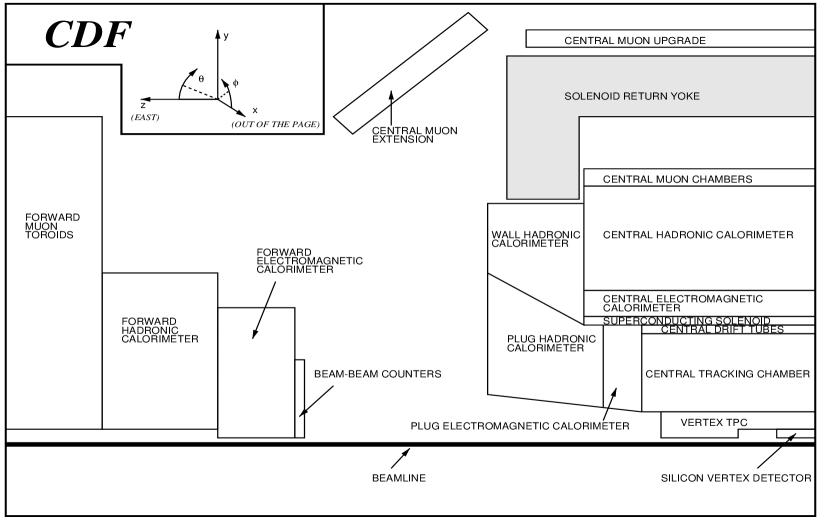
A complete description of the CDF detector can be found elsewhere [7]. We describe here only the components relevant to this work. CDF uses a cylindrical coordinate system (, , ) with the origin at the center of the detector and the -axis along the nominal direction of the proton beam. We define the polar angle as the angle measured with respect to the -axis and the pseudo-rapidity () as . A schematic drawing of one quadrant of the CDF detector is shown in Fig. 3.
A: Tracking
The CDF tracking system in Run I consists of three tracking detectors: a silicon vertex detector (SVX′), a vertex time projection chamber (VTX) and an open-cell multiwire drift chamber (CTC). The tracking system is immersed in a 1.4 T solenoidal magnetic field aligned with the -axis. The silicon vertex detector [8] is a silicon microstrip detector that covers a region in radius from 2.86 to 7.87 cm. It is divided into two identical “barrels” which surround the beampipe on opposite sides of the = 0 plane. Each barrel consists of four radial layers of silicon strip detectors, and each layer is divided in azimuth into 30∘ wedges. The microstrips run parallel to the direction so that the SVX′ tracks particles in . The VTX [9] is a set of 28 time projection chambers, each 9.4 cm in length, surrounding the SVX′ detector. It provides the position of the interaction point with a resolution of 1 to 2 mm. The CTC [10], which extends out to a radius of 138 cm and 160 cm, measures a three-dimensional track by providing up to 60 axial and 24 stereo position measurements. The basic drift cell has a line of 12 sense wires strung parallel to the -axis for axial measurements or 6 sense wires tilted 3∘ in for stereo measurements. The set of all drift cells located at the same radius from the origin of the detector is called a super-layer.
In this analysis the CTC is used for the tracking and VTX and SVX′ are only used to provide vertex information. The CTC track is constrained to point to the event vertex. The location of the vertex is determined with the VTX, and the position in is determined from the beam line measured with the SVX′. The result of this procedure is a significant improvement in the CTC resolution. The momentum resolution of such tracks is with measured in units of GeV/.
B: Calorimetry
The CDF calorimetry is provided by four different calorimeter systems with a nearly contiguous coverage out to = 4.2 . Three of the four systems have both electromagnetic (EM) and hadronic (HA) calorimetry. They are called “Central” (CEM, CHA), “Wall” (WHA), “Plug” (PEM, PHA) and “Forward” (FEM, FHA). The central and wall calorimeters are scintillator based, whereas the plug and forward calorimeters are a sandwich of proportional tube arrays with lead (PEM) or steel (PHA) absorber, and they are all segmented into towers which point back to the nominal interaction point.
The CEM [11] provides electron and photon energy measurements in the region 1.1 with resolution , where is measured in units of GeV and indicates sum in quadrature. The CEM is physically separated into two halves, one covering and one covering . Both halves are divided in azimuth into 24 wedges that subtend 15∘ each. Each wedge extends along the -axis for 246 cm and is divided into ten projective towers of approximately 0.1 units in . The CEM is 18 radiation lengths thick and consists of 31 layers of plastic scintillator interleaved with 30 layers of lead sheets. A proportional chamber (CES) measures the electron shower position in the and z directions at a depth of 6 radiation lengths in the CEM. The CES module in each wedge is a multi-wire proportional chamber with 64 anode wires oriented parallel to the beam axis. The cathodes are segmented into 128 strips perpendicular to anode wires. An electron and photon shower typically spans several CES channels in each dimension. When CTC tracks made by electrons from boson decays are extrapolated to the CES ( 184 cm), the CTC extrapolation and the CES shower position match to 0.22 cm (rms) in azimuth and 0.46 cm (rms) in . Both CES/CTC position matching and the CES shower shape are used as electron identification variables.
The PEM provides energy measurement in the range 1.12.4 and the FEM covers 2.24.2. The towers subtend approximately 0.1 in pseudorapidity by 5∘ in . Details of the plug and forward calorimeters can be found in [12, 13].
All the calorimeters are used to measure missing transverse energy and the central electromagnetic calorimeter provides the energy measurement for the electrons in this analysis.
C: Muon Systems
Three systems of scintillators and proportional chambers are used to identify muons in this analysis. A four-layer array of drift chambers, embedded in each wedge directly outside of the CHA, form the central muon detection system (CMU) [14, 15]. The CMU covers the region 0.6 and measures a four-point trajectory (called a “stub”) with an accuracy of 250 m per point in . Charge division gives an accuracy of 1.2 mm per point in . A 0.6 m-thick layer of steel separates the CMU from a second four-layer array of drift chambers (CMP). Requiring a muon to have a stub in the CMP reduces the background due to hadrons and in-flight decays by approximately a factor of ten. The CMU covers approximately 84% of the solid angle for 0.6, while 63% is covered by the CMP, and 53% by both. Additional four-layer muon chambers (CMX) with partial (70%) azimuthal coverage lie within 0.6 1.0.
D: Trigger Requirements
The CDF trigger [16] is a three-level system that selects events for recording to magnetic tape. The first two levels of the trigger consist of dedicated electronics. At Level 1, electrons are selected by requiring the presence of deposited energy above 8 GeV in a trigger tower (one trigger tower is two physical towers, with a width in pseudorapidity of =0.2). Muons are selected by requiring the presence of a track-stub in the CMU or CMX and, where there is coverage, a track-stub in the CMP in coincidence with the CMU. The Level 2 trigger starts after a Level 1 trigger has accepted an event. Trigger towers in the calorimeters are combined into clusters of total or electromagnetic energy by a hardware cluster finder. Clusters and stubs are then matched to tracks found in the CTC by the fast hardware tracking processor. The third-level trigger uses software based on optimized offline reconstruction code to analyze the whole event.
III. DATA SELECTION
The data presented here were collected by the CDF detector at the Tevatron collider between 1994 and 1995 (“Run Ib”). The signature for a event is a lepton with high transverse momentum and large missing transverse momentum in the event, due to the undetected neutrino. In the electron channel, we select candidate events with the primary lepton in the CEM. In the muon channel, the lepton candidate is required to have stubs in the CMU, CMP or CMX. These conditions specify what is referred to here as the “central lepton” sample. Two samples of and are also used for tuning the simulation. The details of the trigger requirements can be found in [17]. The integrated luminosity is 804 pb-1.
The missing transverse momentum is inferred from the energy imbalance in the event. For this purpose, a recoil-energy vector is defined as the vector sum of the transverse energies of all calorimeter towers (including both electromagnetic and hadronic, up to ), except the ones identified as part of the electromagnetic clusters associated with the primary leptons:
| (4) |
where is a transverse unit vector pointing to the center of each tower and is computed using the -vertex closest to the electron track, or using the electron track if there is no -vertex within 5 cm of the electron track. The vector is a measure of the calorimeter’s response to jets and particles recoiling against the . Thus, the missing transverse energy (identified with the transverse momentum of the neutrino) is derived as , where denotes the muon transverse momentum () or the electron transverse energy (). The modulus () of the recoil vector is an estimator of the boson transverse momentum and it is used to select different ranges of the boost.
The analysis uses the transverse mass (), which is analogous to the invariant mass except only the transverse components of the four-momenta are used. is determined from the data as
| (5) |
where is the angle in the plane between the transverse momentum of the lepton and the missing energy.
Several selection criteria are chosen to isolate a sample of well measured electrons and muons and reduce the backgrounds. For candidates in the sample, we select electrons with 25 GeV and with the of the associated track greater than 15 GeV/. Events are accepted only if 25 GeV. We require a well measured track (crossing all eight super-layers of the CTC and with more than 12 stereo hits attached). To exploit the projective geometry of the CDF detector, the event vertex reconstructed with the VTX is selected to be within 60 cm in from the origin of the detector coordinates. Fiducial requirements are applied to ensure that candidates are selected in regions of well understood efficiency and performance of the detector. To remove -boson events from the sample a search is made for a partner electron in the central (CEM), plug (PEM), or forward (FEM) calorimeter. Partner electrons are sought with cluster transverse energies greater than 20 GeV, 15 GeV and 10 GeV in the CEM, PEM and FEM respectively. Tracks with transverse momentum greater than 10 GeV/ and opposite sign to the primary electron are also considered. The event is rejected if the invariant mass of the primary electron with the partner electron exceeds 60 GeV/. The event is also rejected if the partner electron is pointing to any non-fiducial volume of the calorimeter, as this may cause the cluster’s energy to be mis-measured and consequently cause the invariant mass rejection to fail.
In order to improve electron identification, additional variables are used. They are the ratio of the hadronic to electromagnetic deposited energies (), the match between the extrapolated track and the measured position at the CES ( cm), the transverse CES shower shape [18] (), and the track isolation ( GeV/). The track isolation variable is defined as the total transverse momentum from tracks (unconstrained by the vertex position) of 1 GeV/, that lie within a cone of semi opening centered on the lepton track and within 5 cm of the lepton vertex.
For candidates in the sample, the muon and the in the event are required to be greater than 25 GeV. The quality requirements on the tracks are the same as for the electrons. In addition, there are requirements on the impact parameter of the track ( cm) and on the opening angle ( 10∘) with the second high- track to remove cosmic rays. The muon identification is based on the presence of track-stubs in the muon systems and on the deposited energy of the candidates in the calorimeters. The deposited energy is required to be less than 2 GeV in the CEM and 6 GeV in the CHA. Furthermore, we require that the CTC track, extrapolated at the center of the muon chambers, and the track-stub reconstructed in the muon systems match to within 2 cm in the CMU or 5 cm in the CMP and CMX. The track isolation cut has not been applied to muon candidates since the muon sample is smaller in size and we have preferred a looser selection. The removal rejects events where there is a second highest- ( GeV/) track in the CTC, of opposite sign to the candidate and back-to-back in space (within 10∘), that has an invariant mass with the candidate greater than 50 GeV/.
The samples are selected with the same selection criteria, except the is replaced with a partner high- lepton, and the removal requirements are not applied. Moreover, the sample of used for the tuning of the simulation has two CEM electrons, both passing electron ID cuts. This choice removes almost all of the QCD background.
A summary of the selection requirements and the number of surviving events is shown in Tables 1 (electrons) and 2 (muons). The accepted samples consists of 22,235 candidates and 41,730 candidates, divided in four recoil ranges.
| Criterion | events after requirements |
|---|---|
| Initial sample | 105,073 |
| Fiducial requirements | 75,135 |
| Good electron track | 68,337 |
| GeV | 64,254 |
| GeV | 54,409 |
| GeV | 54,300 |
| 15 GeV/ | 52,573 |
| GeV/ | 51,077 |
| Electron ID | 42,882 |
| removal | 41,730 |
| GeV | 31,363 |
| GeV | 7,739 |
| GeV | 2,033 |
| GeV | 595 |
| Criterion | events after requirements |
|---|---|
| Initial ample | 60,607 |
| GeV and GeV | 56,489 |
| Not a cosmic candidate | 42,296 |
| Impact parameter cm | 37,310 |
| Track-muon stub match | 36,596 |
| Good muon track | 33,887 |
| GeV/ | 29,146 |
| 25 GeV | 25,575 |
| GeV | 25,493 |
| removal | 22,877 |
| =50100 GeV/ | 22,235 |
| GeV | 13,813 |
| GeV | 5,910 |
| GeV | 2,088 |
| GeV | 424 |
IV. MEASUREMENT METHOD
Ideally one would like to fit the distribution of for the coefficients and of Eq. (1). However, since the neutrino coming from the decay is undetected, the kinematics of the decay are not completely reconstructed and it is not possible to perform a boost into the rest frame and uniquely determine . The finite width of the boson makes it difficult to solve the equations of the two-body decay. Even if the mass of the were known on an event by event basis and the detector had perfect resolution, the unknown longitudinal component of the neutrino momentum would leave a sign ambiguity in determining .
This measurement therefore exploits the relationship between the transverse mass of the and the lepton polar angle on a statistical basis, i.e. by using the shape of the distribution. A similar technique has been successfully applied in [4] to measure from decays. Fig. 4 shows an example of how the distribution of the transverse mass of the changes with different values of . Also, since does not contain any information on the longitudinal boost of the boson, it is affected by (the forward-backward lepton decay asymmetry term) only through residual effects of the geometrical acceptance of the detector.
The parameter is determined by fitting the distribution to a set of Monte Carlo generated templates, each with a different value of . A binned log-likelihood method is applied to find the best estimate for . The procedure is repeated selecting different regions of the transverse momentum of the boson.

V. MONTE CARLO SIMULATION OF PRODUCTION AND DECAY
A fast Monte Carlo (MC) generator and a parametrization of the detector response have been used in this analysis to simulate events at CDF [17]. The event generator is based on a leading order calculation of production and leptonic decay in quark-antiquark annihilation, including final state QED radiation [19, 20, 21, 22]. The distribution of momenta of the quarks is based on the MRS-R2 [23] set of parton distribution functions (PDFs). The generated boson is then Lorentz-boosted, in the center-of-mass frame of the quark-antiquark pair, to a specific transverse momentum . This measurement uses a broad range of , including events at low , where theoretical calculations are not reliable. The spectrum of as a function of the boson rapidity is therefore derived from (the of a boson determined experimentally from , events) after correcting it by the theoretical prediction for . There is no physics simulation of the recoiling jets, instead we model directly the detector response to the recoil against a boson. The parametrization of the detector response and the modeling of the boson recoil up to 20 GeV/ is described in detail in [17]. We have tuned the parameters of the model to describe the range of up to 100 GeV/. Overall, the MC tuning performed for this analysis involves:
the effects of QCD on the lepton angular distribution,
the parametrization of the transverse momentum spectrum, up to
= 100 GeV/, and
the detector response to the recoil against high- and bosons.
A: Effects of QCD on the lepton angular distribution
The QCD effects on the lepton angular distribution are implemented with an event weighting procedure in the simulation. Leptons from decays, generated with a tree-level quark-antiquark annihilation, have a purely angular spectrum with a very small distortion due to the final state photon emission. Therefore, events are first unweighted by , where is the lepton polar angle in the parton frame and is the lepton charge. This effectively factors out any small distortion of the spectrum with respect to a parabola. Events are then assigned the appropriate weight (), where is defined as a function of the lepton angles (, ) in the Collins-Soper boson rest frame:
| (6) | |||||
Eq. (6) describes the angular modulation induced by the effects of QCD as expressed also in Eq. (2), except for the terms with ; here they are set to zero, corresponding to the Standard Model prediction in the accessible range. The coefficients and are kept in the angular distribution and assigned the SM dependence with , calculated in [3]. Notice that the angular coefficients to and cancel out when integrating analytically over between 0 and . Nevertheless, detector acceptance effects introduce a small residual dependence in the polar-angle spectrum.
In Eq. (6), can take negative values if and (or, equivalently, and ) are varied independently in the procedure of fitting for the best parameters. Fig. 5 shows the allowed parameter space for and . The diagonals in the plot correspond to the requirement:
| (7) |
for . The point ( is the Quark Parton Model (QPM) limit in the case that the sea quark contribution is neglected, and it has a vanishing cross section at , as described by the lepton angular distribution. The dotted line is the relationship between and (at different up to 100 GeV/), expected from the SM including QCD corrections. To prevent from taking negative values, and are varied only within the allowed region. Note that the sea quark contribution to is correctly taken into account in the Monte Carlo.
Because this is an event-weighting procedure, it does not correspond to the inclusion of QCD corrections to the generated events: the large- events still have to be introduced by hand, by imposing a transverse momentum distribution.

B: transverse momentum spectrum
Prior to the determination of the transverse momentum distribution, the Monte Carlo simulation is tuned and checked against the and invariant mass distributions from the data. In the electron channel, the Monte Carlo simulation reproduces the data with an input -mass equal to the world-average [24] within a scale factor of 1.00020.0009. In the parametrization of the energy resolution of the CEM:
| (8) |
we use %. The term accounts for residual gain variations not corrected by the calibration procedure and is obtained from a fit to the invariant mass peak.
There is a small non-linearity correction to extrapolate the energy-scale corrections from electrons at the pole to the energies typical of a decay. The average for electrons coming from decay is about 4.5 GeV higher than the for decay. The non-linearity over a small range of energies can be expressed with a slope as
| (9) |
where is the measured scale at the pole, is the non-linearity factor, and is the difference in the average between and electrons. The estimate of is derived by looking at distributions from the data and comparing them to the Monte Carlo simulation in separate regions of . We estimate to be
| (10) |
For muons, we use a momentum resolution of
| (11) |
and the reconstructed mass peaks in the data and MC match with a ratio of central values of 1.00080.0011. With these inputs, the Monte Carlo simulation reproduces correctly the peak position and width of the invariant mass distribution of electron and muon pairs from bosons.
Since the QCD corrections to production are not included in the Monte Carlo simulation, the transverse momentum of the bosons needs to be determined from data. The distribution is generated in the Monte Carlo simulation using the following four-parameter functional form:
| (12) |
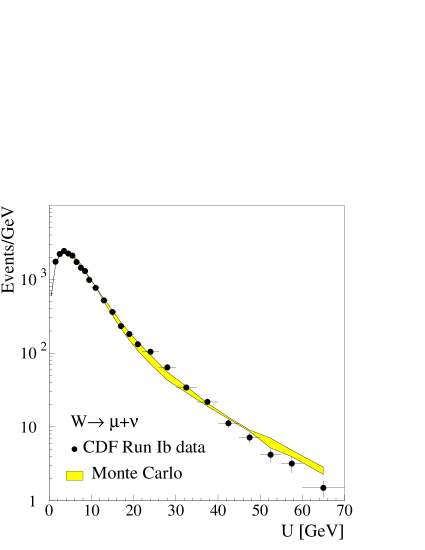
The parameters are determined from a fit to the observed distribution and then corrected to account for the difference between the observed and the generated spectrum. Since the difference between the two spectra is very small, the unfolding of the effect of the reconstruction is obtained by considering the ratio between them, as predicted by the detector simulation. We determine the distribution using separately and data, and the average is used as the spectrum that is input to the Monte Carlo simulation. The uncertainty on the average is used to evaluate the systematic uncertainty due to the transverse momentum spectrum determination. Fig. 6 shows the distribution of and data. The spectra are compared with the simulation where the parameters have been fit to the data. There is a good agreement between data and Monte Carlo simulation and the values, normalized per degree of freedom, are very close to 1.
 |
 |
| (a) | (b) |
C: Detector response to the recoil against high- and bosons
An estimate of the boost in the transverse plane comes from the measurement of the calorimeter response to jets and particles recoiling against the . The definition of the recoil-energy vector is given in Eq. (4). The modeling of in terms of the boson transverse momentum is called the “recoil model” and it is implemented in the Monte Carlo simulation of the event. The recoil model is derived using the observed recoil against bosons, whose kinematics are completely determined by the two leptons. The assumption is made that the recoil against bosons can be extended to model events, since the and bosons share a common production mechanism and are close in mass. We summarize below the key elements of the recoil model and show how the simulation describes the data after fitting the model’s parameters to the high- boson data.
1. Recoil Model
The direction of measured from the reconstructed decay leptons and the perpendicular to it form a base in the plane on which the recoil vector can be projected: = (, ). The values of and are functions of (addressed here as “response functions”) with a certain smearing. The smearings are to a good approximation Gaussian distributions [5], so that and can be parametrized as Gaussians with variable mean and width:
| (13) |
2. Response functions
The response function is well described by a second order polynomial in the transverse momentum measured from the reconstruction of the decay leptons. The parameters for are obtained from a fit to and data and the function is corrected for a small difference between the true and the observed which is measured from the two leptons’ momentum vectors to feed the correct parameters to the simulation. Fig. 7(a) shows the average of , which is the response function for the parallel component, together with the simulation after fitting for the parameters of . is on average smaller than , due to the gaps in the calorimeter and inefficiency in the reconstruction of the total energy deposited. Nonetheless, measuring provides an estimate of (or ultimately ).
The response function is consistent with zero within the statistical uncertainty, as expected since is the recoil projection perpendicular to . The average of is shown in Fig. 7(b).
3. Resolutions
The resolution of the recoil vector components depends on the underlying event and the jet activity. and are parametrized in the form:
| (14) |
where and are second order polynomials in , whereas contains the underlying event contribution and is modeled by minimum bias events. In Eq. (14), is expressed as a function of the total transverse energy , defined as the scalar sum of tower transverse energies:
| (15) |
is a measure of the total transverse energy in the event from all sources, excluding the primary lepton. The functional dependence of versus is calculated in [17]. The explicit dependence in the polynomials is derived here from data, using both electrons and muons. The parameters are then corrected for the dependence of the observed versus the true , as done for the response functions. Fig. 7(c),(d) show the resolution of and . The resolution worsens at higher , due to increased jet activity in the event. The agreements between data and Monte Carlo simulation are good in all the plots and the ’s normalized per degree of freedom are close to 1.
 |
 |
| (a) (b) | |
 |
 |
| (c) (d) |
D: transverse momentum distribution
To turn the distribution into a distribution, the simulation applies two weighting functions. The first allows for the fact that the distribution (as in Eq. (12)) is derived with a fit performed to data averaged over all rapidity values (with mean =0.3). However, events need to be generated differentially in both and . This weighting function is taken from a theoretical calculation of [17].
The second weighting function turns the distribution, generated with both and dependence, into a distribution for the transverse momentum of the boson. This is obtained from the theoretical calculation of [25, 26, 27, 28]. Resummed calculations are used for correcting the difference between the and the distributions. The ratio is between 0.9 and 1.0 over the range of interest. Since this is a ratio, the uncertainty is expected to be small because of cancellation of systematics. Indeed, by varying the PDF, , or the type of calculation, the resulting uncertainty in is small in comparison to the uncertainty arising from the statistics of the sample used to define the distribution [29, 30, 31, 32].
Although due to the undetected neutrino we cannot compare directly the spectrum in the simulation with the data, Fig. 8 shows a comparison of the recoil against the in the electron and muon channel. The recoil includes the distribution as well as all the response and resolution parameters derived using the sample. The shaded band corresponds to the uncertainty on the spectrum only. Since the recoil model and the spectrum are derived with a sample that is much smaller than the sample, there is a degree of freedom in optimizing the parameters to improve the agreement with data. However, we choose not to optimize the parameters using any of the boson distributions to prevent a possible source of bias when fitting the transverse mass distribution. We treat the statistical uncertainty of the recoil model and spectrum as a source of systematic uncertainty for .
 |
 |
| (a) | (b) |
VI. BACKGROUNDS
There are three main sources of background to the data sample of this analysis (where stands either for an electron or a muon):
-
•
W events, with the subsequently decaying into a muon or electron and two neutrinos.
-
•
Z events, where one of the leptons is not detected.
-
•
QCD dijet events, where a jet is wrongly identified as a lepton and the total energy in the event is incorrectly measured to give a signal.
There is a small background contribution from decays, which is estimated to be 25 events in the electron channel and 12 in the muon channel [33] and affects the high recoil range only. The background from cosmic rays in the muon channel is approximately 0.2% [17] of the total candidates, with a flat distribution. This corresponds to a negligible contribution compared with the dominant backgrounds.
A shape for the transverse mass distribution is determined for each background source and added to the transverse mass distribution of the simulated events. For background the shape is taken from [34].
A: background
The background from events, where the decays leptonically, is virtually indistinguishable from the or signal. The event generator used for the simulation of events in this analysis is capable of simulating , where the lepton is then decayed into or . The background level is found to be approximately 2% of the total sample, with softer charged lepton and spectra. The background fractions are listed in Tables 3 and 4 for the electron and muon channel respectively. The shape of the transverse mass distribution is also taken from the Monte Carlo simulation of events, separately for each of the boson recoil ranges.
B: background
events enter the sample when one of the leptons is not detected (“lost leg”) and there is missing transverse energy in the event.
1. Electron channel
As part of the candidate selection procedure the primary electron is always required to have been detected in the central calorimeter. The removal procedure ensures the rejection of events with a second oppositely charged high- track, or high-energy calorimeter cluster, and invariant mass of the electron-candidate pair compatible with a boson decay ( GeV/). When the track associated with the second electromagnetic cluster is pointing to any non-fiducial volume of the calorimeter, the event is rejected irrespective of the invariant mass value. This ensures that the event would still be rejected if the second electron has emitted a photon and the invariant mass with the primary electron track falls outside the invariant mass exclusion range.
The Monte Carlo simulation is used to estimate the background due to the inefficiency of the calorimeters in detecting the second leg, or when the second electron points beyond the coverage of the forward calorimeter ( 4.2). The total background level from events in the electron channel is very small, and is listed in Table 3.
| Recoil [GeV] | |||||
| Type: | (010) | (1020) | (2035) | (35100) | All |
| 2.15 | 1.74 | 1.31 | 1.57 | 2.01 | |
| 0.00 | 0.02 | 0.12 | 0.39 | 0.01 | |
| QCD jets | 0.230.11 | 0.390.14 | 0.140.10 | 0.50.3 | 0.260.12 |
| 0.00 | 0.00 | 0.490.20 | 2.500.80 | 0.060.02 | |
| Total | 2.380.11 | 2.150.14 | 2.060.22 | 4.960.85 | 2.420.12 |
2. Muon channel
The event selection applied in this analysis removes events with opposite sign tracks (found in the CTC) that combine with the identified muon to give an invariant mass greater than 50 GeV/. The number of events not removed by the selection criteria is consistent with zero when both muons pass through the fiducial tracking volume ().
However, a significant number of events may enter the sample when one of the muons goes outside the fiducial tracking volume. About 20% of events have one of the muons outside , either at the edge of the tracking volume () or at higher , beyond the coverage of the CTC. The estimate of the background in these cases is based on the simulation, which uses the tracking efficiency map determined using electrons detected in the calorimeter from the sample. The background level found is of the order of 4% and it is listed in Table 4. The shape of the transverse mass distribution of lost-leg events is also derived from the Monte Carlo simulation.
| Recoil [GeV] | |||||
| Type: | (07.5) | (7.515) | (1530) | (3070) | All |
| 2.24 | 1.94 | 1.63 | 2.37 | 2.11 | |
| 4.25 | 4.00 | 3.67 | 2.95 | 4.11 | |
| QCD jets | 0.450.19 | 0.790.29 | 0.810.52 | 1.401.18 | 0.590.26 |
| 0.00 | 0.00 | 0.190.09 | 1.890.70 | 0.050.02 | |
| Total | 6.940.19 | 6.730.29 | 6.300.53 | 8.611.37 | 6.860.26 |
C: QCD background
Dijet events can pass the selection cuts if one of the jets is mis-identified as a lepton and one of them is incorrectly measured and gives a high missing- signal. This is referred to as QCD background. candidate events which are background from QCD would typically have the charged lepton or the neutrino predominantly back-to-back or collinear with the leading jet. Real events, on the other hand, have a nearly uniform distribution of the lepton-jet opening angle, at least for low . For higher , events also exhibit a slight tendency to have the leading jet, which is recoiling against the , in the opposite direction to the charged lepton and the neutrino.
1. Electron channel
Fig. 9(a) shows the distribution of the opening angle in the plane between the electron and the leading jet. The leading jet is the highest energy jet in the event with energy of at least 5 GeV. The plot shows three samples enriched in QCD background together with the candidates sample. Two of the enriched QCD samples are derived by reversing the electron ID cuts in the preselection sample. The third is taken from dilepton events ( candidates that do not pass the opposite charge requirement on the two leptons) which we refer to as the QCD control sample. The samples enriched in QCD all show the expected peaks at 0∘ and 180∘.
 |
 |
| (a) | (b) |
When the recoil is less than 20 GeV the background is estimated by counting the excess of events in the distribution of . The signal component is estimated by fitting a linear function to the middle part of the distribution. Almost all the candidates with recoil greater than 10 GeV come associated with at least one jet, and we account separately for events that do not have an associated 5 GeV jet. Since the candidates greatly outnumber the background events when the electron is isolated, the counting is done in bins of increasing isolation, and the background is extrapolated back to the signal region of 1 GeV/. The same background estimate is cross-checked by selecting events at high isolation ( 10 GeV/) and using the fraction of isolated to non-isolated QCD events, seen in the QCD control sample, to predict the number in the signal region. Fig. 9(b) shows the two-dimensional distribution of the recoil versus lepton isolation in the QCD control sample.
We estimate 7436 background events due to QCD in the 010 GeV recoil range and 3011 in the 1020 GeV recoil range. This includes an additional 107 events in the 010 GeV recoil bin due to events with no leading 5 GeV jet, as derived from the fraction of events with and without a jet in the QCD control sample. The uncertainties include a systematic component due to the method. At higher recoil the estimate of the background is 32 events in both the 2035 and 35100 GeV bins. This is estimated with both the QCD control sample (by using the ratio of low to high recoil) and the direct counting of the excess of events at 0∘ and 180∘. In the latter, the non-uniform opening angle distribution of the recoiling jet and -decay leptons is partially accounted for by a slope in the fit to the opening angle distribution. The small background contribution makes it unnecessary to accurately model the signal angular distribution.
The shape of the transverse mass distribution of the QCD background is obtained by reversing the isolation cut and selecting events with anti-isolated electron tracks. The distribution shapes, at different recoil ranges, are seen to be largely independent of the anti-isolation cut. Fig. 10 shows the distribution of the backgrounds in the electron channel, scaled by the estimated amount as a percentage of the candidates.
2: Muon channel
QCD events can mimic W mainly in two ways. The first is when a heavy flavor quark in one of the jets decays into particles that include a high- muon (e.g. ). In order for the muon and neutrino to have enough to pass the selection cuts, the quark needs to have a high transverse momentum, which leads to small opening angles. Therefore this type of event will have the muon and the neutrino almost parallel to one of the jets. The second major type of QCD background process occurs when a hadron is misidentified as a muon. The energy of one of the jets should also be incorrectly measured, in order to give the appearance of a high missing- signal. In this case, the neutrino and the muon will be reconstructed either nearly parallel to one jet or back-to-back and parallel to the two jets. Moreover, in both the processes considered, the muon is not likely to be isolated.
The QCD background to events is estimated in the same way as for the electron channel in the four recoil bins. We expect , 4717, 1711, and 65 events in the four recoil ranges. Fig. 11 shows the distribution of the backgrounds in the muon channel scaled by the estimated amount as a fraction (percent) of the candidates.
 |
 |
| (a) (b) | |
 |
 |
| (c) (d) |
 |
 |
| (a) (b) | |
 |
 |
| (c) (d) |
VII. FITS AND SYSTEMATIC UNCERTAINTIES
A: The likelihood fits
A set of Monte Carlo generated templates of the distribution is compared to the distribution derived from the data. When each template distribution is compared to the data, a likelihood is computed according to:
| (16) |
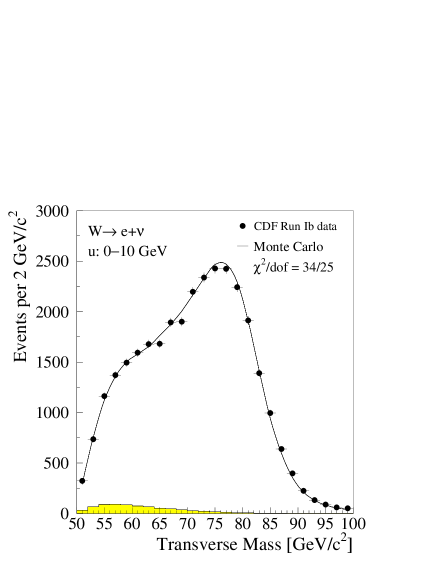
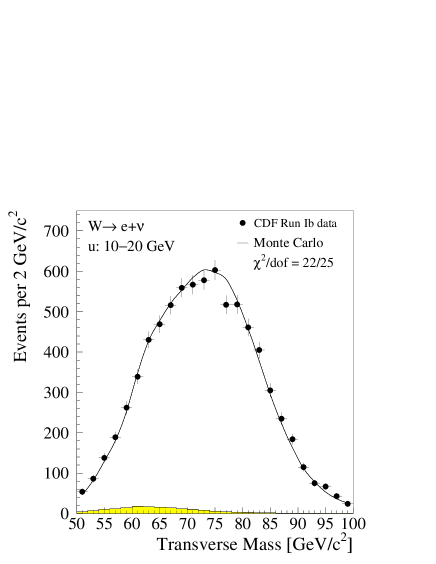
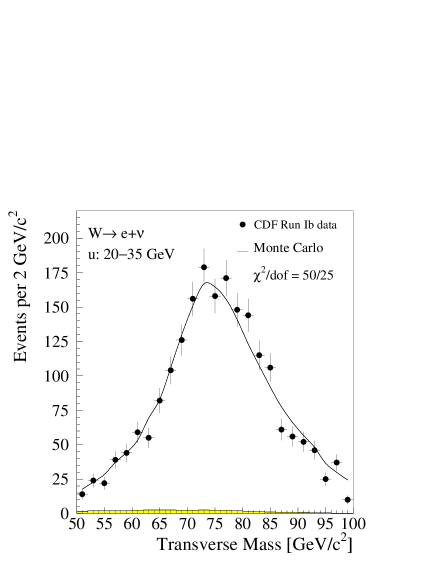
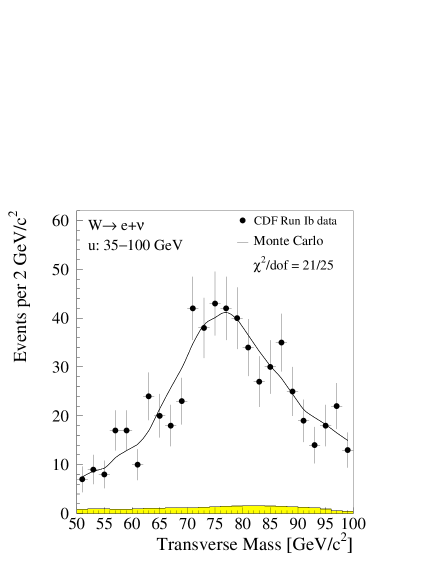
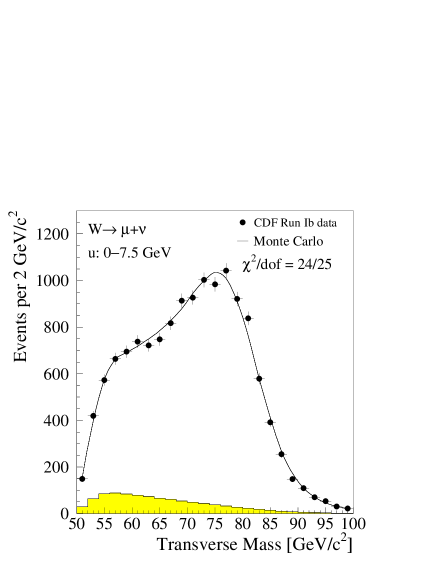
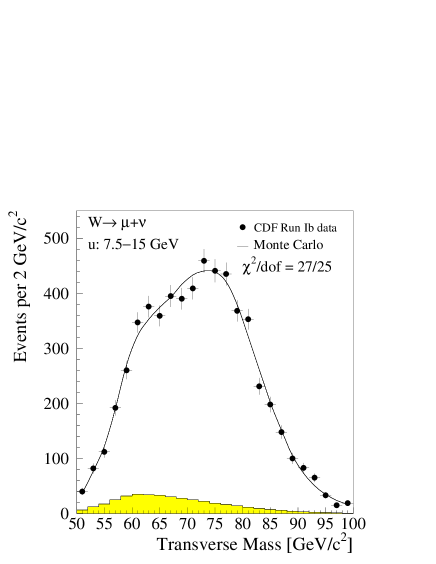
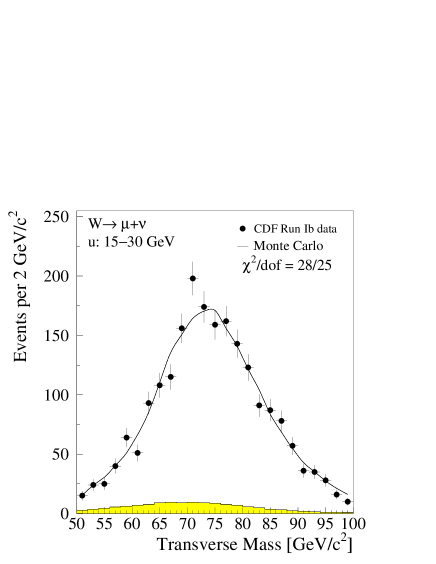
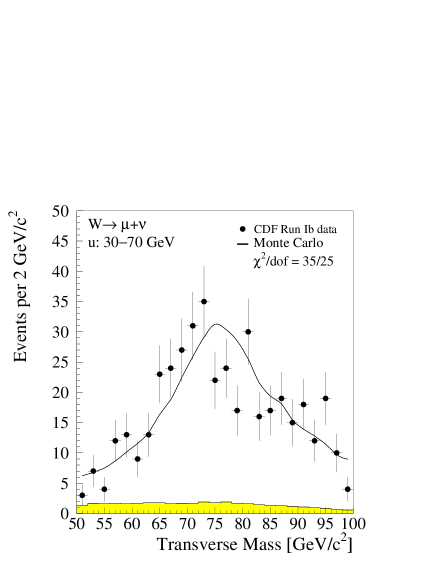
where the sum runs over the number of bins of the histogram, is the number of entries in each bin of the data histogram, and are the probabilities per-bin. The values of are given by the entries in the template histogram, one template for each value of . The maximum of the likelihood function locates the best estimate for the value of . Fig. 12 shows the likelihood functions in four different regions for the electron and muon channels. The likelihood functions have been shifted vertically so that the maximum is always at zero. The 1 statistical uncertainty on each fit is evaluated at the points on the likelihood curve which are 1/2 unit below the maximum. The four recoil regions are 010, 1020, 2035, and 35100 GeV/ for the data and 07.5, 7.515, 1530, and 30100 GeV/ for the data. The choice of the ranges is constrained by the sample size in the high- regions, due to the rapidly falling distribution. Moreover, the smaller sample of the muon channel is reflected in the recoil ranges covering lower values than in the electron channel. Tables 5 and 6 summarize the results of the fits for . Fig. 13 and 14 show the transverse mass distribution of the data compared with the simulation, where has been set to the best-estimate values.
 |
 |
| (a) (b) | |
 |
 |
| (c) (d) |
 |
 |
| (a) (b) | |
 |
 |
| (c) (d) |
 |
 |
| (a) (b) | |
 |
 |
| (c) (d) |
B: Systematic uncertainties
Systematic uncertainties on the measurement of for this analysis derive from the simulation of events, the detector response, and the estimate of backgrounds. Some of these, although classified as systematic, may be statistical in nature. This is the case for the detector recoil response and the transverse momentum spectrum, since they are derived from the and data samples. In the following, each source of systematic uncertainty is discussed and an estimate is determined for the shift on the measured values of . Tables 5 and 6 contain a summary of the various contributions and the total systematic uncertainty.
| Recoil range [GeV] | 010 | 1020 | 2035 | 35100 |
|---|---|---|---|---|
| measured | 1.09 | 1.14 | 0.67 | 0.22 |
| Statistical uncertainty | 0.05 | 0.13 | 0.29 | 0.36 |
| predicted | 0.98 | 0.84 | 0.55 | 0.25 |
| Mean [GeV/] | 6.2 | 15.9 | 33.3 | 59.2 |
| Nevt | 31363 | 7739 | 2033 | 595 |
| Systematic uncertainties: | ||||
| PDFs | 0.01 | 0.01 | 0.01 | 0.01 |
| mass | 0.02 | 0.01 | 0.04 | 0.04 |
| Input | 0.02 | 0.03 | 0.03 | 0.04 |
| Recoil model | 0.01 | 0.05 | 0.04 | 0.20 |
| Backgrounds | 0.01 | 0.01 | 0.01 | 0.01 |
| Combined systematic | 0.03 | 0.06 | 0.07 | 0.21 |
| Recoil range [GeV] | 07.5 | 7.515 | 1530 | 3070 |
|---|---|---|---|---|
| measured | 1.03 | 1.24 | 0.74 | 0.24 |
| Statistical uncertainty | 0.08 | 0.18 | 0.40 | 0.51 |
| predicted | 0.99 | 0.92 | 0.70 | 0.32 |
| Mean [GeV/] | 5.4 | 11.1 | 24.7 | 49.7 |
| Nevt | 13813 | 5910 | 2088 | 424 |
| Systematic uncertainties: | ||||
| PDFs | 0.01 | 0.01 | 0.01 | 0.01 |
| mass | 0.02 | 0.01 | 0.04 | 0.04 |
| Input | 0.02 | 0.03 | 0.03 | 0.04 |
| Recoil model | 0.01 | 0.05 | 0.04 | 0.20 |
| Backgrounds | 0.01 | 0.02 | 0.02 | 0.03 |
| Combined systematic | 0.03 | 0.06 | 0.07 | 0.21 |
1. Event Selection Bias
The electron isolation requirement may introduce a bias on the measurement of . For example, if the electron travels close to the recoil, there is greater opportunity for the event to be rejected. Also, there could be a correlation of the selected sample with , which is correlated with the QCD activity in the event. This bias is investigated by removing the isolation requirement, evaluating appropriately the increase in backgrounds, and measuring the change in . The maximum shifts observed are within the systematic uncertainty of the background determination. Moreover, by changing widely in the simulation, the spectrum of the opening angle between recoil and electron directions is not significantly affected. We do not apply an isolation requirement to the muon channel.
2. Parton Density Functions
The parton distribution functions are used in the Monte Carlo simulation to determine the quark content of the proton, and hence the rapidity distribution of the generated bosons. The set of PDFs used to simulate the events in this analysis is MRS-R2 [23]. These PDFs describe well the CDF low- -charge asymmetry data. To evaluate the impact of the choice of PDFs on the measurement of , two Monte Carlo samples have been generated with MRMS-D- and MRMS-D0, sets that were not tuned on CDF data and differ significantly from MRS-R2. has been measured with both sets of PDFs. The observed shifts are in all recoil regions, a small fraction of the statistical uncertainty. This is conservatively taken to be the systematic uncertainty due to the choice of PDFs.
3. The mass value
The transverse mass distribution is sensitive to the value of the mass used in the Monte Carlo simulation. The dependence comes from the fact that the transverse mass spectrum has a Jacobian peak at about the value of the mass. The value of the mass in the Monte Carlo simulation is set to the LEP average [35] 80.4120.042 MeV/, in order to be independent of the value measured at CDF. An uncertainty on of 40 MeV corresponds to a systematic uncertainty on of 0.010.04.
4. spectrum
The transverse momentum spectrum is derived from the sample by measuring , and using the relatively well known ratio of the distributions from theory. The distribution is measured from both the and data, and then averaged. To account for statistical and systematic uncertainties in determining the spectrum, additional MC datasets are generated using the from the electron or the muon -decay channels only. The measured shifts by between 0.02 and 0.04.
5. Recoil Model
The recoil model consists of response and resolution functions derived from the and data. There are statistical uncertainties in the coefficients of the model, which are used here to evaluate a systematic uncertainty. Each of the parameters is changed and the value is measured. The dispersion of the set of new measurements is taken as the systematic uncertainty, which increases with as shown in Tables 5 and 6. The recoil model is one of the main sources of uncertainty here since it is constrained with a statistical sample much smaller than the sample itself. The impact of a slight disagreement between the recoil distribution in data and simulation has been estimated by shifting the edges of the recoil ranges one at a time by 0.1 GeV/, only in the data but not in the Monte Carlo simulation, simulating event migration between bins. The value of 0.1 GeV/ is the difference between the mean of the recoil distributions in the data and in the MC. The coefficient has been observed to shift between 0.01 and 0.04 in the four bins. This is included in the quoted systematic uncertainty due to the recoil model.
6. The angular coefficients and input value
Although the distribution of , and hence , should only depend on and all the remaining angular coefficients should integrate out in practice geometric acceptance causes some angular coefficients to have a residual effect on the shape of the distribution. Coefficients A1, A5, A6, A7 are predicted to be negligible in the Standard Model and are set to zero. A2 and A3 are kept in the angular distribution (see Eq. (2)) and are set to their Standard Model values. As an estimate of the sensitivity to these terms, neglecting and results in a shift in the value of of 0.020.07 in the four bins. These values are not included in the systematic uncertainty since the uncertainty on the theoretical SM calculation is expected to be much smaller than 100%.
The coefficient also enters the distribution. However, when fitting for at low , cannot be set to the SM expected value, due to the requirement of positive event weights expressed in Eq. (7). is therefore set to , which lies in vicinity of the SM path for low . With this choice, Eq. (7) translates into a condition for , which is always positive and prevents assigning negative weights in the region around the Quark Parton Model point. A negligible change in the measured is visible by setting to different paths around the SM expectation. For higher ( GeV/), is set to the full SM prediction as there is no danger of assigning negative weights in that region.
7. Backgrounds
The main sources of uncertainty due to backgrounds come from the estimates of the QCD and contributions. The QCD background is estimated from the data using the lepton isolation and the angular distribution between the lepton and the jets in the event and the background is taken from [33]. The systematic uncertainty on the measured values of is derived by changing the QCD and background contents in each range by the uncertainty given in the background estimate results in Tables 3 and 4. A maximum shift of 0.03 on is observed.
VIII. RESULTS AND CONCLUSIONS
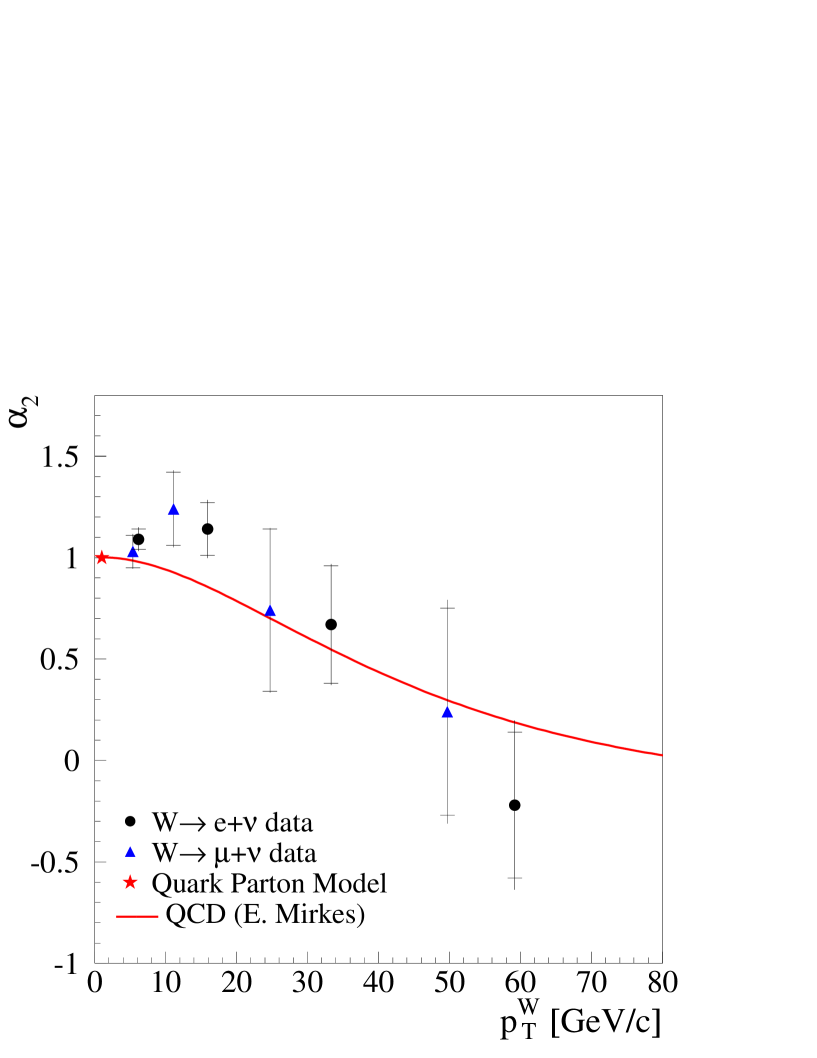
Fig. 15 shows the results of this measurement on a plot of versus . The position of the points on the axis has been determined by using the mean of the Monte Carlo distribution of corresponding to each recoil range. The solid curve represents the Standard Model prediction reported in [3]. The trend is a decrease of with increasing , which corresponds to an increase of the longitudinal component of the polarization. The rate measured from a linear fit is 15% per 10 GeV/. The four measurement points from the electron channel can be used together with those from the muon channel to compute a with respect to the Standard Model expectation. The result is =1.5, normalized for 8 degrees of freedom and considering statistical and systematic uncertainties.
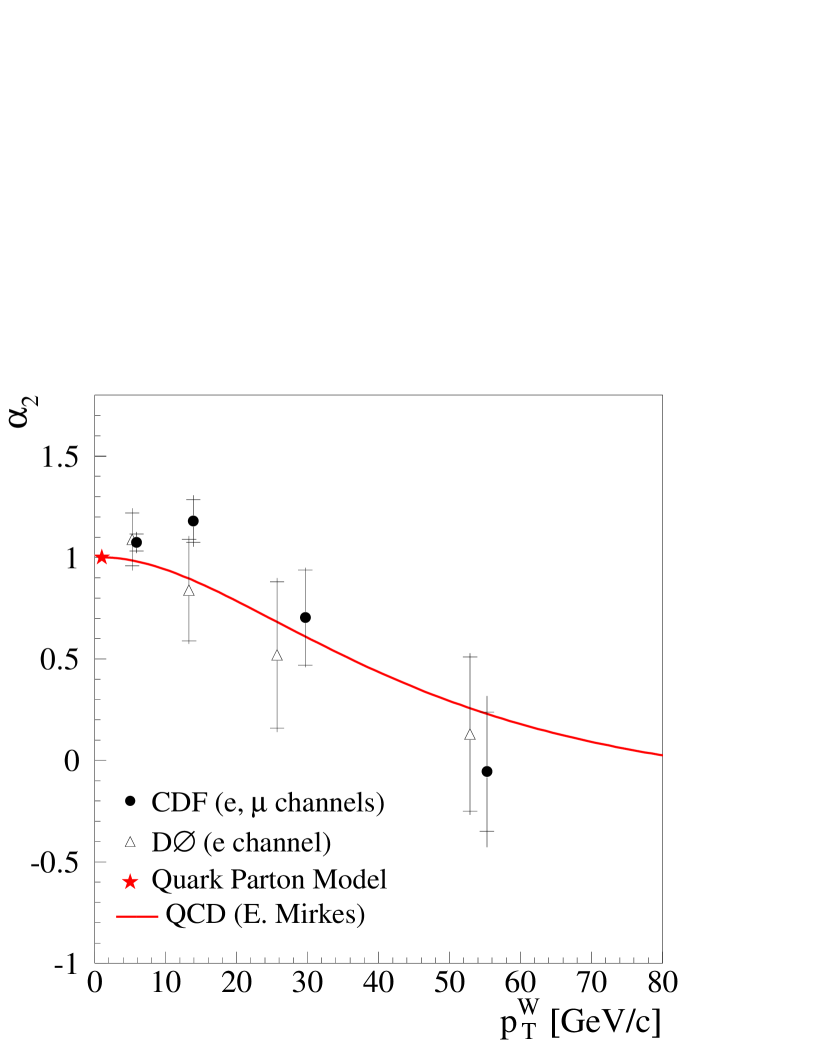
The measurements of with the electron and muon channels are combined in Fig. 16 and Table 7. The position in is determined by a weighted mean of each pair of electron and muon measurements. The values of are then scaled at the common value using a linear fit and then averaged taking into account the size of the statistical uncertainties. Systematic uncertainties are completely correlated between the electron and muon channels. The triangles are from [4] and represent the current best values.
| [GeV/] | (CDF combined) | (theory) |
|---|---|---|
| 5.9 | 1.070.04(stat)0.03(syst) | 0.98 |
| 13.9 | 1.180.10(stat)0.06(syst) | 0.89 |
| 29.7 | 0.700.23(stat)0.07(syst) | 0.61 |
| 55.3 | -0.050.29(stat)0.21(syst) | 0.23 |
In conclusion, we have measured the leptonic polar-angle distribution coefficient as a function of the transverse momentum of the boson. The results obtained from the electron and muon channels are combined together and the measurement reduces by about 50% the uncertainty on the current best values up to GeV/. The result is in good agreement with the Standard Model expectation up to NLO, whereby decreases with as a consequence of QCD corrections to the polarization. Since the uncertainty is largely dominated by statistics especially at higher transverse momenta, this measurement can significantly benefit from the larger data sample of collisions at TeV that is being collected at CDF in Run II.
ACKNOWLEDGMENTS
We thank the Fermilab staff and the technical staffs of the participating institutions for their vital contributions. This work was supported by the U.S. Department of Energy and National Science Foundation; the Italian Istituto Nazionale di Fisica Nucleare; the Ministry of Education, Culture, Sports, Science, and Technology of Japan; the Natural Sciences and Engineering Research Council of Canada; the National Science Council of the Republic of China; the Swiss National Science Foundation; the A.P. Sloan Foundation; the Bundesministerium fuer Bildung und Forschung, Germany; and the Korea Science and Engineering Foundation (KoSEF); the Korea Research Foundation; the Comision Interministerial de Ciencia y Tecnologia, Spain; and the Council for the Central Laboratory of the Research Councils, UK.
References
- [1] The Collins-Soper frame [2] is a rest frame where the proton-antiproton pair lies in the xz-plane and the z-axis is chosen to bisect the angle between the proton and the negative antiproton direction. The x direction is fixed by the transverse momentum of the gauge boson. The angles and are measured with respect to the z-axis and x-axis respectively. The proton and antiproton axes are seen to make an angle because of the transverse boost of the boson.
- [2] J.C. Collins and D.E. Soper, Phys. Rev. D16, 2219 (1977)
- [3] E. Mirkes, Nucl. Phys. B387, 3 (1992)
- [4] B. Abbott et al., Phys. Rev. D63, 072001 (2001)
- [5] L. Cerrito, Ph.D. thesis, University College London, RAL-TH-2002-006 (2002)
- [6] J. Strologas, Ph.D. thesis, University of Illinois at Urbana, FERMILAB-TH-2002-47 (2002)
- [7] F. Abe et al., Nucl. Inst. and Meth. A271, 387 (1988)
- [8] P. Azzi et al., Nucl. Inst. and Meth. A360, 137 (1995)
- [9] F. Snider et al., Nucl. Inst. and Meth. A268, 75 (1988)
- [10] F. Bedeschi et al., Nucl. Inst. and Meth. A268, 50 (1988)
- [11] L. Balka et al., Nucl. Inst. and Meth. A267, 272 (1988)
- [12] Y. Fukui et al., Nucl. Inst. and Meth. A267, 280 (1988)
- [13] G. Brandenburg et al., Nucl. Inst. and Meth. A267, 257 (1988)
- [14] G. Ascoli et al., Nucl. Inst. and Meth. A268, 33 (1988)
- [15] G. Ascoli et al., Nucl Inst. and Meth. A268, 41 (1988)
- [16] D. Amidei et al., Nucl. Inst. and Meth. A269, 51 (1988)
- [17] F. Abe et al., Phys. Rev. D64, 052001 (2001)
- [18] The CES determines the transverse development of an electromagnetic shower at shower maximum by measurement of the charge deposition on orthogonal strips and wires. The profile of the CES strip or wire cluster is compared to a template and a is formed as a goodness of the fit.
- [19] F.A. Berends, R. Pittau and R. Kleiss, Nucl. Phys. B424, 308 (1994)
- [20] E. Barberio and Z. Was, Comput. Phys. Comm. 79, 291 (1994)
- [21] E. Barberio, B. van Eijk and Z. Was, Comput. Phys. Comm. 66, 115 (1991)
- [22] U. Baur, S. Keller and D. Wackeroth, Phys. Rev. D59, 013002 (1999)
- [23] A.D. Martin, R.G. Roberts and W.J. Stirling, RAL-92-099 (1993)
- [24] K. Hagiwara et al., Phys. Rev. D66, 010001 (2002)
- [25] M.H. Reno, University of Iowa preprint UIOWA-94-01, (1994)
- [26] G.A. Ladinsky and C.-P. Yuan, Phys. Rev. D50, 4239 (1994)
- [27] R.K. Ellis and S. Veseli, Nucl. Phys. B511, 649 (1998)
- [28] R.K. Ellis, D.A. Ross and S. Veseli, Nucl. Phys. B503, 309 (1997)
- [29] P.B. Arnold and R.P. Kauffman, Nucl. Phys. B349, 381 (1991)
- [30] P.B. Arnold and M. Reno, Nucl. Phys. B319, 37 (1989)
- [31] P. Arnold, R.K. Ellis and M.H. Reno, Phys. Rev. D40, 912 (1989)
- [32] W.T. Giele and S. Keller, Phys. Rev. D57, 4433 (1998)
- [33] F. Abe et al., Phys. Rev. D52, 2624 (1995).
- [34] F. Abe et al., Phys. Rev. D50, 2966 (1994).
-
[35]
LEP WW Working Group, World Wide Web at
http://lepewwg.web.cern.ch/LEPEWWG/