Photoproduction of mesons off protons
for 0.75 GeV 3 GeV
Abstract
Total and differential cross sections for the reaction pp have been measured for photon energies in the range from 750 MeV to 3 GeV. The low–energy data are dominated by the S11 wave which has two poles in the energy region below 2 GeV. Eleven nucleon resonances are observed in their decay into p. At medium energies we find evidence for a new resonance N(2070)D15 with MeV. At energies above 1.5 GeV, a strong peak in forward direction develops, signalling the exchange of vector mesons in the channel.
pacs:
14.20Photoproduction experiments provide a sensitive tool to study baryon resonances. The information is complementary to experiments with hadronic beams and gives access to additional properties like helicity amplitudes. Baryon resonances have large, overlapping widths rendering difficult the study of individual states, in particular of those which are only weakly excited. This problem can be overcome partly by looking at specific decay channels. The meson has isospin and consequently, isospin conservation guarantees that the N final state can only be reached via formation of N∗ resonances. Contributions from resonances are excluded. The meson in the final state thus acts as an isospin filter, unlike the channel in which both, and states, can appear in the intermediate state. This selectivity of specific channels is particularly helpful for coupled–channel analyses. Resonances observed in N or N could belong to the N∗ or series, however, even a small coupling to the N channel identifies them as N∗ resonances.
In the near–threshold region, the –production process is strongly dominated by a single resonance, N(1535)S11 Krusche:nv . This resonance has continued to provoke many theoretical debates due to its unusual parameters. The branching ratio for N(1535)SN is much larger than for any other nucleon resonance. As a consequence, even the very nature of the N(1535)S11 as an excited nucleon has been questioned Kaiser:1995cy . Alternatively, its strong N coupling could be due to mixing between and quark model states IsgurKarl . Precise data on the shape of the N(1535)S11 resonance and on its photo–couplings should help to elucidate its nature. At present, the Particle Data Group (PDG) gives a range from 100 to 200 MeV for its width Hagiwara:fs . Clearly, high–statistics data covering a wide range of photon excitation energies are needed to define the properties of the N(1535)S11 more precisely and to identify contributions from other resonances to the N channel.
In this letter, we present total and differential cross sections for the reaction as measured with the CB–ELSA experiment at Bonn covering the entire resonance region and thus extending the already existing database Dytman:vm ; Soezueer ; Renard:2000iv ; Dugger:ft .
The experiment was carried out at the tagged photon beam of the ELectron Stretcher Accelerator (ELSA) at the University of Bonn. The experiment was described briefly in a preceding letter Bartholomy:04 where measurements of total and differential cross sections for photoproduction of mesons were reported. Also data reconstruction and analysis methods were described there. The analysis presented here differs only in the use of two decay modes of the meson, and . The acceptance of the detector was determined from GEANT–based Monte–Carlo simulations. To derive absolute cross sections the photon flux was used as determined for the reaction Bartholomy:04 .
Fig. 1 (a) shows the invariant mass spectrum after a confidence–level cut in a kinematic fit enforcing energy and momentum conservation. Since the proton is identified but not used as input for the kinematic fit, its momentum is determined by fitting, resulting in only one kinematic constraint. The meson is observed above a small residual background. In a final step, the mass of the was imposed for the determination of cross sections in a two–constraints kinematic fit (confidence level ). Fig. 1 (b) shows the 3 invariant mass spectrum, again above very little background. We imposed the pion mass for three pairs in a kinematic fit, resulting in four constraints. The data were selected by a confidence–level cut. The residual background events under the and peaks were subtracted using side bins. On average, there were one to four background events per measured bin.
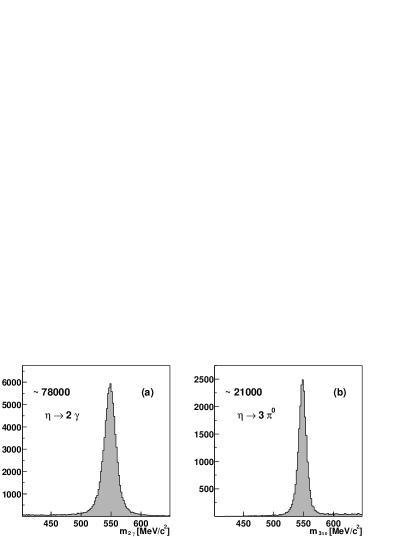
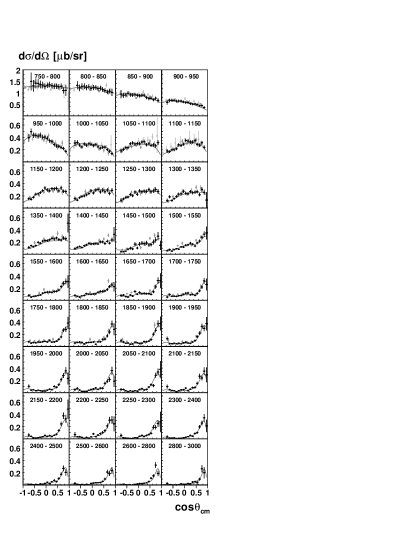
Fig. 2 shows the differential cross sections from both data sets combined. They are given as functions of the production angle in the center–of–mass system with respect to the beam axis. The data can be found numerically in durham .
The ratio over was determined for each bin in Fig. 2 and histogrammed, giving . This value agrees well with the PDG value Hagiwara:fs and demonstrates the good understanding of the detector response. It thus justifies to add the data from the two channels and .
The error bars in Fig. 2 represent the statistical and systematic errors added quadratically. The systematic errors were evaluated by changing, in the Monte Carlo simulation, the beam axis with respect to the barrel axis by mm, the position of the target center along by mm, and the thickness of material between target and inner detector by mm of capton foil. These contributions and a relative error of assigned to the reconstruction efficiency are added quadratically. An additional error due to the uncertainty of the normalization is not shown in Fig. 2. It is estimated to be 5% for photon energies up to 1.3 GeV and 15% above as discussed in Bartholomy:04 .
The overall consistency with data from GRAAL Renard:2000iv as well as from CLAS Dugger:ft is very good. At p invariant mass MeV/, there is a small discrepancy between those two data sets, particularly visible in the total cross section (Fig. 3). We emphasize that our data cover a larger solid angle and a wider energy range and have very little background below the peak. At a photon energy of about 750 MeV, our detection efficiency for events with low–energy protons in the backward direction (center–of–mass frame) suffers from a large systematic error. For photon energies below 1.3 GeV, the data are well reproduced by the partial wave analysis SAID Arndt:2003zk and the unitary isobar model MAID Chiang:np . Above, small deviations of data and SAID show up which become increasingly important at higher energies.
Experimental data for MeV to 3000 MeV: this work (black squares), TAPS Krusche:nv , GRAAL Renard:2000iv and CLAS Dugger:ft data (in light gray). The solid line represents the result of our fit. The error bars represent statistical and systematic errors but not normalization errors.
The data are interpreted in the framework of the approach developed in alexei . In addition to the data presented here, we include the Mainz–TAPS data Krusche:nv on photoproduction to cover the threshold region, beam–asymmetry measurements of and photoproduction GRAAL1 ; SAID1 ; GRAAL2 , our own data on Bartholomy:04 , and data on SAID2 . Resonances are described by relativistic Breit–Wigner amplitudes except for the two S11 resonances at 1535 and 1650 MeV for which we use a two–channel K–matrix (). The background is described by a reggeized –channel – exchange and by nucleon exchange in the and channel. The background amplitudes contribute to the data shown in Fig. 3.
Here we present the results on the p channel. The values for the final partial wave analysis solution are given in Tab. 1. The fit uses 11 N∗ resonances coupling to N. We consider fractional contributions above 1–2% as established in this analysis. The masses and widths of the observed states are presented in Tab. 2. We also include the ratio of the helicity amplitudes and the fractional contribution normalized to the total cross section for our photoproduction data. The errors are estimated from a large number of fits in which the number of resonances, their parameterization, and the relative weight of the different data sets is changed.
| Observable | Ref. | ||||
|---|---|---|---|---|---|
| CB–ELSA | 667 | 618 | 0.93 | ||
| TAPS | 100 | 160 | 1.60 | Krusche:nv | |
| GRAAL 98 | 51 | 97 | 1.90 | GRAAL2 | |
| GRAAL 04 | 100 | 164 | 1.64 | GRAAL1 | |
| CB–ELSA | 1106 | 1750 | 1.58 | Bartholomy:04 | |
| GRAAL 04 | 359 | 1980 | 5.50 | GRAAL1 | |
| SAID | 593 | 1470 | 2.48 | SAID1 | |
| SAID | 1583 | 4248 | 2.68 | SAID2 |
| Resonance | M (MeV) | (MeV) | Fraction | |
| 0.020 | ||||
| PDG | ||||
| ∗ | ||||
| PDG | 0.430 | |||
| ∗ | ||||
| PDG | ||||
| 0.001 | ||||
| PDG | ||||
| 0.005 | ||||
| PDG | ||||
| 0.004 | ||||
| PDG | ||||
| 0.300 | ||||
| PDG | ||||
| 0.007 | ||||
| 0.171 | ||||
| 0.011 | ||||
| 0.051 |
∗ K matrix fit, pole position
of the scattering amplitude in the complex plane, fraction for the total K–matrix contribution
Omitting the changes the by 200 for the data of Fig. 2. Replacing the assignment from to , …, , the deteriorates by more than 100. The closest description was obtained fitting with a state. For this assignment, the was worse by 106 for our data and by 96 for the beam asymmetry data GRAAL1 . However, the description of our data deteriorated by more than 500. We stress that was required in the analysis of the data of Fig. 2 alone.
Omitting the from the analysis changes the by 65 for our data and by 45 for the beam–asymmetry data. This resonance is less significant than the , and replacing it with a state makes the description of our data worse by only 24. However, the is still the preferred solution for the description of the data in the high mass region. We do not find evidence for a third S11 for which claims have been reported at masses of 1780 MeV Saghai:2003ch and 1846 MeV Chen:2002mn .
The differential cross sections were integrated to determine the total cross section (Fig. 3). The extrapolation to forward and backward angles uses the result of the partial wave analysis. The solid line represents the integration of the partial wave solution.
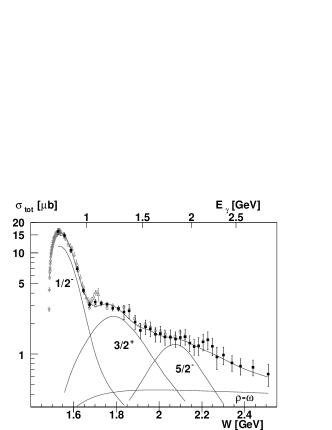
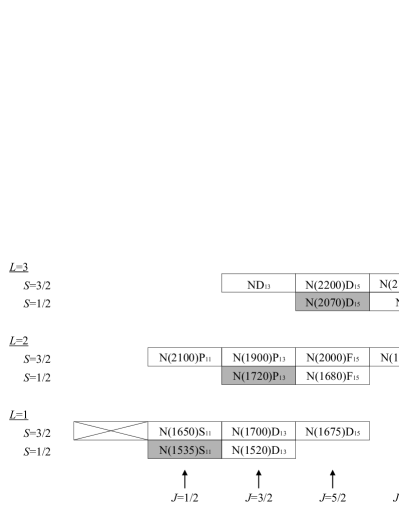
The most prominent contributions to the total cross section stem from a series of resonances with , , and and smaller contributions from and . The dominant contributions hence come from nucleon resonances to which, in the non–relativistic quark model, quantum numbers and (Fig. 4) could be assigned and which decay into N in a relative S, P, and D wave. We do not have an interpretation for this observation but obviously, a common explanation of these findings is required.
In summary we have reported a measurement of the total and differential cross sections for the photoproduction of mesons off protons over a wider range, in energy and in production angle, than covered by previously existing data. An isobar analysis of the data which additionally includes other data sets determines N couplings of eleven N∗ resonances, uncovers evidence for and gives an indication for .
We thank the technical staff at ELSA and at all the participating institutions for their invaluable contributions to the success of the experiment. We acknowledge financial support from the Deutsche Forschungsgemeinschaft (DFG). The collaboration with St. Petersburg received funds from DFG and the Russian Foundation for Basic Research. B. Krusche acknowledges support from Schweizerischer Nationalfond. U. Thoma thanks for an Emmy Noether grant from the DFG. A. V. Anisovich and A. V. Sarantsev acknowledge support from the Alexander von Humboldt Foundation. This work comprises part of the PhD thesis of O. Bartholomy.
References
- (1) B. Krusche et al., Phys. Rev. Lett. 74 (1995) 3736.
- (2) N. Kaiser, P. B. Siegel, and W. Weise, Phys. Lett. B 362 (1995) 23.
- (3) N. Isgur and G. Karl, Phys. Lett. B 72 (1977) 109
- (4) K. Hagiwara et al., Phys. Rev. D 66 (2002) 010001.
- (5) S. A. Dytman et al., Phys. Rev. C 51 (1995) 2710.
- (6) L. Soezueer et al., http://gwdac.phys.gwu.edu.
- (7) F. Renard et al., Phys. Lett. B 528 (2002) 215.
- (8) M. Dugger et al., Phys. Rev. Lett. 89 (2002) 222002 [Erratum-ibid. 89 (2002) 249904].
- (9) O. Bartholomy et al., preceeding article.
- (10) http://durpdg.dur.ac.uk/hepdata/reac.html, CREDE 03.
- (11) R. Arndt et al., Phys. Rev. C 66 (2002) 055213.
- (12) W. T. Chiang et al., Phys. Rev. C 68 (2003) 045202.
- (13) A. V. Anisovich, E. Klempt, A. V. Sarantsev, and U. Thoma, hep-ph/0407211.
- (14) We thank the GRAAL collaboration for providing their data to us prior to publication.
-
(15)
A. A. Belyaev et al.,
Nucl. Phys. B 213 (1983) 201.
R. Beck et al., Phys. Rev. Lett. 78 (1997) 606.
D. Rebreyend et al.,Nucl. Phys. A 663 (2000) 436. - (16) J. Ajaka et al., Phys. Rev. Lett. 81 (1998) 1797.
-
(17)
K. H. Althoff et al.,
Z. Phys. C 18 (1983) 199.
E. J. Durwen, BONN-IR-80-7 (1980).
K. Buechler et al., Nucl. Phys. A 570 (1994) 580. - (18) B. Saghai and Z. Li, Pittsburgh 2002, Physics of excited nucleons, 166–170, arXiv:nucl-th/0305004.
- (19) G. Y. Chen et al., Nucl. Phys. A 723 (2003) 447.