D. Cronin-Hennessy
C. S. Park
W. Park
J. B. Thayer
E. H. Thorndike
University of Rochester, Rochester, New York 14627
T. E. Coan
Y. S. Gao
F. Liu
R. Stroynowski
Southern Methodist University, Dallas, Texas 75275
M. Artuso
C. Boulahouache
S. Blusk
E. Dambasuren
O. Dorjkhaidav
R. Mountain
H. Muramatsu
R. Nandakumar
T. Skwarnicki
S. Stone
J.C. Wang
Syracuse University, Syracuse, New York 13244
A. H. Mahmood
University of Texas - Pan American, Edinburg, Texas 78539
S. E. Csorna
Vanderbilt University, Nashville, Tennessee 37235
G. Bonvicini
D. Cinabro
M. Dubrovin
Wayne State University, Detroit, Michigan 48202
A. Bornheim
E. Lipeles
S. P. Pappas
A. Shapiro
W. M. Sun
A. J. Weinstein
California Institute of Technology, Pasadena, California 91125
R. A. Briere
G. P. Chen
T. Ferguson
G. Tatishvili
H. Vogel
M. E. Watkins
Carnegie Mellon University, Pittsburgh, Pennsylvania 15213
N. E. Adam
J. P. Alexander
K. Berkelman
V. Boisvert
D. G. Cassel
J. E. Duboscq
K. M. Ecklund
R. Ehrlich
R. S. Galik
L. Gibbons
B. Gittelman
S. W. Gray
D. L. Hartill
B. K. Heltsley
L. Hsu
C. D. Jones
J. Kandaswamy
D. L. Kreinick
V. E. Kuznetsov
A. Magerkurth
H. Mahlke-Krüger
T. O. Meyer
N. B. Mistry
J. R. Patterson
T. K. Pedlar
D. Peterson
J. Pivarski
S. J. Richichi
D. Riley
A. J. Sadoff
H. Schwarthoff
M. R. Shepherd
J. G. Thayer
D. Urner
T. Wilksen
A. Warburton
M. Weinberger
Cornell University, Ithaca, New York 14853
S. B. Athar
P. Avery
L. Breva-Newell
V. Potlia
H. Stoeck
J. Yelton
University of Florida, Gainesville, Florida 32611
B. I. Eisenstein
G. D. Gollin
I. Karliner
N. Lowrey
C. Plager
C. Sedlack
M. Selen
J. J. Thaler
J. Williams
University of Illinois, Urbana-Champaign, Illinois 61801
K. W. Edwards
Carleton University, Ottawa, Ontario, Canada K1S 5B6
and the Institute of Particle Physics, Canada
D. Besson
University of Kansas, Lawrence, Kansas 66045
K. Y. Gao
D. T. Gong
Y. Kubota
S. Z. Li
R. Poling
A. W. Scott
A. Smith
C. J. Stepaniak
J. Urheim
University of Minnesota, Minneapolis, Minnesota 55455
Z. Metreveli
K. K. Seth
A. Tomaradze
P. Zweber
Northwestern University, Evanston, Illinois 60208
J. Ernst
State University of New York at Albany, Albany, New York 12222
K. Arms
E. Eckhart
K. K. Gan
C. Gwon
Ohio State University, Columbus, Ohio 43210
H. Severini
P. Skubic
University of Oklahoma, Norman, Oklahoma 73019
S. A. Dytman
J. A. Mueller
S. Nam
V. Savinov
University of Pittsburgh, Pittsburgh, Pennsylvania 15260
G. S. Huang
D. H. Miller
V. Pavlunin
B. Sanghi
E. I. Shibata
I. P. J. Shipsey
Purdue University, West Lafayette, Indiana 47907
I. Danko
Rensselaer Polytechnic Institute, Troy, New York 12180
Abstract
The CLEO Collaboration has made the first observations of
hadronic
transitions among bottomonium () states
other than the dipion transitions among states.
In our study of decays,
we find a significant signal for
that is consistent with radiative decays ,
followed by .
The branching ratios we obtain are
and
,
in which the first error is statistical and
the second is systematic.
pacs:
13.25.Gv,14.40.Gx
††preprint: CLNS 03/1840††preprint: CLEO 03-12
The only hadronic decays of bottomonia that have
been experimentally observed to date are the
( and ) transitions among
the states expt3s .
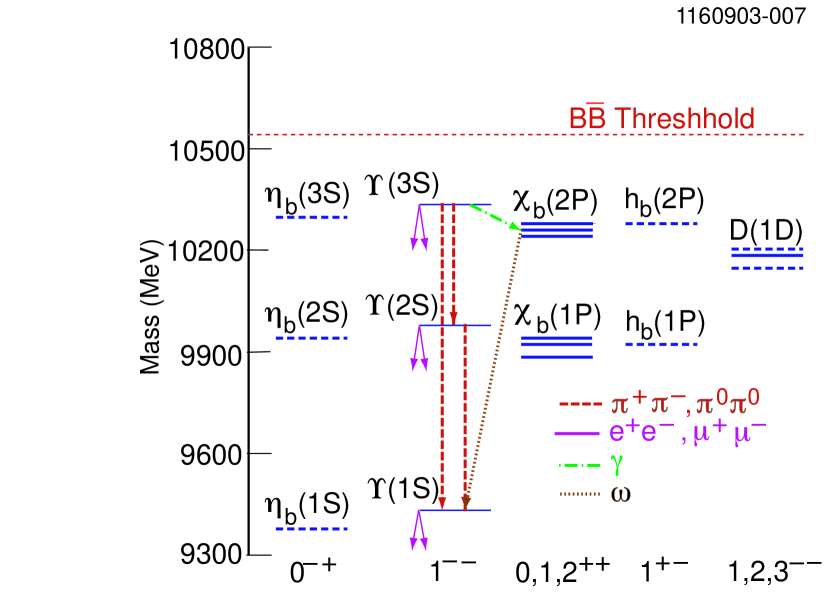
In Fig. 1 we show the spectrum of
bottomonium states below open bottom threshold.
Hadronic transitions among heavy quarkonia are
generally understood to proceed by the emission of
soft gluons, and
subsequent hadronization of the gluons.
The analysis of heavy quarkonium hadronic transitions
is one of few possible laboratories for the study of
the physics of the soft gluon emission and
hadronization process that governs such decays.
Most theoretical work dedicated to these transitions has been built around
a multipole expansion of the color field, an idea first proposed
by Gottfried and Yan gottyan .
A fairly substantial literature exists which attempts to
describe in detail the transitions that have been
observed theory .
While these transitions do provide
important information about strong interaction
dynamics in heavy quark systems, the investigation
of other hadronic decay modes (i.e., involving ,
or multiple ) should offer a different perspective.
In the multipole expansion model,
a hadronic transition involving requires
three gluons in an
configuration yanpriv . For such a purely electric coupling,
Voloshin volo has recently predicted roughly equal rates for the
decay of the two
states and to
.
In this Letter, we report on the observation of
the transitions .
Figure 1: The spectrum of bottomonium states below open bottom
threshold. Dilepton decays of
the states are denoted by the solid lines, while dipion
transitions are denoted by dashed lines. The radiative decay
is indicated by the dot-dashed line, and
the decay by
the dotted line.
The data set consists of
decays observed with
the CLEO III cleo3det detector at the Cornell Electron Storage Ring.
Charged particle tracking is done by the 47-layer drift
chamber and a four-layer silicon
tracker which reside in a 1.5 T solenoidal magnetic field.
Photons are detected using an electromagnetic calorimeter
consisting of 7784 CsI(Tl) crystals distributed in a
projective barrel geometry.
The particle-identification capabilities of the CLEO III
detector are not used in the present analysis.
Events consistent with the
final state of
are selected by
requiring two high momentum charged tracks ()
and two or three charged low momentum tracks
().
The low momentum tracks
are required to come from the interaction region
using criteria obtained by studying charged pion tracks
in a sample of events from the
kinematically similar decay .
We require events to contain an candidate
by requiring that the two high momentum tracks in the
event have an invariant mass in the range 9300 to 9600 MeV,
consistent with
the mass.
We make no cuts on the track quality variables for
the lepton candidate tracks, nor do we
require them to satisfy lepton-identification criteria.
The invariant mass requirement alone
provides a nearly background free sample,
and imposition of lepton-identification criteria
only leads to larger systematic uncertainties and reduced
signal efficiency without much improvement in
signal quality.
We require events to have three or four
showers in the calorimeter, each of which
has MeV,
and is not matched to any
charged track. Two of these showers must
form an invariant mass within three standard deviations
of the known
mass. These candidates are kinematically constrained
to the known mass, in order to improve the
momentum resolution of the candidates.
In addition to the two showers that correspond to the
, events must contain an isolated photon candidate,
between and MeV in energy, that does not
form an invariant mass within
of the mass
with any other shower. Furthermore we require that
the polar angle of the third shower satisfy
,
the angular region in which CLEO’s energy resolution is best.
We allow events to contain up to one additional shower
in the range .
In addition, we allow for the possibility of one spurious charged
track candidate in addition to the four “signal” tracks.
Such spurious tracks may arise from failures in pattern recognition
or from delta rays. Spurious showers may arise from synchrotron
radiation from the beams or as a result of
random noise in the calorimeter.
If a given event yields more than one candidate due to
the presence of an additional shower or track,
we choose the candidate for which the sum of energies of
all final state particles is nearest .
Because there is no phase space
for a pair of kaons for decays in which a
is present, we assume that the
low momentum charged tracks are pions.
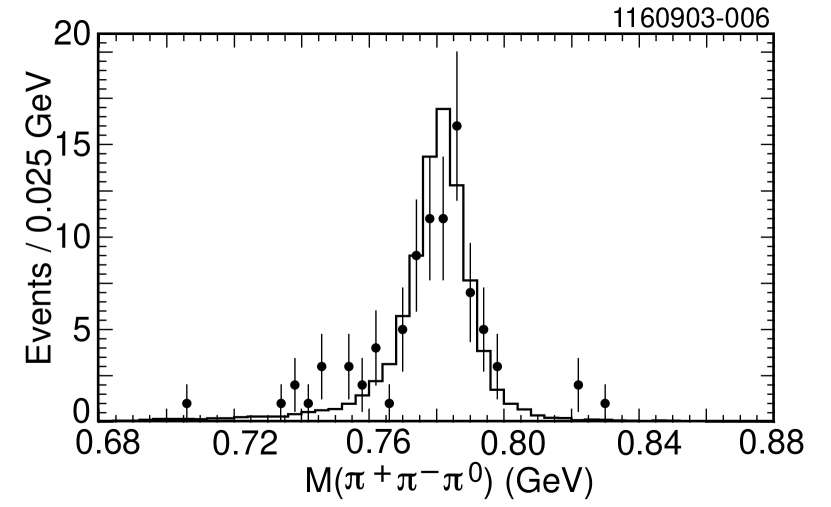
The invariant mass of the combination,
plotted in Fig. 2,
exhibits a clear
enhancement at the mass of ,
pdg2002 .
Figure 2: The invariant mass, for data events
subject to final analysis cuts with the exception of
the cut on the
of the kinematic fit to .
The overlaid histogram shows signal Monte Carlo events
(normalized to the same total number) and indicates the
good reproduction by the Monte Carlo of the
shape and location of the peak.
To complete the reconstruction of the full
decay chain,
,
we require that the be less than two
for a kinematic fit of constrained
to the mass,
and subsequently that the
mass recoiling against the
kinematically fitted candidate
and the photon
lies within MeV of pdg2002 .
The simplest explanation for the observed events is the
decay sequence , with
.
The lowest mass state,
, lies below threshold for decay to .
In principle a transition through the state
(see Fig. 1) is possible, but this state has
never been observed, and, furthermore, the energy of the
photon in the decay is
expected to be below the range of observed energies in
the data.
Backgrounds from ordinary quark pair production are
extremely small because of the presence
of the decay
in the signal sample. The only significant source of
background expected is known cascades from .
The final state of may be reached through:
In the first case, the final state of interest
can be produced by
the addition of a spurious shower in the calorimeter.
In the second case, it
may be reached by loss of one photon from one of the neutral pions
due to acceptance or energy threshold.
Backgrounds produced through either of these
two processes are removed by excluding events in which
the mass recoiling against the two charged pions
in the reference frame
is consistent (i.e., between 9.78 and 9.81 GeV)
with the hypothesis that the
system is recoiling against
in the process .
Two other decay sequences can yield
the final state of
:
the decay , with
the decaying either to ,
or to followed by .
In each of these cases, however, the charged pions are
too soft to produce spurious candidates
for the signal decay chain.
In order to evaluate residual background, we
generated a GEANT geant Monte Carlo sample for the channel
,,
,
corresponding to million decays,
or times our data set.
The uncertainty on the equivalent number of
decays is due to the error on the branching
ratios needed to convert our number of generated events
to the equivalent number of decays.
This Monte Carlo sample produced one event
that satisfied our selection criteria.
We therefore expect events
due to this source. We also generated a Monte Carlo sample of
,
corresponding to million decays,
or times our data set.
From this sample, a total of nine events passed our selection.
In our data set, we thus
expect events
due to this source.
To account for the residual background,
we subtract the expected contribution of
0.30 events from the observed yield.
We conservatively set a systematic error
of events due to this subtraction.
To evaluate the signal detection efficiency , we
generated 150,000 Monte Carlo events
for each of and
, proceeding through the sequence
,
and uniform angular
distributions for the
and decays. The masses for all
particles in the decay chain
were taken from Ref. pdg2002 .
The analysis cuts described above are
applied to these samples, and we obtain
and
,
including all selection criteria, acceptance and trigger efficiencies.
We apply an additional relative systematic error of
to the efficiency in order to account for the possibility that
the retains the initial polarization of the .
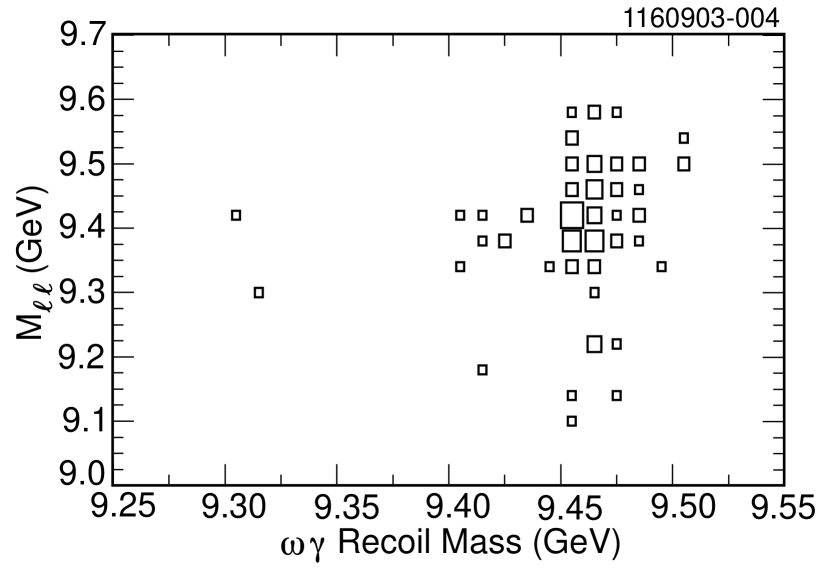
In order to illustrate the purity of the signal,
in Fig. 3, we present a scatter plot
of the mass recoiling against the system versus the
dilepton invariant
mass for all events subject to all the cuts discussed above,
except those on the variables plotted.
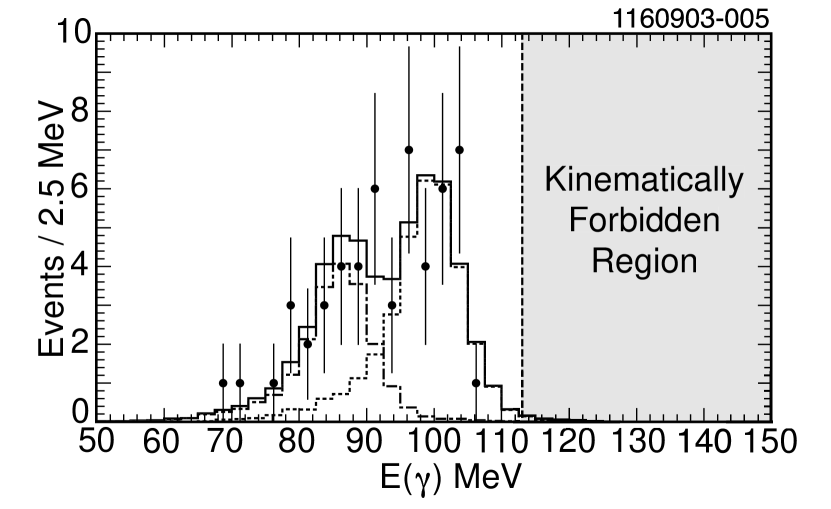
The final spectrum is
shown in Fig. 4.
The observed yield has possible contributions from both
decay sequences involving and intermediate
states.
To obtain branching fractions for the
and transitions,
we perform a maximum likelihood fit of
the spectrum.
The expected photon spectra for transitions to
and were obtained from
the signal Monte Carlo samples, and the observed
spectrum was then fit to normalized Monte Carlo
lineshapes with intensities (or yields) for and
as the free parameters.
We obtain yields of and events,
respectively. These yields have statistical significances of
and , respectively, obtained by comparing
the likelihood of our final fitted yield to those of
fits with zero signal events.
The histogram resulting from the best fit is shown superimposed
on the data in Fig. 4.
Figure 3: Plot of recoil mass versus dilepton mass, for data events
subject to the final set of cuts, with the exception of
the cuts on the two variables plotted.
The number of events represented by each square range from one to four.
Figure 4: Fitted photon energy spectrum for the
final selection of events. The solid histogram shows contributions
for both and , while the
dotted and dashed histograms show the individual and
contributions, repsectively.
The dotted line indicates the region above which
energies are disallowed for lack of phase space.
The expected background contribution of
0.30 events is subtracted from the fitted yield
by assuming that it scales as the
ratio of the individual yields to the total yield.
We thus obtain the following product branching ratios, using the
detection efficiency and number of decays discussed above:
(1)
(2)
in which the first uncertainty is statistical and the second is
systematic.
The statistical error of nearly is dominant.
Systematic error contributions to the above
product of branching ratios are the following:
uncertainty in the number of ,
per charged track (a total of ) for track finding,
for reconstruction, for radiative
reconstruction, for Monte Carlo statistics,
for the assumption of uniform
angular distribution,
and for background subtraction.
These contributions, added in quadrature, result in an
overall relative systematic error of
.
Using the present world average
branching fractions pdg2002 for
,
(taken to be
twice that of
,
and ,
we obtain
(3)
(4)
The systematic errors include the additional uncertainty on
the branching ratios for
,
and ,
which
contribute at the level of .
We may also calculate the ratio of to
branching ratios, for which several of the
systematic errors discussed above cancel.
We obtain this through a maximum likelihood fit
to the spectrum, in which the two free
parameters are the sum of yields and the ratio of
to yields.
When this fit is performed, we obtain a sum of
yields equal to
and a ratio of .
In order to convert the ratio of yields
to the ratio of branching ratios, we
multiply the yield ratio by
a factor of .
(5)
(6)
The only systematic errors which do not cancel in this ratio
are the small uncertainties in
efficiency and
branching
ratios. These are entirely negligible compared to
the output statistical error from the maximum likelihood fit.
In Ref. volo , Voloshin predicts on the basis of
S-wave phase space factors, for
gluon configurations
expected by the multipole expansion model yanpriv ,
that
The ratio of full widths
lies in the range of 1.25-1.5, using world average
measurements of and
theoretical predictions for the rates
predwidths .
Thus the branching ratios
are expected to be approximately equal.
Our measurement is in agreement with this expectation.
In summary,
we have made the observation of the first hadronic decay modes
involving non-vector states using a sample of
decays collected by CLEO III.
The discovery comes in the phase-space limited
channels . We find that
the ratio of the
measured branching ratios for the two transitions
are in agreement with
theoretical expectations based
on S-wave phase space factors for multipole expansions.
We gratefully acknowledge the effort of the CESR staff
in providing us with
excellent luminosity and running conditions.
This work was supported by
the National Science Foundation,
the U.S. Department of Energy,
the Research Corporation,
and the
Texas Advanced Research Program.
References
(1) See, e.g.,
F. Butler et al., Phys. Rev. D 49, 40 (1994);
I. Brock et al., Phys. Rev. D 43, 1448 (1991);
J. Green et al., Phys. Rev. Lett. 49, 617 (1982);
Q. Wu et al., Phys. Lett. B 301 307 (1993);
G. Mageras et al., Phys. Lett. B 118 453 (1982).
(2)
K. Gottfried, Phys. Rev. Lett. 40, 598 (1978);
T. M. Yan, Phys. Rev. D 22, 1652 (1980).
(3)
Y. P. Kuang and T. M. Yan, Phys. Rev. D 24, 2874 (1981);
M. Voloshin and V. Zakharov, Phys. Rev. Lett. 45, 688 (1980);
V. A. Novikov and M. A. Shifman
Zeit. Phys. C 8 (1981) 43;
M. E. Peskin, in
“Dynamics and Spectroscopy at High Energy”,
Proceedings of the Eleventh SLAC Summer Institute on Particle Physics,
SLAC Report 267, 1984;
P. Moxhay, Phys. Rev. D 39, 3497 (1989);
H-Y. Zhou and Y.-P. Kuang, Phys. Rev. D 44, 756 (1991);
G. Bélanger, T. DeGrand and P. Moxhay, Phys. Rev. D 39, 257 (1989);
S. Chakravarty and P. Ko, Phys. Rev. D 48, 1205 (1993);
S. Chakravarty, S. M. Kim and P. Ko, Phys. Rev. D 50, 389 (1994);
T. Komada, M. Ishida and S. Ishida, Phys. Lett. B 508 31 (2001).
(4) T-M. Yan, private communication, 2003.
(5) M. Voloshin, Mod. Phys. LettA̱ 18,1067 (2003).
(6) CLEO Collaboration, CLNS-94-1277; D. Peterson et al.,
Nucl. Instr. Meth.A478 142 (2002).
(7) Particle Data Group, K. Hagiwara et al., Phys. Rev. D 66, 1 (2002).
(8) R. Brun et al., GEANT 3.15, CERN Report No. DD/EE/84-1 (1987).
(9) Obtained by using the radiative branching fractions
of from Ref. pdg2002 and predictions for their E1 partial
widths found in W. Kwong and J. L. Rosner, Phys. Rev. D 38, 279 (1988) and
S. Gupta, S. F. Radford and W. W. Repko, Phys. Rev. D 34, 201 (1986).