Combination of CDF and DØ Results on Boson Mass and Width
Abstract
The results based on 1992-95 data (Run 1) from the CDF and DØ experiments on the measurements of the boson mass and width are presented, along with the combined results. We report a Tevatron collider average GeV. We also report the Tevatron collider average of the directly measured boson width GeV. We describe a new joint analysis of the direct mass and width measurements. Assuming the validity of the standard model, we combine the directly measured boson width with the width extracted from the ratio of and boson leptonic partial cross sections. This combined result for the Tevatron is GeV. Finally, we use the measurements of the direct total width and the leptonic branching ratio to extract the leptonic partial width MeV.
pacs:
PACS numbers: 14.70.Fm, 12.15.Ji, 13.38.Be, 13.85.Qk
I Introduction
We present new combined results on the boson mass and width from the CDF and DØ experiments at the Fermilab Tevatron. We document the combination methodologies and summarize the results and the various sources of uncertainty, identifying those sources that produce correlated uncertainty between the two experiments’ results. We also present the combination with the UA2 and LEP results. These measurements represent some of the main goals of the electroweak physics program at the Tevatron collider.
The boson mass and width are important parameters in the electroweak gauge sector of the standard model(SM) [3]. The boson, along with the boson and the photon, provides a unified description of the electroweak interaction as a gauge interaction with the symmetry group . If this were an unbroken symmetry, the and bosons would be massless. The mass of the boson and its couplings, which determine its width, are therefore of substantial relevance to tests of the structure of the theory and the nature of electroweak symmetry breaking.
In the SM the boson mass is related to other parameters, and in the “on shell” scheme [4] it can be written as
| (1) |
where is the electromagnetic coupling constant and is Fermi coupling constant measured in muon decay. The electroweak radiative correction receives calculable contributions from loops containing the quarks, the Higgs boson (which is the hypothetical agent of electroweak symmetry breaking), and any other hypothetical particles such as supersymmetric particles coupling to the boson. Since the top quark mass has been measured [5, 6], the loop correction can be calculated. A precise measurement of the boson mass therefore constrains the mass of the Higgs boson, which has not yet been experimentally observed. Should the Higgs boson be discovered in the future, the comparison between its directly measured mass and the indirect constraint will be a very interesting test of the SM. In the minimal supersymmetric extension of the standard model (MSSM), for example, loop corrections due to supersymmetric particles can contribute up to 250 MeV [7] to the predicted boson mass.
In the SM bosons decay leptonically: where , or hadronically: , where . The leptonic partial width can be calculated [8] :
| (2) |
where the SM radiative correction is calculated to be less than 0.5%. Including the QCD radiative corrections for the quark decay channels, the SM prediction for the leptonic branching ratio [9] is:
| (3) |
Given the precision of these SM calculations, their comparison with the measured boson width provides an important test of the SM.
The precision of the boson mass and width measurements from the LEP experiments (ALEPH, DELPHI, L3 and OPAL) and the Tevatron collider experiments (CDF and DØ) is similar, implying that our best knowledge comes from the combined results of all these experiments. The measurements are quite intricate with many inputs and incorporate constraints from data and physics models. In this situation a simple average of all measurements, with the assumption that they are completely independent, may be biased in the value or the uncertainty.
In this paper we present systematic analyses of the mass and width measurements published by the CDF and DØ experiments at Fermilab. Following a brief description of the observables in Section II, we discuss our methodology and calculations. In Section III, we consider the boson mass as the parameter of interest and consider all other parameters needed for its measurement as external inputs, including the width. We review the uncertainties on these external parameters as described in the respective CDF and DØ publications, identifying the relevant correlations. This information is used to construct the covariance matrix for combining the mass measurements.
In Section IV, we perform the same analysis for the direct measurement of the boson width. This is again a one-parameter analysis, where in particular the mass is treated as an external input.
In Section V, we present a new methodology for treating the boson mass and width simultaneously in a two-parameter analysis. This method departs from the previously published results in that no external information is used for either of these parameters. This has two significant advantages over the one-parameter analyses that are usually performed: (i) theoretical model dependence is reduced, making the results more meaningful and easier to interpret, and (ii) correlation with other methods of measuring the mass and width is reduced, making subsequent comparisons and combinations more powerful. We also demonstrate that the joint two-parameter analysis results in no loss of precision, compared to the separate one-parameter analyses of the mass and width.
In Section VI, we review the analyses of the ratio () of and boson cross sections in the leptonic channels, as published by the CDF and DØ collaborations. With some SM assumptions and measured inputs, this ratio can be converted into a measurement of the leptonic branching ratio of the boson, and further into a measurement of the boson width. We present an analysis of the correlated uncertainties and the external inputs used to extract the width. Assumptions made in the extraction of the width from are compared and contrasted with the direct lineshape measurement in Section II.
We conclude the paper with Section VII, discussing future implementations of the methodologies presented here. We suggest certain additional information that can be published by the individual collaborations regarding details of their analyses. We also mention those aspects where the collaborations may adopt analysis practices that are more consistent with each other. We hope that these comments will be useful for future efforts.
II Tevatron Observables
We summarize here the observables described by CDF and DØ in their respective publications [10, 11, 12, 13, 14, 15, 16]. The directly measured boson mass and width [10, 11, 12, 13] correspond to the pole mass and pole width in the Breit-Wigner line shape with energy-dependent width, as defined by the differential cross section
| (4) |
where is the center-of-mass energy of the annihilating partons. represents the partonic luminosity in hadron-hadron collisions
| (5) |
where and represent parton flavors, represent the respective parton distribution functions, is the momentum fraction of the parton, and is the hadron-hadron center-of-mass energy.
The decay channels used for these measurements [10, 11, 12, 13] are the channel (by CDF and DØ) and the channel (by CDF). The boson mass and width are extracted by analyzing the Jacobian edge and the high mass tail respectively of the transverse mass () distribution
| (6) |
where and represent the transverse momentum and azimuthal angle respectively of the leptons. DØ has also measured the boson mass by analyzing the Jacobian edge in the electron and neutrino distributions. The CDF result for the boson mass is quoted using the fit, while the DØ result combines the fit and the lepton fits taking the correlations into account.
The boson width is also extracted [14, 15, 16] from the measured ratio of partial cross sections
| (7) | |||||
| (8) |
by using as inputs the calculated ratio of total cross sections, the measured branching ratio from LEP and the SM calculation of the partial width .
Eqn. 4 gives the differential cross section for the Drell-Yan process. The extraction of and using Eqn. 4 assumes the following:
-
1.
the boson propagator can be described by the relativistic Breit-Wigner distribution in quantum field theory, and
-
2.
the production of bosons in hadron-hadron collisions can be described by a factorizable process, with no additional interactions between the initial and final states. Since the leptonic final states are used for the measurements, there is no strong interaction between the initial state and the final state. Electroweak corrections are considered in the analyses. Higher twist effects, which in principle alter the effective partonic luminosity factor , are in practice negligible for .
-
3.
backgrounds to the Drell-Yan process from , and production are small; in practice, these rare processes are further suppressed by analysis selection cuts and produce essentially no contamination.
In addition to the above, the extraction of and from assumes that the and boson couplings to the leptons and light quarks are known, so that the inclusive cross section ratio can be calculated. The boson leptonic branching ratio is well-measured at LEP. Uncertainties associated with are discussed in Section VI.
III Boson Mass
The Run 1 boson mass measurements from CDF [10] and DØ [11] are
| (9) | |||||
| (10) |
We discuss the sources of uncertainty and classify them as being either uncorrelated between the two experimental results, or (partially or completely) correlated.
A Uncorrelated Uncertainties
The measurement and analysis techniques used by both experiments rely extensively on internal calibration and collider data to measure detector response and constrain theoretical model inputs. The bulk of the uncertainty is therefore uncorrelated. We itemize the uncorrelated sources below. The following discussion also applies to the uncorrelated uncertainties in the direct measurement of the boson width (see Section IV).
-
statistics in the kinematic distributions used for the mass fits.
-
Detector energy response and resolution measured using resonances (, , and ). Model uncertainty from resonance line shapes is negligible. These data are used for the calibration of lepton energy response (calorimetry and tracking for electrons and tracking for muons). The data are also used for calibrating the calorimeter response to the hadronic activity recoiling against the vector boson. In the CDF analysis, the lepton response and resolution and the hadronic recoil are modelled by empirical functions whose parameters are constrained independently for the electron and muon channel. Therefore in the internal CDF combination of these measurements, uncertainties in the lepton and recoil models are uncorrelated between channels. DØ performs independent empirical fits to their data which are uncorrelated with CDF fits.
-
Selection biases and backgrounds are unique to each experiment and are measured mostly from collider data, with some input from detector simulation for estimating selection bias. These uncertainties are uncorrelated between the CDF electron and muon channel measurements. CDF has no selection bias for electrons (in contrast with DØ) because the selection cuts rely more heavily on tracking rather than calorimeter isolation, and because of a more inclusive triggering scheme.
-
The distribution of the transverse momentum () of the boson is a model input, which each experiment constrains individually by fitting the boson distribution. Phenomenological models such as that of Ellis, Ross and Veseli [17] or that of Ladinsky and Yuan [18] are treated as empirical functions which, after folding in the detector response, adequately describe the observed distribution. The distribution is specified by model parameters along with and the parton distribution functions (PDFs). The uncertainty is dominated by statistics, with small dependence on the PDFs and . The latter introduces a small correlation between the two experiments which can be neglected at this level***Individual sources of uncertainty below about 3 MeV are typically not enumerated by the CDF and DØ experiments when the results are reported.. A potentially correlated uncertainty in the theoretical relationship between the boson and the boson spectra is assumed to be negligible. There is a small (3 MeV) correlated component in the uncertainty between the CDF electron and muon channel results.
-
The sources of background are where one of the leptons is lost, , and misidentified QCD jet events. The background is estimated using individual detector simulations. The uncertainty on the background is negligible. The jet misidentification background is estimated by using loosely defined lepton data samples which enhances the background contribution (DØ), or by selecting lepton candidates that fail quality cuts (CDF). While the techniques are similar in principle they differ in detail. CDF has also confirmed the jet misidentification background estimate using a photon conversion sample. The background uncertainties and cross-checks are statistics-limited and therefore independent.
Table I shows the contributions to the uncertainty which are uncorrelated between the CDF and DØ measurements, taken from the respective publications [10, 11] of the 1994-95 data as examples. All of these uncertainties should reduce in the future with more data, as the detector simulation and production/decay model is tuned with higher precision, and backgrounds are reduced with tighter cuts.
| Source | CDF | CDF | DØ |
|---|---|---|---|
| statistics | 100 | 65 | 60 |
| Lepton scale | 85 | 75 | 56 |
| Lepton resolution | 20 | 25 | 19 |
| 20 | 15 | 15 | |
| Recoil model | 35 | 37 | 35 |
| Selection bias | 18 | - | 12 |
| Backgrounds | 25 | 5 | 9 |
B Correlated Uncertainties
Sources of correlated uncertainty are associated with the modeling of production and decay, which we itemize below. The uncertainties are fully correlated between CDF and DØ, with possibly different magnitudes.
-
The boson kinematic distributions used in the fits are invariant under longitudinal boosts because they are derived from transverse quantities. The sensitivity to the PDFs arises because of acceptance cuts on the charged lepton rapidity. As the rapidity acceptance increases the sensitivity to PDFs reduces. The DØ boson mass measurement includes electrons up to pseudorapidity , and the CDF measurement includes electrons and muons up to . The PDF uncertainty is correlated but different for the two measurements.
-
The Breit-Wigner line shape has an uncertainty due to the variation in the mass dependence of the partonic luminosity. This is a small contribution which DØ quotes separately, but CDF subsumes into the overall PDF uncertainty.
-
QED radiative corrections in leptonic boson decays are evaluated by both experiments using the Berends and Kleiss [19] calculation. The uncertainty is evaluated by comparing to the PHOTOS [20] program and/or the calculation of Baur et al. [21]. The higher order QED effects have a different impact on the electron and muon channel measurements from CDF and the electron measurement from DØ due to differences in energy measurement techniques. We find that in the combined electron and muon channel result of CDF, the effective uncertainty due to QED radiative corrections is 11 MeV. This contribution is fully correlated with the corresponding uncertainty in the DØ result.
-
The width input into the boson mass measurement is provided differently by CDF and DØ. CDF uses the SM prediction for for the fitted value of and the resulting uncertainty is negligible. DØ uses the indirect measurement of the width which is extracted from the DØ measurement of the ratio . Since the line-shape fits performed by CDF and DØ for the mass are sensitive to the assumed width, we require that both experimental results use a consistent treatment of the uncertainty associated with the width input. For the purpose of combining the results, we take the 10 MeV uncertainty quoted by DØ to be the correlated error.
Table II shows the correlated systematic uncertainties, taken from [10] and [11] respectively.
C Combination of Results
We use the Best Linear Unbiased Estimate [22] method, which is also used in [11], to construct the covariance matrix between the CDF and DØ measurements. For each source of correlated error, we construct a 2-component vector whose components are the individual uncertainties quoted in Table II, for the source of uncertainty. The contribution to the covariance matrix from each source is given by , where indicates the transpose. The various sources of error are assumed to be uncorrelated with each other, hence we add the individual covariance matrices to obtain . This procedure gives us the off-diagonal term in the total covariance matrix . The diagonal terms are obtained from the square of each measurement’s total error. The square root of the off-diagonal covariance matrix element gives the total correlated error between the CDF and DØ measurements of 19 MeV. The correlation coefficient, defined by , is .
The combined mass for the set of two mass measurements and their covariance matrix is given by
| (11) |
where and run over the two mass measurements being combined. The combined error is given by
| (12) |
and the for the combination is given by
| (13) |
Using this procedure, we obtain the combined result for the Tevatron collider
| (14) |
with and probability of 66%.
We note that the various mass measurements from DØ are internally combined by DØ [11] using the same technique that we describe above. CDF combines its internal measurements [10] using a slightly different formulation, where the measurements are combined using only the uncorrelated errors, and then the correlated errors are added in quadrature. When the correlated errors are small with positive correlation coefficients, as we have here, the two formulations give very similar results.
The result of Eqn. 14 is not very different from a simple average ignoring all correlations ( GeV). This is due to the uncertainties being dominated by the uncorrelated components. As mentioned before, the uncorrelated sources of uncertainty will reduce with higher statistics. Therefore correlated theoretical errors such as QED radiative corrections may dominate in the future, in which case the error analysis we have presented here becomes more important.
The combination of the Tevatron collider average with the UA2 measurement [23] of
| (15) |
with a common uncertainty of 19 MeV yields
| (16) |
Here we have taken the correlated component of the uncertainty between CDF and DØ as being fully correlated with the UA2 result, since all three hadron collider measurements are sensitive to the PDFs, QED radiative corrections and width in much the same way.
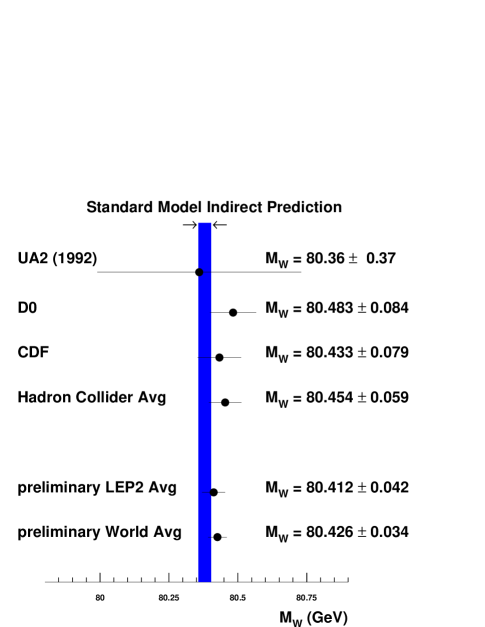
Further combination with the preliminary LEP average [24] of
| (17) |
assuming no correlated uncertainty gives
| (18) |
as the preliminary world average (with and 56% probability). Figure 1 shows the boson mass results, compared with the indirect value of GeV. The latter is obtained from a fit to all -pole data and the direct top mass measurements [24], as interpreted in the context of the SM.
IV Boson Width
The direct measurement of the boson width is made by analyzing boson candidate events with transverse mass above the Jacobian peak, which occurs for GeV. The fitting range extends roughly between 100 GeV and 200 GeV, where the resolution effects from the Jacobian peak are small. The boson width analysis shares most of the issues of production and decay modeling and the detector response with the boson mass analysis, and the sources of uncertainty are therefore similar.
As with the boson mass analysis, the model parameters are constrained by analysis of internal data by each experiment separately. Therefore most of the uncertainties (shown in Table III for the 1994-95 data [12, 13] as examples) are uncorrelated. These uncertainties are also uncorrelated between the CDF electron and muon channel results.
| Source | CDF | CDF | DØ |
| statistics | 195 | 125 | 142 |
| Lepton energy scale | 15 | 20 | 42 |
| Lepton or non-linearity | 5 | 60 | - |
| Recoil model | 90 | 60 | 59 |
| 70 | 55 | 12 | |
| Backgrounds | 50 | 30 | 42 |
| Detector modeling, lepton ID | 40 | 30 | 10 |
| Lepton resolution | 20 | 10 | 27 |
| Parton luminosity slope | - | - | 28 |
The correlated sources of uncertainty are
-
Parton distribution functions - the CDF and DØ analyses used different sets of PDFs to evaluate this uncertainty and quote different contributions. The boson acceptance is similar in the direct measurements of the boson width since both experiments require lepton GeV and .
-
boson mass
-
QED radiative corrections
The Run 1 direct boson width measurements from CDF [12] and DØ [13] are
| (19) | |||||
| (20) |
where the total uncertainty is quoted. The correlated uncertainties for the two measurements are shown in Table IV.
| Source | CDF | DØ |
|---|---|---|
| 15 | 27 | |
| Radiative Corrections | 10 | 10 |
| boson mass | 10 | 15 |
The likelihood fit returns a slightly asymmetric statistical error for the DØ result. We symmetrize it by taking the arithmetic average and combine in quadrature with the total systematic uncertainty to obtain a total uncertainty of 173 MeV for the DØ result. We use the procedure described in Section III C to construct the covariance matrix, and use it to obtain the combined result
| (21) |
with and probability of 40%. The square root of the off-diagonal covariance matrix element gives the total correlated error of 26 MeV and a correlation coefficient of 0.03. As in the case of the mass combination, the uncorrelated errors dominate with the current statistics, and ignoring the correlation would produce a similar result ( GeV). However, in Run 2 at the Tevatron, which is expected to increase the statistics by a factor of , the correlated uncertainties on the theoretical inputs may dominate.
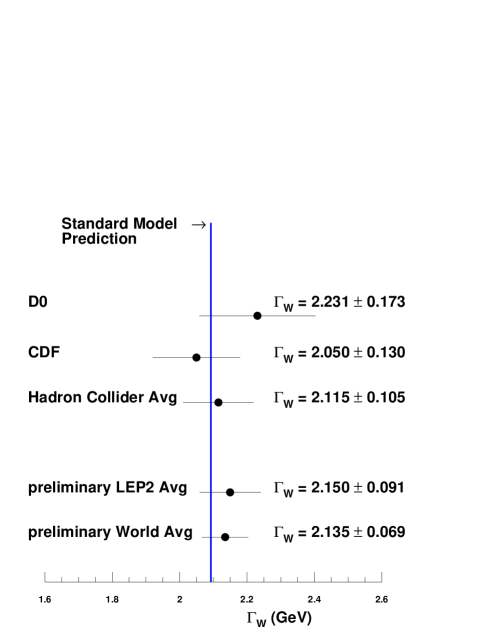
Combination of the Tevatron average with the preliminary LEP average [24] of
| (22) |
assuming no correlated uncertainty gives
| (23) |
as the preliminary world average (with ). Figure 2 shows the boson width results, compared with the SM prediction of GeV [25].
V Joint Analysis of Boson Mass and Width
In this section we describe the analysis for the joint direct measurement of the boson mass and the width. We do not allow external constraints on the mass and width parameters: instead we propagate the uncertainties on the direct observables to the uncertainties on the extracted Breit-Wigner parameters. This procedure will give us the values and uncertainties on and extracted from “Tevatron data only”, as well as their covariance.
We introduce the following terminology to distinguish between the observables called and (which are returned by the fits to the data spectra) and the Breit-Wigner parameters of the same names (which we want to extract). We define the vector of observables and the vector of Breit-Wigner parameters . We approximate the functional dependence by a linear dependence, so that and are related by a linear transformation. For the error analysis, we are interested in transforming the variations in to variations in . This transformation is given by the matrix of derivatives , such that
| (24) |
The matrix of derivatives is defined as
| (25) |
The values of the matrix elements of have been published by the CDF and DØ collaborations, using their Monte Carlo simulation programs [11, 12, 13]. These simulation programs generate bosons according to the calculated mass, rapidity and distributions, generate the decay products according to calculated angular distributions, and subject them to parameterized detector response functions. The simulated decay leptons are used to predict the distributions of the observables in the data.
The simulation and fitting programs demonstrate that the diagonal elements of are unity. The off-diagonal element is given by †††We use the value of the derivative quoted by D0, since CDF does not quote it. We assume that the same derivative would apply for both experiments since the boson kinematics and experimental resolutions are similar. the 10 MeV variation in observed due to a 60 MeV variation in [11]. The off-diagonal element is given by the mean variation of 13 MeV ‡‡‡The uncertainty in due to is quoted as 10 MeV and 15 MeV by CDF and DØ respectively, which are consistent with being equal given that both experiments round the quoted systematics to the nearest 5 MeV due to Monte Carlo statistics. The kinematics and acceptance for both experiments are very similar, hence we expect the true sensitivity to be the same, for which our best estimate is their average of 13 MeV. in observed for a 39 MeV variation in [12, 13]. Thus is reported by CDF and DØ to be
| (28) |
We invert Eqn. 24 to obtain and take the expectation value of the product of each vector and its transpose
| (29) |
where denotes the transpose and denotes the expectation value. The left-hand-side of Eqn. 29 contains the covariance matrix of the observables , and we identify the right-hand-side with the covariance matrix of the extracted Breit-Wigner parameters.
The diagonal elements of are given by the variances of the individual Tevatron averages of the direct boson mass and width (see Eqns. 14 and 21), excluding the error contribution to due to and vice-versa. In order to evaluate the off-diagonal matrix element, we analyze the various contributions to the respective variances. The observables are obtained from fits to disjoint data samples§§§The mass fits are performed with the data satisfying GeV or lepton GeV, while the fits for the width are performed with data satisfying GeV. , so that their statistical uncertainties are uncorrelated. However, the observed values of and depend on the same detector parameters (such as energy scales and resolutions) and the same theoretical parameters (such as parton distribution functions and QED radiative corrections). Hence the uncertainties in these “nuisance” parameters propagate into correlated uncertainties between the observables.
To compute the off-diagonal term, we evaluate the uncertainty contribution to the observed and due to each of these nuisance parameters. The following procedure is followed: (i) remove the respective contribution from the CDF and DØ results separately, by setting each to zero, (ii) recompute the total error on the CDF+DØ average, and (iii) take the difference in quadrature between the original total error and the reduced total error. Table V shows the uncertainty contributions from each source to the CDF+DØ averages.
In the above procedure, we have followed the same assumption that is made by CDF and DØ in their publications - that the sources of uncertainty listed in Table V are mutually independent. This is a valid assumption given the statistics of these data. The lepton energy scale and resolution are derived from the observed peak position and width of the boson mass distribution, which are essentially decoupled. The uncertainty is dominated by the statistical error of the measurement, although this may change in the future. The recoil model is tuned using transverse momentum balance in events, where the lepton resolution is a small effect compared to the recoil resolution.
| Source | ||
| Lepton scale | 37 | 17 |
| Lepton resolution | 12 | 11 |
| 9 | 24 | |
| Recoil model | 20 | 35 |
| Detector modeling, selection bias | 6 | 13 |
| QED radiative correction | 11 | 10 |
We use the information from Table V to evaluate the covariance term
| (30) |
where the sum is performed over the various sources in Table V, and and are the respective error contributions to and from source . In this sum, the relative sign of each pair of factors and determines the sign of the covariance contribution. The mass and width analyses were performed by each experiment in a closely related manner, using the same simulation programs for both analyses. The uncertainty contributions due to the nuisance parameters are completely correlated between the observed and . Therefore and have the same sign in all cases. To illustrate, in the cases of the lepton energy scale, lepton energy resolution, and recoil modeling, an increase in the respective parameter increases the observed values of both and . Similarly, in the cases of detector modeling, selection bias and QED radiative correction, the bias in the shape of the or lepton spectrum affects both observables in the same direction.
| Source | ||
|---|---|---|
| Backgrounds | 6 | 21 |
| PDF, parton luminosity | 12 | 22 |
Table VI shows the systematic error contributions due to PDFs and backgrounds. We do not expect a strong correlation between the error contributions to the observed mass and width from these sources, because the observables are derived from different ranges in . Thus, in the case of the PDFs, a different range is relevant in each case. Furthermore, in the case of the mass, the uncertainty in the PDFs propagates mainly through acceptance effects, while in the case of the width, the main effect is through the relative normalization of the high and low regions. In the case of backgrounds, QCD jet misidentification produces the dominant background whose shape is determined independently in the different regions. The sensitivity to the background shape and normalization is different in the fits for the mass and the width, since the shapes of the signal distributions are very different in the respective fitting windows. On the basis of these arguments, we take the contributions in Table VI to be uncorrelated. They are not used directly in this joint error analysis; we present them here for completeness and future reference.
Evaluating Eqn. 30, we find MeV2, and the covariance matrix for and is
| (31) | |||
| (34) |
where the removal of the 10 (13) MeV systematic on the individual measurement of () due to () variation is shown explicitly. Substituting this result and into Eqn. 29 gives the covariance matrix for the extracted Breit-Wigner parameters and :
| (37) |
The negative sign of the covariance between and can be understood as follows: a higher value of the Breit-Wigner pole mass increases the predicted number of events at high , causing the inferred to reduce (given the number of observed events at high ). Similarly, a higher value of the Breit-Wigner width increases the expected number of events on the high side of the Jacobian edge, causing the inferred to reduce (given the observed position of the Jacobian edge).
We now describe the calculation of the and central values in the joint analysis. We shift the observed value of each variable by the corresponding difference of the other variable from its assumed value, scaled by the appropriate partial derivative:
| (38) | |||||
| (39) |
and denote the assumed values of the mass and width used in the width and mass analyses respectively. and are the values extracted in these individual analyses, and and denote the partial derivatives and . Solving these simultaneous linear equations for and , we obtain the central values in the joint analysis.
CDF and DØ used different assumed values of the mass and width in their respective analyses. For our simultaneous analysis, we need the individual Tevatron averages of and for which the inputs are quoted using the same reference values of and respectively. Thus we cannot use the results of Eqn. 21 and Eqn. 14 for and directly. To arrive at the appropriate averages, we use the partial derivatives mentioned above to “shift” the CDF and DØ measurements to common reference values of GeV and GeV.
This reference point is calculated as follows. In the width analysis, DØ assumed a mass value of 80.436 GeV while CDF assumed a value of 80.400 GeV. We use the weights derived for combining the CDF and DØ width measurements (Sec. IV) to obtain the average GeV. Similarly, in the mass analysis, DØ assumed a width value of 2.062 GeV and CDF assumed a value of 2.096 GeV. Using the weights derived for combining the mass measurements (Sec. III), we obtain the average GeV.
For these coordinates of the reference point, the CDF and DØ mass measurements shift by about 3 MeV each, and the width measurements shift by about 4 MeV and 8 MeV respectively for CDF and DØ. The combination of these shifted values is then repeated according to the procedure described in Sec. III and IV. We obtain the new individual Tevatron averages of GeV and GeV. These values are identical to those quoted in Eqn. 21 and Eqn. 14, proving that our calculated reference point is consistent with the original choices made by CDF and DØ.
We can now solve the simultaneous linear equations given in Eqns. 39, to obtain
| (40) | |||||
| (41) |
as the Tevatron results of the joint analysis. The correlation coefficient is .
Finally, it is of interest for future, higher precision measurements of and to pursue this joint analysis technique. We expect most error contributions to scale with the statistics of the data. Assumptions that are made in providing external input for in the analysis are not necessary in this joint analysis technique. We also note that there is almost no loss of precision compared to the individual measurements. While this may seem surprising, the reason is the positive covariance induced between and by the uncertainties in the nuisance parameters. This means that an error in any of the nuisance parameters moves and in the same direction. But since an increase in one causes the other to reduce as mentioned above, this overall negative feedback suppresses the systematic uncertainties from the nuisance parameters on both and . This reduction in other systematic errors compensates for the information lost in excluding external mass and width input.
VI Indirect Boson Width and Leptonic Width
The CDF and DØ measurements of (see Eqn. 8) have been presented [14, 15, 16] elsewhere. We describe here the combination of the measurements and the extraction of from assuming the validity of the SM. We also combine this extracted value of with the directly measured from the spectrum shape.
A Combination of Measurements
The published CDF [14] and DØ [15, 16] measurements of in the electron channel are
| (42) | |||||
| (43) | |||||
| (44) |
where Run 1a refers to the 1992-93 data and Run 1b refers to the 1994-95 data. The uncertainties are summarized in Table VII.
| Source | CDF | DØ | CDF & DØ | ||
|---|---|---|---|---|---|
| 1b | common | 1a | Correlated | ||
| 1.1 | 0.3 | 0.3 | |||
| 0.1 | 0.1 | 0.7 | 0.1 | ||
| Boson | 0.2 | 0.1 | 0.4 | ||
| Energy Scale | 0.4 | 0.7 | 0.3 | ||
| Recoil Response | 0.6 | 0.2 | 0.6 | ||
| Clustering Algorithm | - | 0.2 | |||
| Generator | - | 0.3 | |||
| Electroweak Corrections | 1.0 | 1.0 | 1.0 | ||
| Backgrounds | 1.5 | 1.7 | 0.1 | 2.3 | |
| Efficiencies | 1.5 | 0.6 | 1.9 | ||
| NLO QCD | 0.6 | - | - | ||
| Drell-Yan | 0.2 | - | - | ||
| Total Systematic | 2.8 | 2.2 | 1.1 | 3.3 | 1.0 |
| Statistical | 2.9 | 1.4 | - | 3.8 | - |
| Total | 4.0 | 2.7 | 1.1 | 5.1 | 1.0 |
We combine the DØ results from Run 1a and Run 1b taking the systematics due to choice of PDF (0.3%), the uncertainty in (0.1%), the uncertainty in the boson spectrum (0.1%), clustering algorithm dependence (0.2%), physics generator issues (0.3%), electroweak radiative corrections (1.0%) [21] and Drell-Yan background (0.1%), as correlated error components, to obtain a total correlated uncertainty of 1.1%. The result for the combined DØ measurement is
| (45) | |||||
| (46) |
This DØ result is then combined with the CDF measurement. In this combination, the systematics due to the choice of PDF (0.3%), the uncertainty in (0.1%) and higher-order electroweak corrections (1.0%) are treated as correlated uncertainties, to obtain a total correlated uncertainty of 1.0%. The average value is
| (47) | |||||
| (48) |
B Extraction of Boson Width
In the extraction of from , the branching ratio is taken from the PDG [9] to be ()%. The inclusive cross section ratio is calculated at NNLO using Van Neerven et al. [26], with the following inputs: GeV, GeV, GeV, GeV, and sin [27]. The renormalization and factorization scales are set to the boson mass. The calculated value of the ratio of inclusive cross sections is found to be
| (49) |
The dominant uncertainties (quoted in parentheses) in the calculation of the cross section ratio are due to PDFs (0.45%), (0.09%), factorization scale (0.12%), renormalization scale (0.06%) and sin (1.43%). The uncertainties due to , and are negligible. The uncertainty due to any input is estimated by varying the input by and taking half of the difference between the results. The uncertainties due to the renormalization and factorization scales are estimated by varying the scales high and low by a factor of two. The uncertainty due to electroweak corrections is estimated by taking different conventions for sin. For our central value we use sin from LEP, which gives an effective Born approximation and minimizes higher order corrections. The on-shell value of sin, however, is equivalent at tree level, but gives a boson production cross section which is about 1.4% higher. We include this variation as a systematic uncertainty on the calculated .
The value of the branching ratio extracted from the combined CDF and DØ measurement of using Eqn. 8 is
| (50) |
For comparison, the SM value of the branching ratio [9] is
| (51) | |||||
| (52) | |||||
| (53) |
where we have used ¶¶¶ This value of is obtained by evolving (Eqn. 10.50 of [9]) from GeV to GeV using Eqn. 9.4 of [9]..
The SM calculation of the boson leptonic partial width is given by [8]
| (54) | |||||
| (55) |
where GeV-2 is the muon decay constant [9], is the “oblique” correction to the tree level partial width [8], and GeV. Using this value of , the extracted value of is
| (56) |
For comparison, the SM prediction is , using Eqns. 53 and 55.
A comparison of the width extracted from with the directly measured width (Eqns. 21 and 41) provides an interesting test of the SM, since the two methods are quite different. In the former measurement assumptions are made about boson couplings, whereas the latter makes use of kinematics. This test is one of the main goals of the Tevatron electroweak physics program in the future, as the precision of both measurements improves with more data.
If one is willing to make all the SM assumptions mentioned in Sec. II, it is possible to combine the indirect and direct measurements of . The result should be used with care; for instance, it may not be used in global fits where boson couplings are free parameters, or in analyses of data where new physics can affect the boson branching ratios.
Given these caveats, we discuss other aspects of combining the indirect and direct measurements of . We consider the correlation induced by theoretical inputs used in the respective analyses:
-
PDF uncertainties: we conclude that there is no significant correlation because different aspects of PDFs are relevant for each analysis. For the direct measurement of the width the PDFs influence the mass dependence of the Breit-Wigner line shape at high mass. For the extraction of the width from , the PDF’s influence the boson acceptance via their rapidity distributions. The total cross section ratio is affected by the ratio of PDFs.
-
Electroweak corrections, factorization and renormalization scales and sin play no significant role in the direct measurement.
-
We consider the correlation induced by variation in . The uncertainties in and due to variation are of the same magnitude and sign∥∥∥With increasing , reduces due to increased acceptance, and also reduces. and therefore cancel in . The uncertainty in the SM calculation of due to uncertainty in is 0.3%, which is transferred to the extracted as a 7 MeV uncertainty. This is anti-correlated****** With increasing , the calculated increases, whereas the directly measured decreases. with the corresponding uncertainty on the direct measurement (13 MeV).
Taking the anti-correlation induced by variation into account††††††Ignoring the anti-correlation changes the result and uncertainty by less than 1 MeV., we find the Tevatron combined (direct and indirect) result
| (57) |
The of this combination is 0.05 with a probability of 83 %, indicating consistency between the direct and indirect measurements. Further combining with the preliminary LEP direct measurement (Eqn. 22) gives
| (58) |
Our world average differs from the PDG [9] value of because we have considered the correlations between the CDF and DØ measurements, which were ignored in [9].
C Extraction of Leptonic Width
We may use the extracted value of the branching ratio (Eqn. 50) and the directly measured total width (Eqn. 21) to obtain a measurement of the leptonic partial width
| (59) | |||||
| (60) |
The fractional uncertainty in the direct (5.0%) dominates over the fractional uncertainty in (2.4%). This measurement of is in good agreement with the SM calculation given in Sec. VI.
VII Suggestions for Future Publications
There are a few instances where CDF and DØ have treated uncertainties differently in their respective analyses. For future efforts it would be helpful if a consistent treatment were adopted by both collaborations with mutual agreement. We itemize these cases below.
-
The uncertainty due to PDFs has been treated differently in two respects, the acceptance-related uncertainty and the parton luminosity uncertainty.
The acceptance-related effects were studied by varying PDFs, but these variations differed between the CDF and DØ analyses. CDF used their charge asymmetry data to constrain the PDF variation, whereas the variation considered by DØ did not have this constraint because DØ did not have electron charge discrimination capability in Run 1. With the Run 2 detector DØ can also make this measurement. DØ and CDF have also demonstrated that the boson (decay lepton) rapidity distributions measured in () boson events can provide additional PDF constraints, especially when forward lepton coverage is included. The optimal use of all this information would be to impose a combined constraint on PDFs using CDF and DØ data, and then propagate the same PDF uncertainty into their respective analyses.
This approach may also be applied to the parton luminosity uncertainty. Furthermore we suggest that the possibility of correlation between the parton luminosity uncertainty and the acceptance-related PDF uncertainty be studied. We suggest that these components be quoted separately along with their correlation.
-
The treatment of the width input in the mass analysis and vice versa should be standardized. We suggest that both experiments adopt a common reference point based on available information. This also implies using a fixed width (mass) for the mass (width) fitting instead of building in a SM relationship between these parameters. This approach will facilitate the combination of the 1-parameter measurements, the 2-parameter joint analysis, and the comparison to theory.
VIII Conclusion
We have presented the Run 1 results on the boson mass and width from the CDF and DØ experiments, and examined their sources of uncertainty to identify the correlated components. We have used the covariance matrix technique to combine the respective measurements from the two experiments. The probability for each combination is good indicating that the measurements are consistent. We have also reported the values and covariance matrix of the mass and direct width measurements from their joint analysis. Finally, we have combined the measurements of the ratio of and boson cross sections, and extracted the combined value of the leptonic branching ratio and the total width. The measurements of the width using the direct and indirect techniques are consistent, providing a test of the standard model. We have also extracted the leptonic partial width from the measured total width and the leptonic branching ratio. We have documented the methodologies that can provide the basis for future work with data of higher precision.
Acknowledgements
The CDF Collaboration thanks the Fermilab staff and the technical staffs of the participating institutions for their vital contributions. This work was supported by the U.S. Department of Energy and National Science Foundation; the Italian Istituto Nazionale di Fisica Nucleare; the Ministry of Education, Culture, Sports, Science, and Technology of Japan; the Natural Sciences and Engineering Research Council of Canada; the National Science Council of the Republic of China; the Swiss National Science Foundation; the A.P. Sloan Foundation; the Bundesministerium fuer Bildung und Forschung, Germany; and the Korea Science and Engineering Foundation (KOSEF); the Korea Research Foundation; and the Comision Interministerial de Ciencia y Tecnologia, Spain.
The DØ Collaboration thanks the staffs at Fermilab and collaborating institutions, and acknowledge support from the Department of Energy and National Science Foundation (USA), Commissariat à l’Energie Atomique and CNRS/Institut National de Physique Nucléaire et de Physique des Particules (France), Ministry of Education and Science, Agency for Atomic Energy and RF President Grants Program (Russia), CAPES, CNPq, FAPERJ, FAPESP and FUNDUNESP (Brazil), Departments of Atomic Energy and Science and Technology (India), Colciencias (Colombia), CONACyT (Mexico), Ministry of Education and KOSEF (Korea), CONICET and UBACyT (Argentina), The Foundation for Fundamental Research on Matter (The Netherlands), PPARC (United Kingdom), Ministry of Education (Czech Republic), A.P. Sloan Foundation, and the Research Corporation.
REFERENCES
- [1] Visitor from University of Zurich, Zurich, Switzerland.
- [2] Visitor from Institute of Nuclear Physics, Krakow, Poland.
- [3] S.L. Glashow, Nucl. Phys. 22, 579 (1961); S. Weinberg, Phys. Rev. Lett. 19, 1264 (1967); A. Salam, Proceedings of the 8th Nobel Symposium, ed. N. Svartholm (Almqvist and Wiksells, Stockholm 1968), p. 367.
- [4] A. Sirlin, Phys. Rev. D 22, 971 (1980); W. Marciano and A. Sirlin, Phys. Rev. D 22, 2695 (1980) and erratum-ibid. D 31, 213 (1985).
- [5] F. Abe et al. (CDF Collaboration), Phys. Rev. Lett. 82, 271 (1999), erratum-ibid. 82, 2808 (1999) and references therein.
- [6] B. Abbott et al. (DØ Collaboration), Phys. Rev. Lett. 80, 2063 (1998); B. Abbott et al. (DØ Collaboration), Phys. Rev. D 60, 052001 (1999) and references therein.
- [7] P. Chankowski et al., Nucl. Phys. B417, 101 (1994); D. Garcia and J. Sola, Mod. Phys. Lett. A 9, 211 (1994); A. Dabelstein, W. Hollik and W. Mosle, in Perspectives for Electroweak Interactions in Collisions, ed. by B. A. Kniehl (World Scientific, Singapore, 1995) p. 345; D. Pierce et al., Nucl. Phys. B491, 3 (1997).
- [8] J. L. Rosner, M. P. Worah and T. Takeuchi, Phys. Rev. D 49, 1363 (1994).
- [9] K. Hagiwara et al., Phys. Rev. D 66, 010001 (2002).
- [10] T. Affolder et al. (CDF Collaboration), Phys. Rev. D 64, 052001 (2001).
- [11] V. M. Abazov et al. (DØ Collaboration), Phys. Rev. D 66, 012001 (2002); B. Abbott et al. (DØ Collaboration), Phys. Rev. D 62, 092006 (2000).
- [12] T. Affolder et al. (CDF Collaboration), Phys. Rev. Lett. 85, 3347 (2000).
- [13] V. M. Abazov et al. (DØ Collaboration), Phys. Rev. D 66, 032008 (2002).
-
[14]
F. Abe et al. (CDF Collaboration), Phys. Rev. D 52, 2624 (1995); Phys. Rev. Lett. 76, 3070 (1996).
A 1% systematic uncertainty has been added to the published CDF result for to account for unknown higher order electroweak corrections - [15] B. Abbott et al. (DØ Collaboration), Phys. Rev. D 60, 052003 (1999).
- [16] B. Abbott et al. (DØ Collaboration), Phys. Rev. D 61, 072001 (2000).
- [17] R. K. Ellis, D. A. Ross and S. Veseli, Nucl. Phys. B 503, 309 (1997).
- [18] G. A. Ladinsky and C.-P. Yuan, Phys. Rev. D 50, 4239 (1994) and references therein.
- [19] F. A. Berends and R. Kleiss, J. P. Reval, and J. P. Vialle, Z. Phys. C 27, 155 (1985); F. A. Berends and R. Kleiss, ibid. 27, 365 (1985).
- [20] E. Barberio and Z. Was, Comput. Phys. Commun. 79, 291 (1994); E. Barberio, B. van Eijk, and Z. Was, ibid. 66, 115 (1991).
- [21] U. Baur, S. Keller, and D. Wackeroth, Phys. Rev. D 59, 013002 (1999); U. Baur et al., ibid. 56, 140 (1997); U. Baur, S. Keller, and W. K. Sakumoto, ibid. 57, 199 (1998).
- [22] L. Lyons, D. Gibaut, P. Clifford, Nucl. Instr. Meth. A 270, 110 (1988).
- [23] J. Alitti et al. (UA2 Collaboration), Phys. Lett. B 276, 354 (1992).
- [24] The LEP and SLD Collaborations, hep-ex/0312023, and references therein.
- [25] D. E. Groom et al., The European Physical Journal C 15, 1038 (2000).
- [26] W. L. Van Neerven and E. B. Zijlstra, Nucl. Phys. B 382, 11 (1992).
- [27] C. Caso et al., The European Physical Journal C 3, 1 (1998).