Transverse Momentum Fluctuations
in Nuclear Collisions at 158 GeV
The NA49 Collaboration
Abstract
Results are presented on event-by-event fluctuations in transverse momentum of charged particles, produced at forward rapidities in p+p, C+C, Si+Si and Pb+Pb collisions at 158 GeV. Three different characteristics are discussed: the average transverse momentum of the event, the fluctuation measure and two-particle transverse momentum correlations. In the kinematic region explored, the dynamical fluctuations are found to be small. However, a significant system size dependence of is observed, with the largest value measured in peripheral Pb+Pb interactions. The data are compared with predictions of several models.
The NA49 Collaboration
T. Anticic21, B. Baatar9,D. Barna4, J. Bartke7, M. Behler14, L. Betev10, H. Białkowska19, A. Billmeier10, C. Blume8, B. Boimska19, M. Botje1, J. Bracinik3, R. Bramm10, R. Brun11, P. Bunčić10,11, V. Cerny3, P. Christakoglou2, O. Chvala16, J.G. Cramer17, P. Csató4, N. Darmenov18, A. Dimitrov18, P. Dinkelaker10, V. Eckardt15, P. Filip15, D. Flierl10,Z. Fodor4, P. Foka8, P. Freund15, V. Friese8, J. Gál4, M. Gaździcki10, G. Georgopoulos2, E. Gładysz7, S. Hegyi4, C. Höhne14, K. Kadija21, A. Karev15, V.I. Kolesnikov9, T. Kollegger10, R. Korus13, M. Kowalski7, I. Kraus8, M. Kreps3, M. van Leeuwen1, P. Lévai4, L. Litov18, M. Makariev18, A.I. Malakhov9, C. Markert8, M. Mateev18, B.W. Mayes12, G.L. Melkumov9, C. Meurer10, A. Mischke8, M. Mitrovski10, J. Molnár4, St. Mrówczyński13, G. Pálla4, A.D. Panagiotou2, D. Panayotov18, K. Perl20, A. Petridis2, M. Pikna3, L. Pinsky12, F. Pühlhofer14, J.G. Reid17, R. Renfordt10, W. Retyk20, C. Roland6, G. Roland6, M. Rybczyński13, A. Rybicki7,11, A. Sandoval8, H. Sann8, N. Schmitz15, P. Seyboth15, F. Siklér4, B. Sitar3, E. Skrzypczak20, G. Stefanek13, R. Stock10, H. Ströbele10, T. Susa21, I. Szentpétery4, J. Sziklai4, T.A. Trainor17, D. Varga4, M. Vassiliou2, G.I. Veres4, G. Vesztergombi4, D. Vranić8, A. Wetzler10, Z. Włodarczyk13 I.K. Yoo5, J. Zaranek10, J. Zimányi4
1NIKHEF, Amsterdam, Netherlands.
2Department of Physics, University of Athens, Athens, Greece.
3Comenius University, Bratislava, Slovakia.
4KFKI Research Institute for Particle and Nuclear Physics, Budapest, Hungary.
5Department of Physics, Pusan National University, Busan, Republic of Korea.
6MIT, Cambridge, USA.
7Institute of Nuclear Physics, Cracow, Poland.
8Gesellschaft für Schwerionenforschung (GSI), Darmstadt, Germany.
9Joint Institute for Nuclear Research, Dubna, Russia.
10Fachbereich Physik der Universität, Frankfurt, Germany.
11CERN, Geneva, Switzerland.
12University of Houston, Houston, TX, USA.
13Institute of Physics Świ etokrzyska Academy, Kielce, Poland.
14Fachbereich Physik der Universität, Marburg, Germany.
15Max-Planck-Institut für Physik, Munich, Germany.
16Institute of Particle and Nuclear Physics, Charles University, Prague, Czech
Republic.
17Nuclear Physics Laboratory, University of Washington, Seattle, WA, USA.
18Atomic Physics Department, Sofia University St. Kliment Ohridski, Sofia,
Bulgaria.
19Institute for Nuclear Studies, Warsaw, Poland.
20Institute for Experimental Physics, University of Warsaw, Warsaw, Poland.
21Rudjer Boskovic Institute, Zagreb, Croatia.
1 Introduction
Nucleus-nucleus (A+A) collisions at relativistic energies have been intensely studied over the last two decades. The main goal of these efforts is to understand the properties of strongly interacting matter under extreme conditions of high energy and baryon densities when the creation of the quark-gluon plasma (QGP) is expected [1]. Experimental results obtained in a broad range of collision energies indicate that an extended zone of strongly interacting dense matter indeed occurs in the collision process. Various collision characteristics and their collision energy dependence suggest [2, 3] that a transient state of deconfined matter may be created at collision energies as low as 40 GeV.
QGP formation is expected to occur at the early collision stage when the system is sufficiently hot and dense. In the course of further evolution, the system dilutes and cools down, hadronizes and finally decays into free hadrons. Therefore the final state hadrons carry only indirect information about the early stage of the collision. Thus firm conclusions about the creation of deconfined matter require studying a variety of collision characteristics.
As fluctuations are sensitive to the dynamics of the system, in particular at the phase transition, the analysis of event-by-event fluctuations has been proposed as an important tool in the study of A+A collisions [4]. Large acceptance detectors, which allow the observation of a significant fraction of the final state particles, have made this suggestion truly attractive [5]. First pioneering studies were carried out by the NA49 collaboration on the fluctuations of the average transverse momentum [6] and the ratio [7] in central Pb+Pb collisions at the CERN SPS.
There are a number of collision characteristics which can be inferred from experimental data on event-by-event fluctuations. First of all, the fluctuation analysis can help to resolve the long standing problem whether, or rather to what extent, the strongly interacting matter, emerging from the early collision stage, achieves both thermal [8, 9, 10] and chemical [11, 12] equilibrium. In the NA49 investigation of event-wise fluctuations in the ratio [7] in central Pb+Pb collisions at 158 GeV, no significant deviations from the hadro-chemical equilibrium ratio were found. If the equilibrium is indeed reached, the system’s heat capacity [13, 14] and its compressibility [15] can, in principle, be deduced from the temperature and multiplicity fluctuations respectively. While large multiplicity fluctuations can be treated as a signal of particle production via clusters [16] or super-cooled droplets of deconfined matter [17], small final state fluctuations of the conserved charges, electric or baryonic, can occur when fluctuations generated in the plasma phase are frozen due to the rapid expansion of the system [18, 19]. On the other hand, significant transverse momentum and multiplicity fluctuations can result if the system hadronizes from a QGP near the predicted second order critical QCD end point [14, 20]. The latter has been shown by recent lattice QCD studies to occur at a substantial baryochemical potential [21], characteristic of the CERN SPS energy range.
This paper extends the previous study [6] of the NA49 experiment of event-by-event transverse momentum fluctuations. The main objective is to observe how the fluctuation pattern changes with increasing number of nucleons participating in a collision, i.e. with the system size. For this purpose, not only Pb+Pb collisions at various centralities are studied, but also p+p, C+C and Si+Si interactions at a beam energy of 158 GeV per nucleon. In particular, it will be checked, whether the correlations present in the final state of p+p interactions survive in the collisions of heavier systems, as expected if the nucleus+nucleus (A+A) collision is a simple superposition of nucleon+nucleon (N+N) interactions. Moreover a test will be performed of the reasonable expectation that the fluctuations become more similar to those of an equilibrated system when the number of participating nucleons increases.
Measuring event-by-event fluctuations in A+A collisions one should consider the influence of two trivial sources of fluctuations. The first one is caused by event-by-event fluctuations of the collision geometry and the second one by the finite number of particles (statistical fluctuations). The dynamical fluctuations of interest have to be extracted from the noise caused by these trivial sources.
In such a situation, a suitable choice of statistical tools for the study of event-by-event fluctuations is really important. In this work, mainly the fluctuation measure introduced in [8] will be employed. However, other fluctuation measures have also been proposed and studied, e.g. [22], [23] and [24], which can all be related. equals exactly zero when inter-particle correlations are absent. It also eliminates ‘geometrical’ fluctuations due to the impact parameter variation. Thus, is ‘deaf’ to the statistical noise and ‘blind’ to the collision centrality. The measure was already used in the previous experimental study [6] of fluctuations. It was also calculated within various models of nuclear collisions [25, 26, 27, 28, 29, 30]. However, in these model considerations, the effects of experimental acceptance, which significantly influence the results, were usually not taken into account. Consequently, most of these results cannot be compared to the data.
For better understanding of the structure of the correlations contributing to , two-particle transverse momentum correlations (as proposed in [23]) are studied as well. A preliminary analysis was presented in [31].
This paper is organized as follows: In Sec. 2 the statistical tools used in this analysis are introduced and briefly discussed. The experimental set-up and procedures are presented in Sec. 3. Experimental effects such as detector acceptance and two-track resolution are discussed in Sec. 4. The results on the system dependence of the fluctuations are presented in Sec. 5. Discussion of the results and their comparison with theoretical models is given in Sec. 6. A summary closes the paper.
2 Measures of fluctuations
There are numerous observables which can be used to measure fluctuations in high energy collisions. A natural one is the distribution of the average transverse momentum of the events defined as
| (1) |
where is the multiplicity of accepted particles in a given event and is the transverse momentum of the -th particle. The distribution of is usually compared to the corresponding distribution obtained for ‘mixed events’ in which the particles are independent from each other and follow the experimental inclusive spectra (the multiplicity distribution for mixed events is the same as for the data). A difference between the two distributions signals the presence of dynamical fluctuations. Since the distribution crucially depends on the particle multiplicity, the method cannot be used to compare systems of significantly different multiplicities.
A more appropriate measure is the quantity [8] which, by its construction, is insensitive to the system size. In this paper the measure is used for the analysis of fluctuations (). Following the authors of [8], one defines the single-particle variable with the bar denoting averaging over the single-particle inclusive distribution. One easily observes that . Further, one introduces the event variable , which is a multi-particle analog of , defined as
| (2) |
where the summation runs over particles in a given event. Note, that , where represents averaging over events. Finally, the measure is defined as
| (3) |
The second part of Eq. (3) is simply the dispersion of the inclusive distribution (further denoted as ). It can be easily shown that , when no inter-particle correlations are present and the single-particle spectrum is independent of multiplicity. As already mentioned, is insensitive to centrality. This property may be expressed as follows: is independent of the distribution of the number of particle sources if the sources are identical and independent from each other [8, 10]. In particular, does not depend on the impact parameter if the A+A collision is a simple superposition of N+N interactions.
In spite of the above mentioned advantages, there is an important disadvantage of using in the fluctuation analysis. While is sensitive to the presence of dynamical correlations in a system, it does not disentangle their nature. Fluctuations of very different character contribute to . In order to achieve a better understanding of the fluctuation structure one needs to apply a more differential method [23].
The correlations can be studied by plotting the cumulative variables of particle pairs. Namely, for a given particle, instead of its one introduces the variable defined as [32]
| (4) |
where is the inclusive distribution, normalized to unity, which is obtained from all particles used in the analysis. By construction, the variable varies between 0 and 1 with a flat probability distribution. The two-particle correlation plots, as presented in this paper, are obtained by plotting points for all possible particle pairs within the same event. The number of pairs in each bin is divided by the mean number of pairs in a bin (averaged over all bins). This two-dimensional plot is uniform when no inter-particle correlations are present in the system. Correlations due to the Bose statistics produce a ridge along the diagonal of the plot, which starts at and ends at , whereas temperature fluctuations lead to a saddle shaped structure [23].
As will be seen in the figures, the distribution of or obtained from the two-dimensional plots by projecting on the or axis is not flat. This is due to the method by which the plots are constructed. Namely, each pair of particles is represented by a point on the plot. Therefore, the events with higher multiplicities are represented by a larger number of pairs than those with smaller multiplicities. Since the shape of the distribution depends on the event multiplicity, the projection of the two-dimensional plot on or is no longer flat. However, it should be stressed that in the absence of any correlations the plot is uniformly populated and the and projections are flat.
3 Experimental Set-up
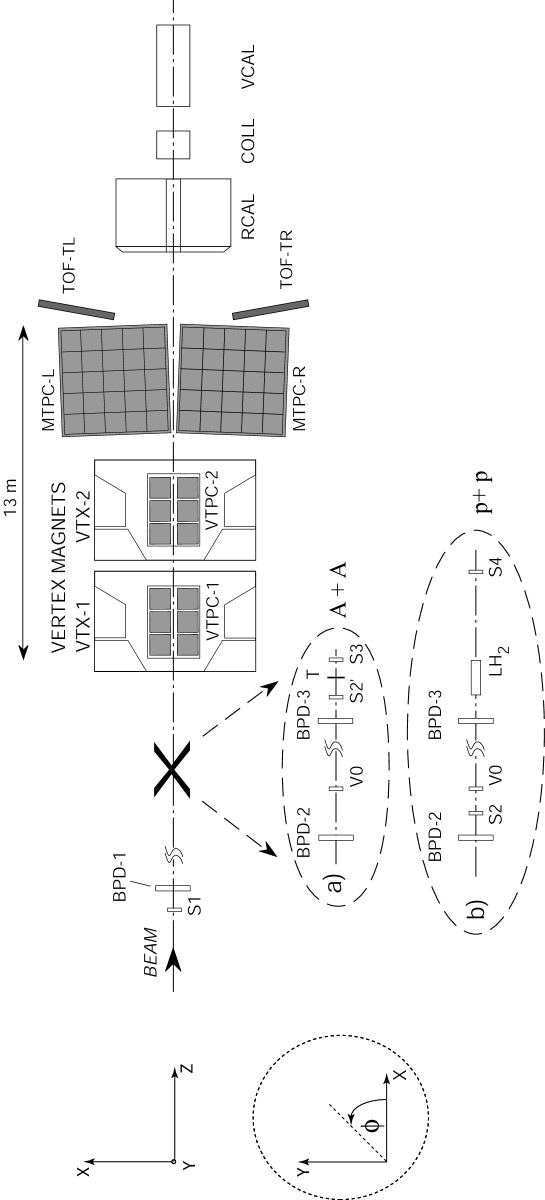
The NA49 experiment is a large acceptance hadron spectrometer at the CERN-SPS used to study the hadronic final states produced by collisions of various beam particles (p, Pb from the SPS and C, Si from the fragmentation of the primary Pb beam) with a variety of fixed targets. The main tracking devices are four large volume Time Projection Chambers (TPCs) (Fig. 1) which are capable of detecting 80% of approximately 1500 charged particles created in a central Pb+Pb collision at 158 GeV. Two of them, the Vertex TPCs (VTPC-1 and VTPC-2), are located in the magnetic field of two super-conducting dipole magnets (1.5 and 1.1 T, respectively) and two others (MTPC-L and MTPC-R) are positioned downstream of the magnets symmetrically to the beam line. The results presented here are analyzed with a global tracking scheme [33], which combines track segments that belong to the same physical particle but were detected in different TPCs. The NA49 TPCs allow precise measurements of particle momenta with a resolution of (GeV/c)-1. The set–up is supplemented by two Time of Flight (TOF) detector arrays and a set of calorimeters.
The targets, C (561 mg/cm2), Si (1170 mg/cm2) and Pb (224 mg/cm2) for ion collisions and a liquid hydrogen cylinder (length 20 cm) for elementary interactions, are positioned about 80 cm upstream from VTPC-1.
Pb beam particles are identified by means of their charge as seen by a Helium Gas-Cherenkov counter (S2’) and p beam particles by a 2 mm scintillator (S2). Both of these are situated in front of the target. The study of C+C and Si+Si reactions is possible through the generation of a secondary fragmentation beam which is produced by a primary target (1 cm carbon) in the extracted Pb-beam. With the proper setting of the beam line magnets a large fraction of all fragments at GeV are transported to the NA49 experiment. On-line selection based on a pulse height measurement in a scintillator beam counter (S2) is used to select particles with (Carbon) and (Al, Si, P). In addition, a measurement of the energy loss in beam position detectors (BPD-1/2/3 in Fig. 1) allows for a further selection in the off-line analysis. These detectors consist of pairs of proportional chambers and are placed along the beam line. They also provide a precise measurement of the transverse positions of the incoming beam particles.
For p, C and Si beams, interactions in the target are selected by an anti-coincidence of the incoming beam particle with a small scintillation counter (S4) placed at the beam axis between the two vertex magnets. For p+p interactions at 158 GeV this counter selects a (trigger) cross section of 28.5 mb out of 31.6 mb of the total inelastic cross section. For Pb beams, an interaction trigger is provided by an anti-coincidence with a Helium Gas-Cherenkov counter (S3) directly behind the target. The S3 counter is used to select minimum bias collisions by requiring a reduction of the Cherenkov signal by a factor of about 6. Since the Cherenkov signal is proportional to , this requirement ensures that the Pb projectile has interacted with a minimal constraint on the type of interaction. This setup limits the triggers on non-target interactions to rare beam-gas collisions, the fraction of which proved to be small after cuts, even in the case of peripheral Pb+Pb collisions.
The centrality of the nuclear collisions is selected by use of information from a downstream calorimeter (VCAL), which measures the energy of the projectile spectator nucleons. The geometrical acceptance of the VCAL calorimeter is adjusted in order to cover the projectile spectator region by the setting of the collimator (COLL).
Details of the NA49 detector set-up and performance of tracking software are described in [34].
4 Data selection and analysis
4.1 Data sets
The data used for the analysis consists of samples of p+p, C+C, Si+Si and Pb+Pb collisions at 158 GeV. For Pb+Pb interactions a minimum bias trigger was used allowing a study of the centrality dependence. The distribution of energy measured in the VCAL for the minimum bias Pb+Pb events was divided into six centrality bins (Table 1) which are numbered from 1 (the most central) to 6 (the most peripheral). For each bin of centrality the range of the impact parameter , and the mean number of wounded nucleons were determined by use of the Glauber model and the VENUS event generator [35]. The fraction of the total inelastic cross section of nucleus+nucleus collisions () corresponding to each data set was calculated directly by use of the distribution of energy measured in the VCAL. In order to estimate the correlation between the energy deposited in the VCAL and the impact parameter minimum bias VENUS events were processed through the GEANT detector simulation code, and the energy deposited in the VCAL was simulated. The correlation between and was obtained from Glauber model calculations using the spectator-participant model of A+A interactions. The values of , and presented in Table 1 are taken from [36] for minimum bias Pb+Pb collisions and from [37] for C+C and Si+Si interactions.
The minimum bias Pb+Pb data consists of data taken during three different periods and at both magnetic field polarities. The most central Pb+Pb events correspond to 5 of the total geometric cross section. Since the minimum bias data provide only a small number of events in the most central Pb+Pb bin, additional central trigger runs were used.
4.2 Event and particle selection
The aim of the event selection criteria is to reduce a possible contamination with non-target collisions. The primary vertex was reconstructed by fitting the intersection point of the measured particle trajectories. Only events with a proper quality and position of the reconstructed vertex are accepted in this analysis. The vertex coordinate along the beam has to satisfy , where the nominal vertex position and cut parameter values are: -579.5 and 5.5 cm, -579.5 and 1.5 cm, -579.5 and 0.8 cm, -578.9 and 0.4 cm for p+p, C+C, Si+Si and Pb+Pb collisions, respectively.
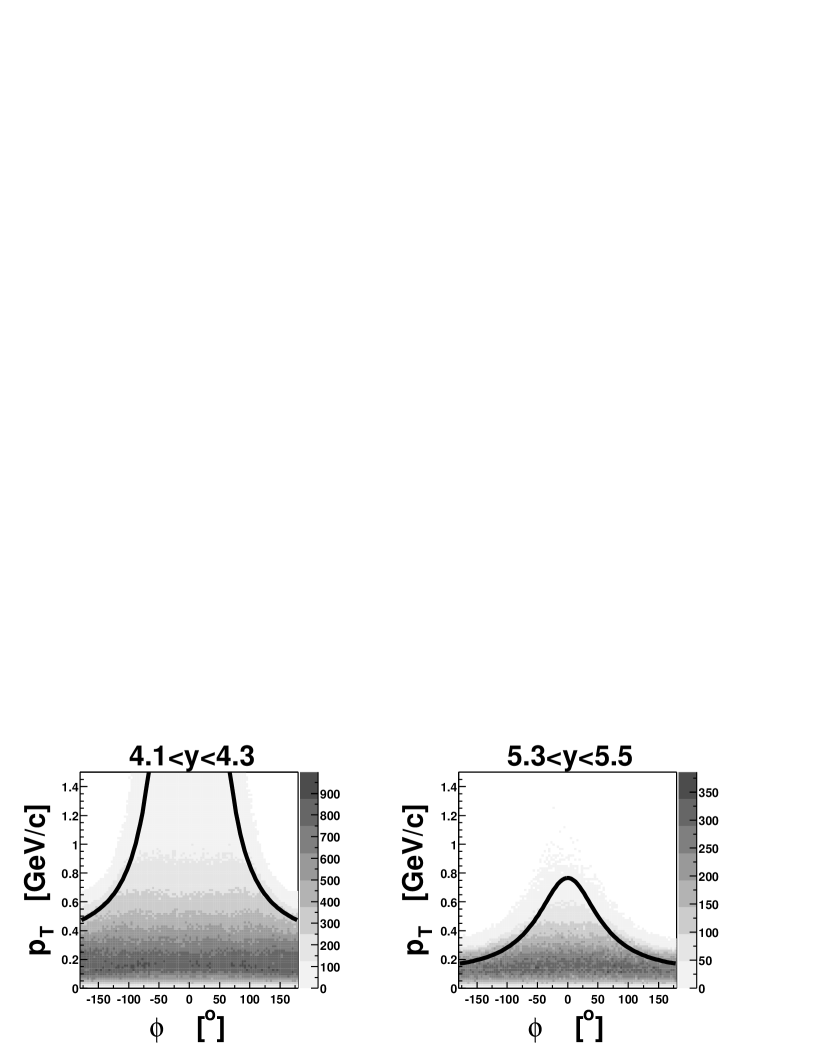
In order to reduce the contamination of particles from secondary interactions, weak decays and other sources of non-vertex tracks, several track cuts are applied. The accepted particles are required to have measured points in at least one of the Vertex TPCs. A cut on the so-called track impact parameter, the distance between the reconstructed main vertex and the track in the target plane, is applied ( cm and cm) to reduce the contribution of non-vertex particles. Moreover, particles are accepted only when the potential number of points (calculated on the basis of the geometry of the track) in the detector exceeded 30. The ratio of the number of points on a track to the potential number of points is required to be higher than 0.5 in order to avoid the counting of track segments instead of whole tracks. Only forward rapidity tracks (4.0 5.5, rapidity calculated assuming the pion mass for all particles) with 0.005 1.5 GeV/c are used in this analysis.
The NA49 detector provides a large (but not complete) acceptance in the forward hemisphere. Two example plots of versus azimuthal angle (see Fig. 1 for definition) for positively charged particles (for the standard polarity of the magnetic field) are shown in Fig 2. The solid lines represent a parametrization of the acceptance limits by the formula:
| (5) |
where the values of parameters , and depend on the rapidity interval as given in Table 2. These values apply to negatively charged particles as well, provided in Eq. 5 is replaced by . Only particles within the analytical curves are used in this analysis. This well defined acceptance is essential for later comparison of the results with models and other experiments.
The NA49 detector is able to register particles produced in a significantly wider rapidity range covering almost the whole forward hemisphere. It would be interesting to determine the correlation measure in the mid-rapidity region. Preliminary results for the rapidity range 2.9 - 4.0 were reported [38]. However, the azimuthal acceptance in this region is more limited and systematic uncertainties affecting are not yet fully understood.
4.3 Corrections and error estimates
The statistical error on was estimated as follows. The whole sample of events was divided into 30 subsamples. The value of was evaluated for each subsample and the dispersion () of the results was then calculated. The statistical error of was taken to be equal to .
The event and track selection criteria reduce the possible systematic bias of the measured values. In order to estimate the remaining systematic uncertainty, the values of cut parameters have been varied within a reasonable range and the systematic error has been estimated as a half of the difference between the highest and the lowest value. In addition, results obtained from the analysis of data taken at two different magnetic field polarities as well as from different running periods have been compared.
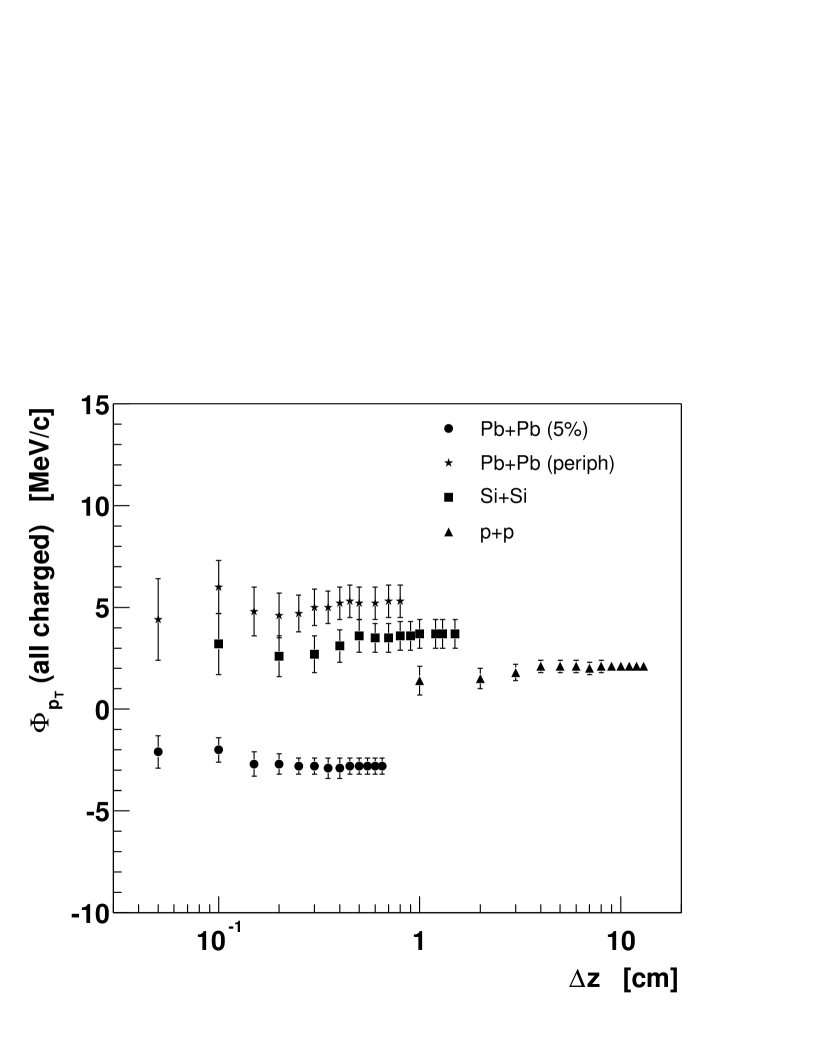
Event cuts are used to reject possible contamination of non-target interactions, however there is always a small fraction of remaining non-target events which can influence the values. The dependence of on the event selection cut is shown in Fig. 3. The observed variation of with is small. The estimated systematic error is smaller than 0.85 MeV/c for peripheral Pb+Pb collisions, 0.55 MeV/c for Si+Si data and 0.5 MeV/c for p+p events.
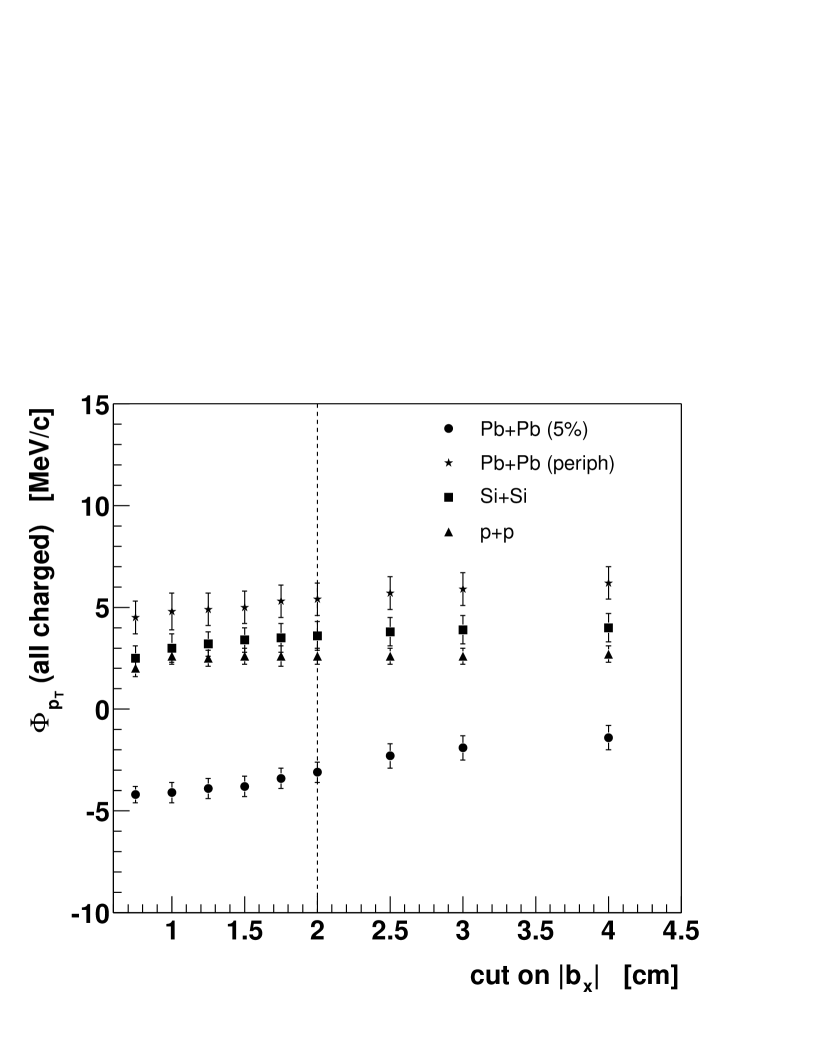
The majority of tracks selected by the track selection criteria are main vertex tracks and the remaining fraction (10%) originates predominantly from weak decays and secondary interactions with the material of the detector. In order to estimate the influence of this contamination on the measured value of , the impact parameter cut was varied (Fig. 4). A small increase of with increasing impact parameter cut is observed and may be due to the increased contribution of non-vertex tracks from weak decays and secondary interactions. By use of the VENUS [35] simulations these tracks were found to be correlated in thus increasing the measured value of . The estimated systematic error due to the contamination of non-vertex tracks is smaller than 1.6 MeV/c for central Pb+Pb collisions, 0.75 MeV/c for Si+Si data and 0.35 MeV/c for p+p events.
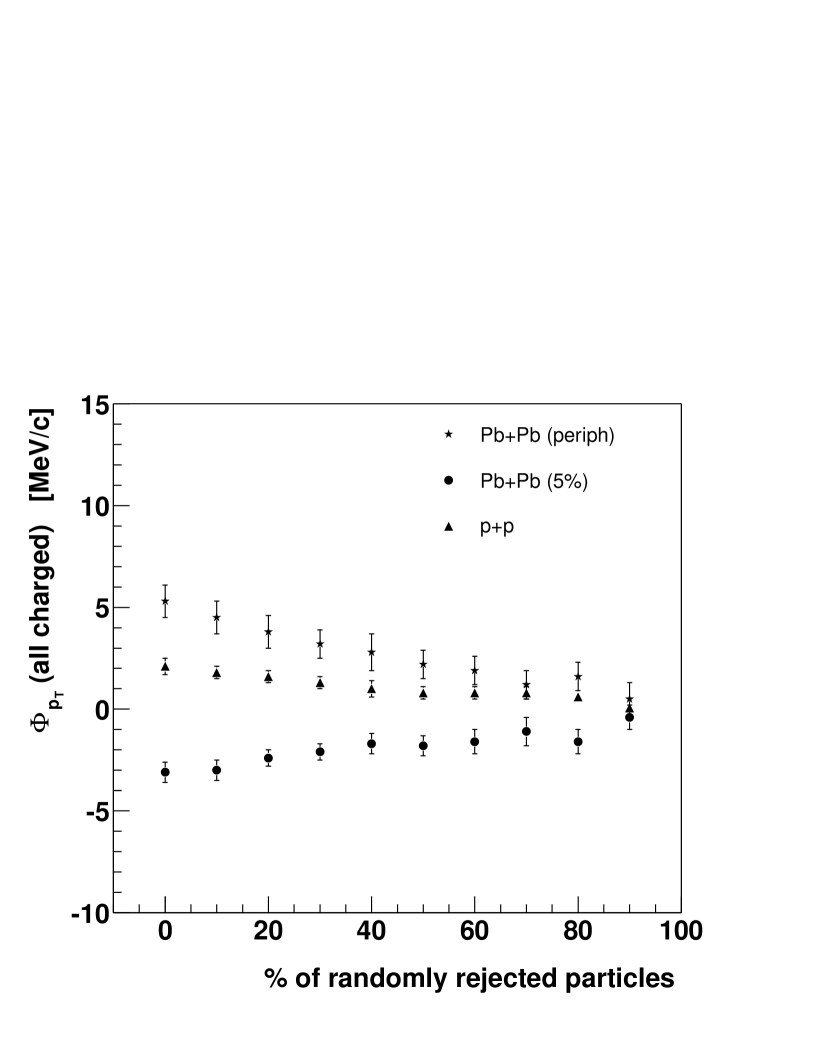
Losses of tracks due to the reconstruction inefficiency and track selection cuts influence the measured values. In order to estimate this effect, the dependence of on the percentage of randomly rejected particles was calculated. These dependences for the most peripheral (6), the most central (1) Pb+Pb collisions and for p+p interactions are shown in Fig. 5. Within the considered kinematic region (forward rapidity) the tracking efficiency of our detector is higher than 95%. Fig. 5 implies that the bias due to tracking inefficiency is not higher than 0.5-1.0 MeV/c.
As an estimate of the systematic error on a maximal error resulting from the above study has been taken. The systematic error is about 1.6 MeV/c for Pb+Pb collisions and 1.2 MeV/c for p+p, C+C and Si+Si interactions.
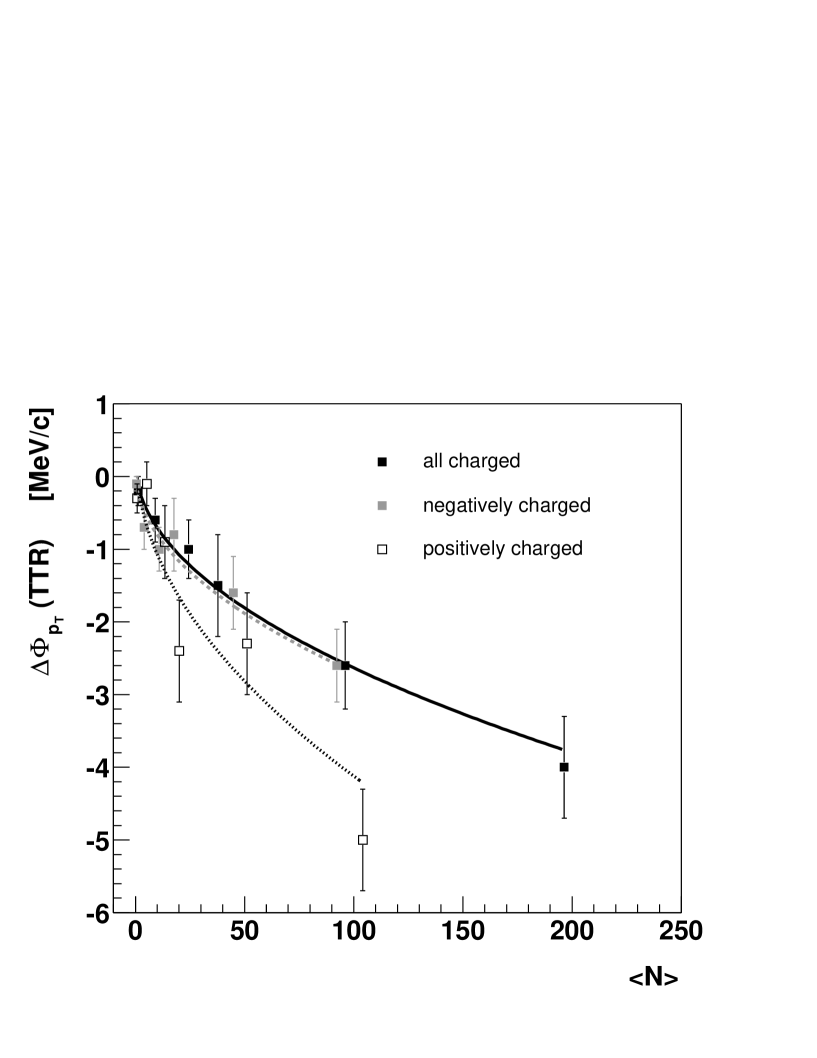
It has already been shown [6] that the limited two track resolution influences the measured values. In order to estimate this contribution several samples of mixed events (for different A+A collisions) were produced. Mixed events were constructed from original events, the multiplicities of mixed events being the same as in the case of real events but each particle in a mixed event taken at random from a different real event. The value calculated for the sample of mixed events was consistent with zero. In the second step the mixed events were processed by the NA49 simulation software. The resulting simulated raw data were reconstructed and the measure calculated. The obtained values are negative as expected for the anti-correlation introduced by the losses due to the limited two track resolution. The additive two track resolution correction is calculated as the difference () between the values of after and before this procedure. Fig. 6 presents this correction versus mean multiplicity. The lines correspond to an analytical parametrization of this dependence. The absolute values of the track resolution corrections are larger for heavier colliding systems where the density of tracks is relatively high. The absolute values of are also larger for positively charged particles than for negatively charged ones, which is mainly due to higher track density for positive particles caused by significantly larger number of protons than anti-protons. The values are negative indicating that measured with an ideal detector would be higher. For a given multiplicity, corrected for the limited two track resolution effect equals ‘raw’ minus the corresponding .
5 Results
The results shown in this section refer to accepted particles, i.e. particles that are accepted by the detector and pass all kinematic cuts and track selection criteria. The data cover a broad range in ( GeV/c). The rapidity of accepted particles is restricted to the interval 4.0 to 5.5 which corresponds to forward rapidities in the collision of equal mass nuclei (at 158 GeV energy the center of mass rapidity equals 2.9 for fixed target geometry), where the azimuthal acceptance is large.
The mean multiplicities of accepted particles, the dispersions of the multiplicity distributions, the mean inclusive transverse momenta, the dispersions of inclusive transverse momentum distributions and values for all data sets used in this analysis are given in Table 3. The values shown in this table have been calculated for all accepted charged particles as well as for the negatively and the positively charged particles separately. All values of were corrected for the two track resolution effect.
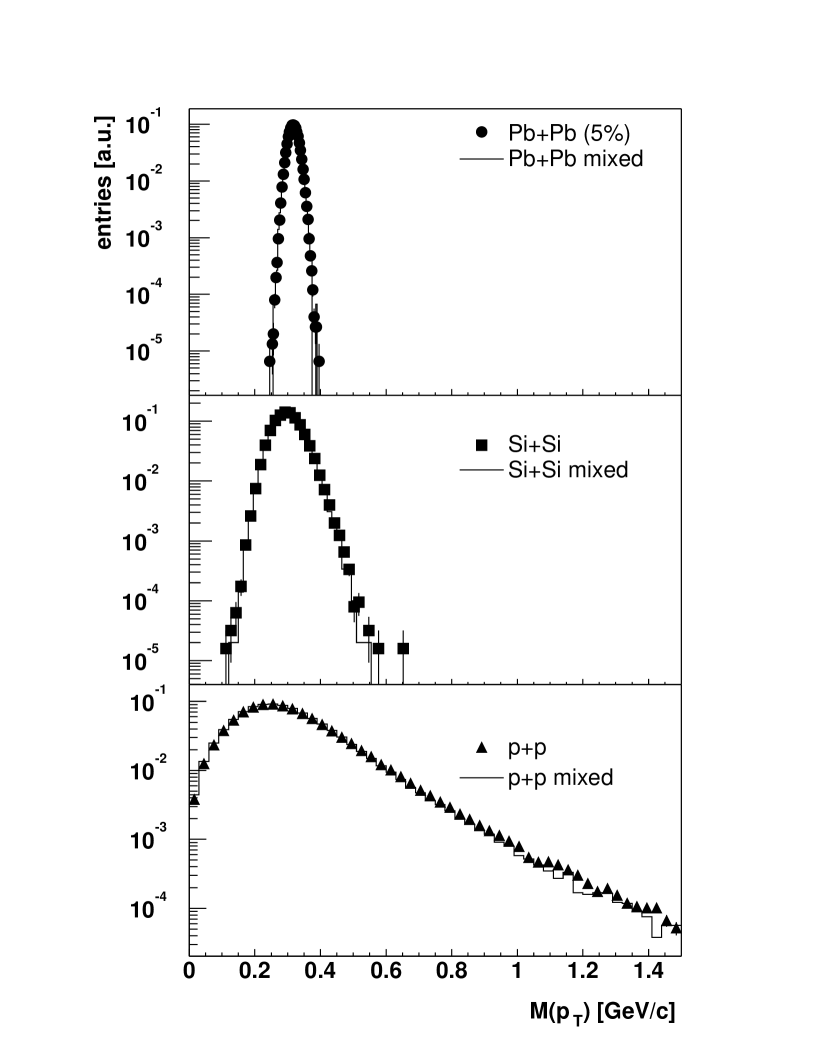
Fig. 7 shows the distributions of the mean (per event) transverse momentum for p+p, Si+Si and central Pb+Pb collisions. Points correspond to data and the histograms to mixed events. The data are not corrected for any experimental effects. Events with zero accepted particle multiplicity are not taken into account. The small difference between distributions for real and mixed events demonstrates that dynamical fluctuations are small. Moreover, no distinct class of events with unusual fluctuations is observed. The width of the distribution strongly decreases with the colliding system size as expected from the increasing particle multiplicity.
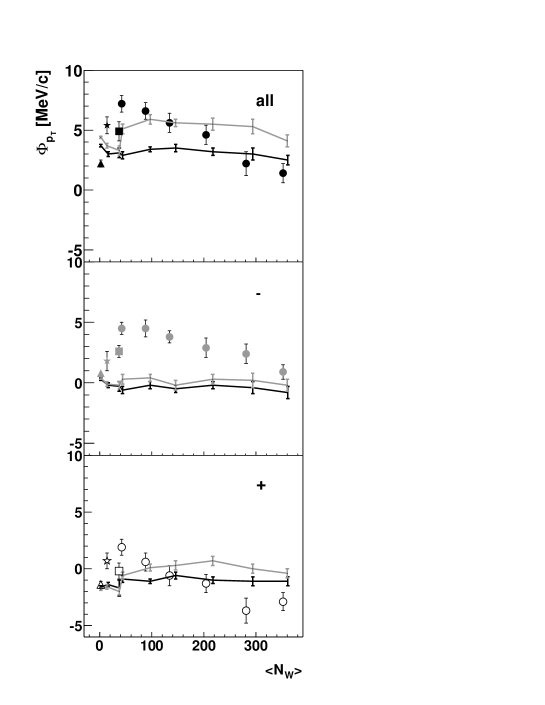
The fluctuation measure is more sensitive to small dynamical fluctuations. The measured values, corrected for two-track resolution, are plotted in Fig. 8 versus mean number of wounded nucleons for all accepted charged particles and also for positively and negatively charged particles separately. The values are small (when compared to ) for all investigated systems ( MeV/c), but a significant centrality dependence is observed. The values increase with the system size up to the maximum value which is observed for the most peripheral Pb+Pb collisions, and then values decrease with increasing number of wounded nucleons. The value for Si+Si collisions seems to be lower than that for the most peripheral Pb+Pb ones although the number of wounded nucleons in both reactions is similar. This might suggest that does not fully determine the fluctuations in A+A collisions. The measure calculated for positively charged particles is always lower than that for the negatively charged ones. The value for all charged particles is always higher than that for either the negatively or the positively charged particles.
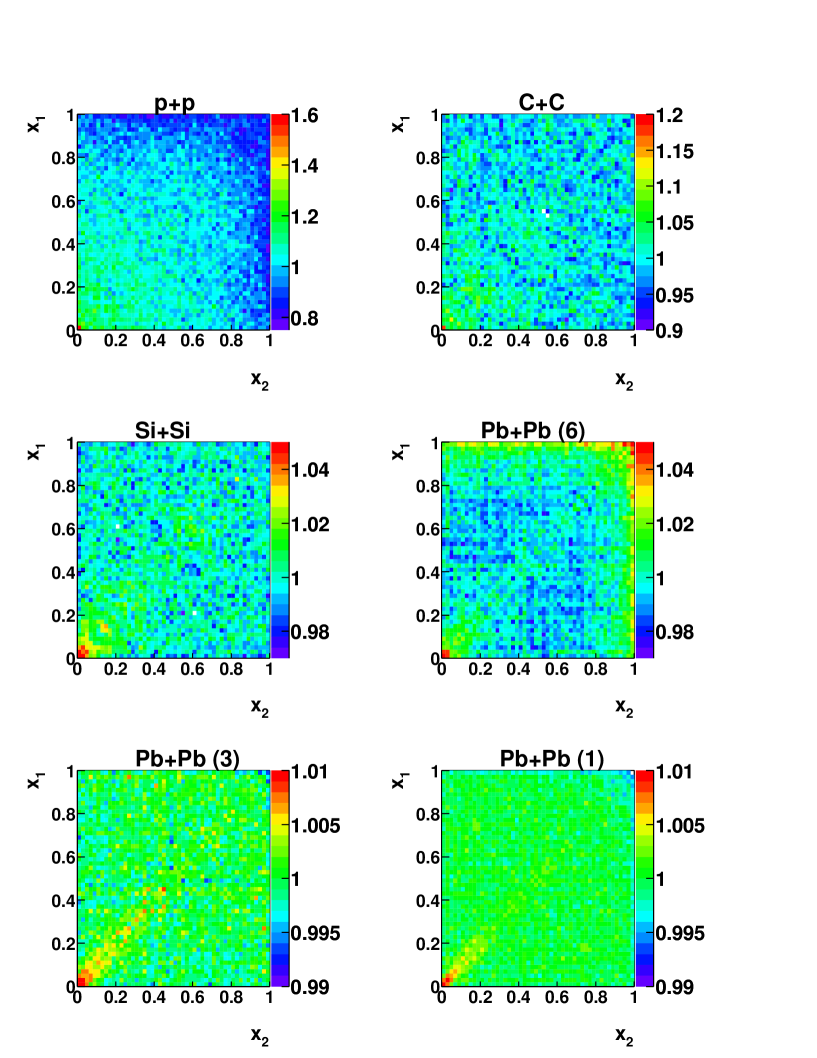
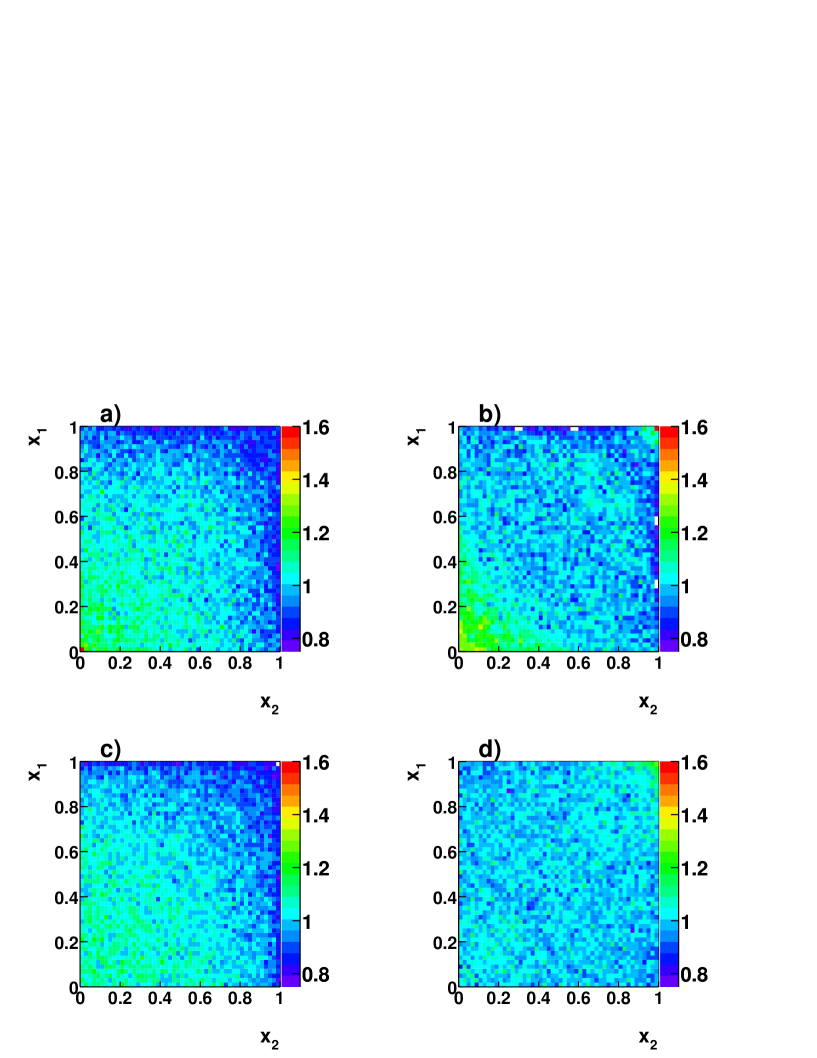
Two-particle correlation plots of the cumulant transverse momentum variable are presented in Fig. 9 for p+p, C+C, Si+Si and three centralities of Pb+Pb interactions (note the different color scales). It is seen that the plots are not uniformly populated. In particular, significant long range correlations of about 40% (the color scale varies from 0.75 to 1.6) are observed for the p+p data. This is rather unexpected when compared to the low value. These correlations are not seen when heavier colliding systems are studied. Instead, short range correlations become visible as an enhancement of the point density in the region close to the diagonal. They are most prominent for central Pb+Pb collisions and are consistent with the effect of Bose-Einstein statistics. For the most peripheral collisions the pattern seen in the two-particle correlation plot is different from that in the remaining systems. One observes an enhancement in the region close to and .
6 Discussion
In this section the results are compared with predictions of models and with the results of other experiments.
Fig. 8 shows that is a non-monotonic function of centrality with the maximum at approximately . Such a behavior strongly resembles the dependence of the magnitude of collective flow - directed and elliptic - on [39]. So, there is a natural suggestion that the fluctuations measured by may be caused by the collective flow. This suggestion was checked by performing a simple Monte Carlo analysis generating events with independent particles, following the measured inclusive distribution. The uniform azimuthal angle distribution of the events was modified by the collective elliptic flow but the particles remained independent from each other with respect to their transverse momenta. For such events the dynamical fluctuations vanish if the azimuthal angle acceptance is complete. However, the azimuthal angle acceptance of the NA49 detector is not flat, and consequently the azimuthal anisotropy generates a finite value of , even though the of particles are independent of each other. It was found that an abnormally large value of leads to as large as 17 MeV/c, but a realistic magnitude of , which depends on (according to [39] taken as (GeV/c)), results in a value of which is consistent with zero ( MeV/c). Thus, one concludes that the effect of the azimuthal anisotropy caused by the collective flow combined with the incomplete azimuthal acceptance is not responsible for the observed dynamical fluctuations.
In Fig. 10 the dependence of on the mean number of wounded nucleons is directly compared to predictions of the HIJING [40] model (default parameters were used) for all charged particles, and for negatively charged and positively charged particles separately. The same kinematic cuts are applied as for the data. The black lines represent the results of the HIJING simulations where the effect of the limited NA49 acceptance ( versus azimuthal angle) is taken into account. The gray lines refer to the HIJING predictions for full azimuthal acceptance to demonstrate the effect of the limited acceptance of the detector.
In contrast to the data, computed within the HIJING model does not change when going from elementary to central Pb+Pb collisions because the HIJING model represents an essentially independent superposition of N+N interactions. The effects of short range correlations (Bose-Einstein and Coulomb) have not been incorporated in the HIJING model. However it was estimated in the previous analysis [6] that the combined effect of short range correlations produces values on the level of 5 MeV/c for central Pb+Pb collisions. This effect strongly depends on multiplicity and becomes negligible for p+p interactions.
For the HIJING model values for positively charged particles are, as in the case of real data, lower than for negatively charged and for all charged particles. The fact that values for positively charged particles are always lower than for negatively charged ones has been found (using HIJING) to be related to the limited acceptance and treating protons as pions (assuming the pion mass for all produced particles).
When was first introduced [8] it was believed that its value would be non-zero for elementary interactions (mainly due to the versus dependence) and would vanish for heavier colliding systems as a result of equilibration. The present measurements do not confirm this expectation. Although is close to zero for central Pb+Pb collisions, the maximum value is observed not for p+p data, but for colliding systems with 40.
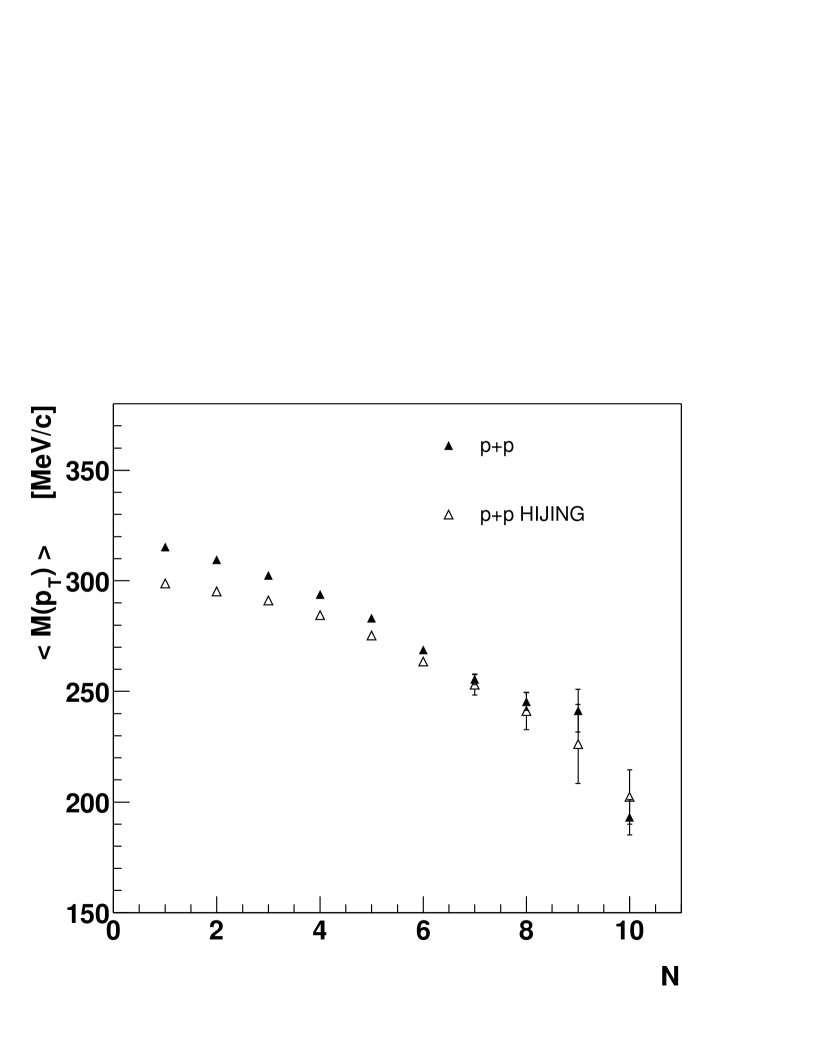
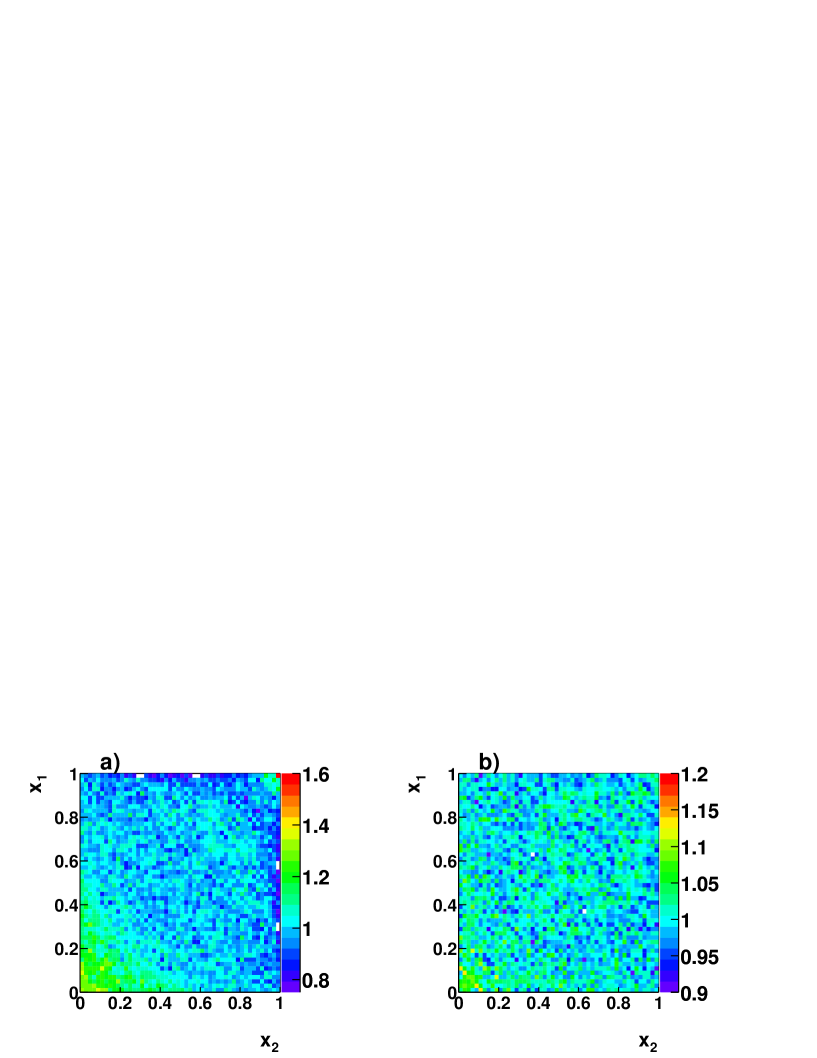
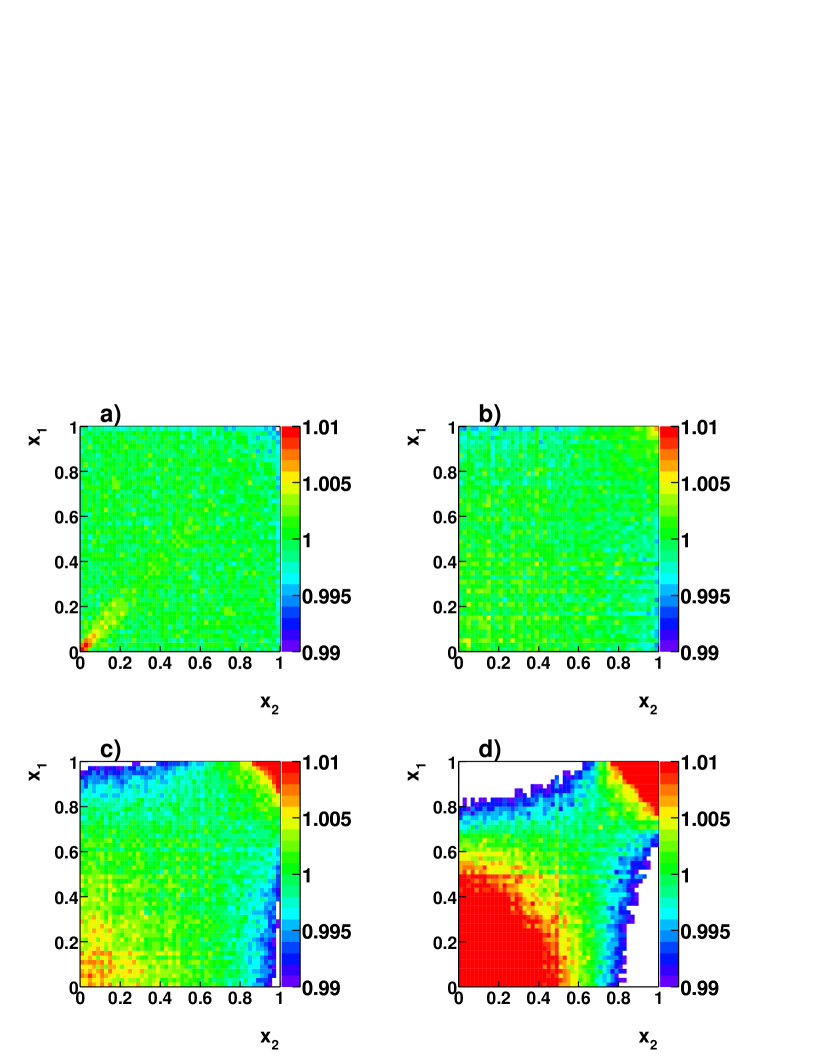
Although the value of is small for p+p collisions, a significant structure appears in the two-particle correlation plot (Fig. 9). The first candidate for its origin is the dependence of on , observed for elementary interactions [8]. Fig. 11 compares versus for the HIJING model and for real p+p data ( represents averaging over events with a given ). The HIJING model includes the NA49 acceptance and all kinematic restrictions. It shows good agreement with the measurements. Fig. 12 presents the p+p two-particle correlation plots for data (a), for the HIJING model (b) and for a simple random generator, which reproduces the dependence of on observed in the data (c). The accepted particle multiplicity distribution for the random generator (c) is the same as in the case of data (all kinematic cuts and NA49 geometric acceptance are included). Both models (b) and (c) qualitatively reproduce the structure of the two-particle correlation plot observed in the data, however, the HIJING model (b) shows additionally a small enhancement of the point density in the region of high .
The value calculated for model (c) for all charged particles equals 1.2 0.2 1.8 MeV/c and is consistent with for the p+p data (2.2 0.3 1.2 MeV/c). Nevertheless the small difference might indicate that, in agreement with the analysis presented in [29], there could be an additional source of correlations present in the data. However, due to the relatively high statistical and systematic errors the effect cannot be estimated quantitatively. A similar analysis was carried out for negatively charged particles only, where the correlations caused by resonances and by charge conservation are expected to be smaller than for all charged particles. There, the experimental value of is 0.8 0.1 1.2 MeV/c while the model (c) gives 0.6 0.2 0.3 MeV/c. Two-particle correlation plots for negatively charged particles only are very similar for data and for model (c). Thus, one concludes that the results on negative particles from p+p interactions are consistent with the conjecture [41] that the particles are emitted independently but that their and distributions depend on event multiplicity.
The last panel (d) of Fig. 12 presents the result of a simple temperature fluctuation model (the concept is described in [30]), which assumes that the only source of fluctuations is event-by-event fluctuation of the inverse slope parameter () of the transverse mass spectra. The model assumes a Gaussian shaped rapidity distribution and an exponential shape of the transverse mass distribution with the mean inverse slope parameter = 152 MeV adjusted to agree with the experimental p+p results. All kinematic cuts applied for the real data are also used in this model and the effect of the finite detector acceptance is taken into account. The mean multiplicity of all accepted particles is the same as in the data. The fluctuations of the inverse slope parameter lead to a saddle shaped structure in the two-particle correlation plots. Panel d) shows the result for fluctuations of on the level of about 10% (the dispersion = 16 MeV). Because of the difference between the panels a) and d) one concludes that fluctuations of the inverse slope parameter are not the (main) source of correlations in p+p data.
The HIJING model has also been used to obtain a two-particle correlation plot for C+C collisions (Fig. 13 b), which appears to be similar to that observed for real events (Fig. 9). Fig. 13 a (the same as Fig. 12 b) presents p+p events simulated by the HIJING model. The structure observed for p+p collisions vanishes for heavier systems due to the dilution effect from the higher number of uncorrelated particles (resulting from different N+N interactions), whereas the measure is not affected by this dilution effect.
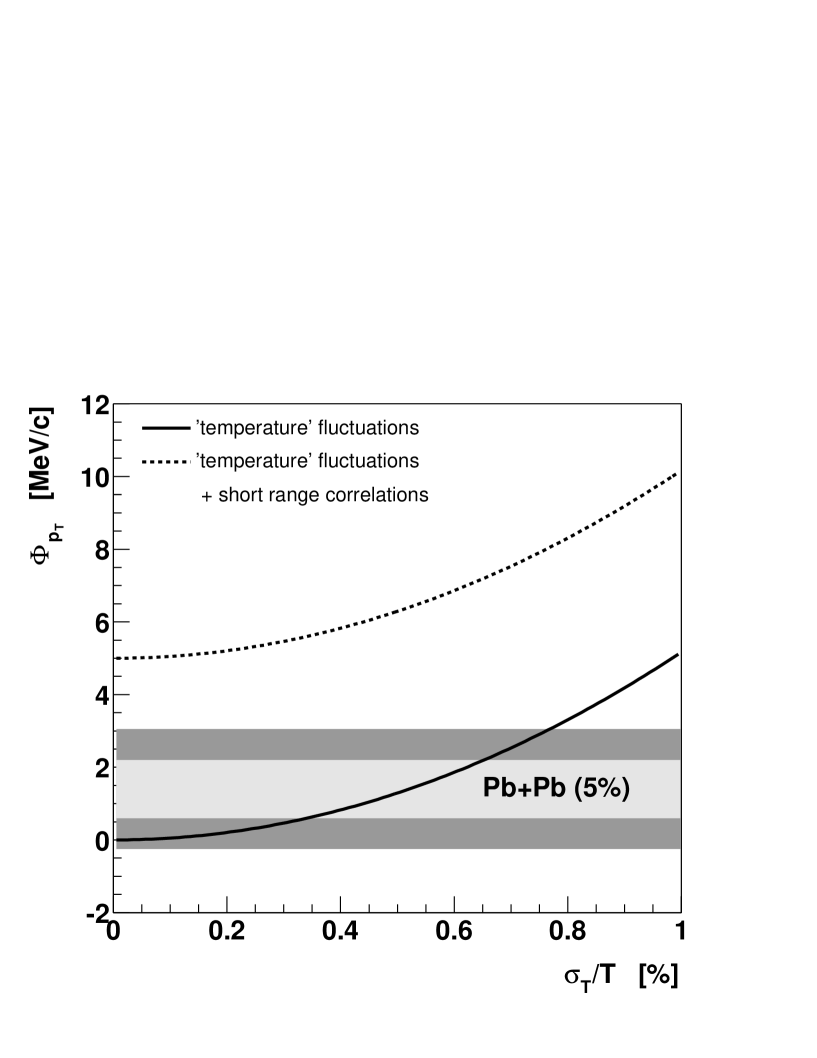
In order to see how dynamical fluctuations influence two-particle correlation plots for central Pb+Pb data the above model with fluctuations of the inverse slope parameter was used again. The mean inverse slope parameter was set to 190 MeV and the mean multiplicity of all accepted particles to 200 in order to compare the results with central Pb+Pb collisions. The inverse slope parameter varied from event to event with a Gaussian shaped distribution of width . Fig. 14 presents plots for different levels of the inverse slope parameter fluctuations. The fluctuations lead to a saddle shaped structure which is not visible in central Pb+Pb collisions. One can thus exclude significant fluctuations in central Pb+Pb collisions at top SPS energy. In Fig. 15 the predicted dependence of on fluctuations [30] is plotted and compared to measured for the 5% most central Pb+Pb interactions. The experimental value contains both short and long range correlations. The solid line corresponds to the -fluctuation model presented in [30] which does not include short range correlations. The dashed line is the combination of this model with a contribution of short range correlations estimated experimentally [6] as 5 MeV/c, in agreement with theoretical arguments [9, 10]. One sees that the observed value of is already below the contribution of the Bose-Einstein correlations and that the inclusion of slope fluctuations makes the difference even larger. Thus, one can conclude, in agreement with the previous results [6], that the data leave no space for significant fluctuations provided they are not canceled by other negative correlations.
An increase of transverse momentum fluctuations was predicted [14] to occur in A+A collisions which freeze out near a second order critical end point of the QCD phase diagram. Based on calculations from [14] and the numbers given in Table 3 it can be estimated that such critical fluctuations alone should result in MeV/c. This number is significantly larger than the maximum value of found in this analysis - for peripheral Pb+Pb interactions ( MeV/c). Note, however, that in this theoretical estimate the effect of the limited experimental acceptance was not taken into account.
Transverse momentum fluctuations in A+A collisions and elementary interactions were measured by several experiments in the SPS energy range. A value of MeV/c for charged hadrons was reported by the NA22 experiment in and interactions [42] at 250 GeV in a rapidity acceptance similar to the one used in this paper. The value obtained by the NA22 experiment is higher than the result presented in this paper for p+p interactions at 158 GeV ( MeV/c). This can be caused by the differences in azimuthal acceptance, energy and types of interacting hadrons.
The CERES experiment at the SPS measured MeV/c for charged hadrons in central Pb+Au collisions at 158 GeV [43]. This measurement was performed close to mid-rapidity (pseudo-rapidity ) in the range GeV/c and with full azimuthal angle acceptance. A somewhat smaller value, MeV/c, is found in this paper for the similar Pb+Pb reaction at forward rapidities.
Significant non-statistical fluctuations ( MeV/c) were measured for charged hadrons at mid-rapidity in central Au+Au collisions at = 130 GeV by the STAR experiment [44]. At the RHIC energies fluctuations are expected to be larger than at the SPS due to a significant contribution of correlated particles originating from (mini-)jet fragmentation.
A non-monotonic centrality dependence of fluctuations, with a maximum for semi-central Au+Au collisions, was reported by the PHENIX experiment at = 200 GeV [45]. This result is in qualitative agreement with the result presented in this paper for Pb+Pb collisions at 158 GeV. A centrality dependence of fluctuations was observed also by the STAR experiment at = 130 GeV [44].
It should be stressed that currently available event-by-event measurements were performed in a limited acceptance, the multiplicity of observed particles being below 20% of the total multiplicity. Consequently, the sensitivity of these measurements, in particular to long range correlations is reduced. It is desirable to perform future event-by-event measurements in an extended acceptance.
7 Summary
Transverse momentum event-by-event fluctuations were studied for p+p, C+C, Si+Si and Pb+Pb collisions at 158 GeV. The analysis was limited to the forward rapidity region. Three different characteristics were measured: the fluctuations of average transverse momentum () of the event, the fluctuation measure, and transverse momentum two-particle correlations. All measured values are below 10 MeV/c and are much smaller than the dispersion of the inclusive distribution. However, the correlations observed in p+p collisions are not simply more and more diluted when going to heavier colliding systems as could be expected if the created matter approaches a higher level of equilibrium with increasing system size. Instead, a significant system size dependence of the measure is seen with a maximum for peripheral Pb+Pb collisions with 40. The two-particle correlation plot for p+p data shows a prominent structure which was found to be connected with the dependence of on . This structure disappears when going to heavier colliding systems. Instead short range correlations become visible as an enhancement of the point density in the region close to the diagonal. This effect is strongest for the most central Pb+Pb interactions. No structure characteristic of event-by-event temperature fluctuations is observed.
The HIJING model qualitatively reproduces the structure of two-particle correlation plots for p+p and C+C data. However, in contrast to the data, it shows no centrality dependence of .
In future, a study of the energy dependence of transverse momentum fluctuations in the CERN SPS energy range is planned using the NA49 Pb+Pb collision data taken at different beam energies. The aim is to search for possible anomalies connected with the onset of the deconfinement phase transition, which is indicated by features of pion and strangeness production at low SPS energies [3].
Acknowledgments
This work was supported by the Director, Office of Energy Rese arch, Division of Nuclear Physics of the Office of High Energy and Nuclear Physics of the US Department of Energy (DE-ACO3-76SFOOO98 and DE-FG02-91ER40609), the US National Science Foundation, the Bundesministerium für Bildung und Forschung, Germany, the Alexander von Humboldt Foundation, the UK Engineering and Physical Sciences Research Council, the Polish State Committee for Scientific Research (2 P03B 130 23, SPB/CERN/P-03 /Dz 446/2002-2004, 2 P03B 02418, 2 P03B 04123), the Hungarian Scientific Research Foundation (T032648, T14920 and T32293), Hungarian National Science Foundation, OTKA, (F034707), the EC Marie Curie Foundation, and the Polish-German Foundation.
References
- [1] J. C. Collins and M. J. Perry, Phys. Rev. Lett. 34, 1353 (1975), E. V. Shuryak, Phys. Rept. 61, 71 (1980); ibid. 115, 151 (1984).
- [2] M. Gaździcki and M. I. Gorenstein, Acta Phys. Polon. B30, 2705 (1999).
- [3] S. V. Afanasiev et al. (NA49 Collab.), Phys. Rev. C66, 054902 (2002).
- [4] For a review see: H. Heiselberg, Phys. Rept. 351, 161 (2001).
- [5] R. Stock, Proceedings of the NATO Advanced Study Workshop on Hot Hadronic Matter: Theory and Experiment, Divonne-les-Bains, France, 27 June-1 July 1994.
- [6] H. Appelshäuser et al. (NA49 Collab.), Phys. Lett. B459, 679 (1999).
- [7] S. V. Afanasiev et al., Phys. Rev. Lett. 86, 1965 (2001).
- [8] M. Gaździcki and St. Mrówczyński, Z. Phys. C54, 127 (1992).
- [9] St. Mrówczyński, Phys. Lett. B439, 6 (1998).
- [10] St. Mrówczyński, Phys. Lett. B465, 8 (1999).
- [11] M. Gaździcki, Eur. Phys. J. C8, 131 (1999).
- [12] St. Mrówczyński, Phys. Lett. B459, 13 (1999).
- [13] L. Stodolsky, Phys. Rev. Lett. 75, 1044 (1995); E.V. Shuryak, Phys. Lett. B423, 9 (1998).
- [14] M. Stephanov, K. Rajagopal, and E. V. Shuryak, Phys. Rev. D60, 114028 (1999).
- [15] St. Mrówczyński, Phys. Lett. B430, 9 (1998).
- [16] E. V. Shuryak, Nucl. Phys. A715, 289 (2003).
- [17] G. Baym and H. Heiselberg, Phys. Lett. B469, 7 (1999).
- [18] S. Jeon and V. Koch, Phys. Rev. Lett. 85, 2076 (2000).
- [19] M. Asakawa, U. Heinz and B. Müller, Phys. Rev. Lett. 85, 2072 (2000).
- [20] N. G. Antoniou et al., Phys. Lett. B432, 8 (1998).
- [21] Z. Fodor, S. D. Katz, JHEP03, 014 (2002).
- [22] S. A. Voloshin et al., Phys. Rev. C60, 024901 (1999).
- [23] T. Trainor, arXiv:hep-ph/0001148.
- [24] R. L. Ray (for the STAR Collab.), Nucl. Phys. A715, 45 (2003).
- [25] M. Bleicher et al., Phys. Lett. B435, 9 (1998).
- [26] A. Capella, E. G. Ferreiro and A. B. Kaidalov, arXiv:hep-ph/9903338.
- [27] F. Liu, A. Tai, M. Gaździcki and R. Stock, Eur. Phys. J. C8, 649 (1999).
- [28] O. V. Utyuzh, G. Wilk and Z. Wlodarczyk, Phys. Rev. C64, 027901 (2001).
- [29] R. Korus and St. Mrówczyński, Phys. Rev. C64, 054906 (2001).
- [30] R. Korus, St. Mrówczyński, M. Rybczyński and Z. Wlodarczyk, Phys. Rev. C64, 054908 (2001).
- [31] J. G. Reid (for the NA49 Collab.), Nucl. Phys. A661, 407 (1999).
- [32] A. Bialas and M. Gaździcki, Phys. Lett. B252, 483 (1990).
- [33] L.S. Barnby et al. (NA49 Collab.), J. Phys. G25, 469 (1999).
- [34] S. Afanasiev et al. (NA49 Collab.), Nucl. Instrum. Meth. A430, 210 (1999).
- [35] K. Werner, Phys. Rept. 232, 87, (1993).
- [36] G. Cooper, Ph.D. thesis, Department of Physics, University of California, Berkeley, LBNL-45467 (2000).
- [37] C. Hoehne, Ph.D. thesis, Fachbereich Physik der Universität, Marburg (2003).
- [38] V. Friese (for the NA49 Collab.), arXiv:hep-ph/0111423 (2001).
- [39] C. Alt et al. (NA49 Collab.), Phys. Rev. C68, 034903 (2003).
- [40] M. Gyulassy and X.-N. Wang, LBL-34246 (1997).
- [41] A.I. Golokhvastov, JINR preprint, P2-2003-52 (2003), submitted to Yad. Fiz.
- [42] M. R. Atayan et al. (NA22 Collab.), Phys. Rev. Lett. 89, 121802 (2002).
- [43] D. Adamova et al. (CERES Collab.), arXiv:nucl-ex/0305002 (2003).
- [44] J. Adams et al. (STAR Collab.), arXiv:nucl-ex/0308033.
- [45] J. Nystrand (for the PHENIX Collab.), Nucl. Phys. A715, 603 (2003).
| No. of events | in each bin | range [fm] | ||
|---|---|---|---|---|
| p+p | 570 000 | 0.9 | 2 | |
| C+C | 33 000 | 0.153 | 14 | 0 - 2.0 |
| Si+Si | 63 000 | 0.122 | 37 | 0 - 2.6 |
| Pb+Pb(6) | 117 000 | 0.57 | 42 | 10.2 - |
| Pb+Pb(5) | 59 000 | 0.10 | 88 | 9.1 - 10.2 |
| Pb+Pb(4) | 68 000 | 0.10 | 134 | 7.4 - 9.1 |
| Pb+Pb(3) | 68 000 | 0.11 | 204 | 5.3 - 7.4 |
| Pb+Pb(2) | 45 000 | 0.075 | 281 | 3.4 - 5.3 |
| Pb+Pb(1) | 180 000 | 0.05 | 352 | 0 - 3.4 |
| 3.9 - 4.1 | 0 | 0.3 | 6500 |
| 4.1 - 4.3 | 0 | 0.3 | 5500 |
| 4.3 - 4.5 | 0 | 0.25 | 4500 |
| 4.5 - 4.7 | 0 | 0.25 | 3500 |
| 4.7 - 4.9 | 0 | 0.2 | 2500 |
| 4.9 - 5.1 | 0.5 | 0.2 | 2500 |
| 5.1 - 5.3 | 1.0 | 0.1 | 2500 |
| 5.3 - 5.5 | 1.5 | 0.1 | 2500 |
| [MeV/c] | [MeV/c] | [MeV/c] | |||
| p+p (all) | 1.4 | 1.3 | 304 | 196 | 2.2 0.3 |
| p+p (-) | 0.6 | 0.7 | 283 | 179 | 0.8 0.1 |
| p+p (+) | 0.8 | 0.9 | 317 | 206 | -1.4 0.3 |
| C+C (all) | 10 | 4.3 | 300 | 210 | 5.4 0.7 |
| C+C (-) | 4.5 | 2.4 | 279 | 190 | 1.8 0.8 |
| C+C (+) | 5.5 | 2.7 | 317 | 224 | 0.7 0.7 |
| Si+Si (all) | 27 | 7 | 301 | 217 | 4.9 0.8 |
| Si+Si (-) | 12 | 4 | 277 | 195 | 2.6 0.5 |
| Si+Si (+) | 15 | 4 | 320 | 231 | -0.2 0.7 |
| Pb+Pb(6) (all) | 39 | 18 | 299 | 220 | 7.2 0.7 |
| Pb+Pb(6) (-) | 18 | 9 | 270 | 195 | 4.5 0.5 |
| Pb+Pb(6) (+) | 21 | 10 | 325 | 237 | 1.9 0.7 |
| Pb+Pb(5) (all) | 73 | 17 | 305 | 226 | 6.6 0.7 |
| Pb+Pb(5) (-) | 34 | 9 | 273 | 199 | 4.5 0.7 |
| Pb+Pb(5) (+) | 39 | 9 | 333 | 245 | 0.6 0.8 |
| Pb+Pb(4) (all) | 104 | 19 | 309 | 230 | 5.6 0.8 |
| Pb+Pb(4) (-) | 49 | 10 | 276 | 202 | 3.8 0.5 |
| Pb+Pb(4) (+) | 55 | 11 | 337 | 249 | -0.6 0.9 |
| Pb+Pb(3) (all) | 148 | 21 | 312 | 233 | 4.6 0.8 |
| Pb+Pb(3) (-) | 69 | 11 | 279 | 204 | 2.9 0.8 |
| Pb+Pb(3) (+) | 79 | 12 | 342 | 252 | -1.3 0.8 |
| Pb+Pb(2) (all) | 193 | 21 | 315 | 234 | 2.2 1.0 |
| Pb+Pb(2) (-) | 90 | 11 | 281 | 205 | 2.4 0.8 |
| Pb+Pb(2) (+) | 103 | 13 | 344 | 254 | -3.7 1.1 |
| Pb+Pb(1) (all) | 230 | 19 | 317 | 236 | 1.4 0.8 |
| Pb+Pb(1) (-) | 108 | 11 | 281 | 203 | 0.9 0.6 |
| Pb+Pb(1) (+) | 122 | 12 | 349 | 257 | -2.9 0.8 |