Recent results from Belle
Abstract
New results on hadron physics from the Belle experiment are presented.
1 Introduction
These results are obtained using various data samples from 80 fb-1 to 150 fb-1 taken with the Belle detector NIM . We identify candidates by two kinematic variables: the energy difference, , and the beam constrained mass, , where is the beam energy and and are the momenta and energies of the decay products of the meson in the CM frame. The inclusion of charge conjugate modes is implicit throughout this report.
2 Observation of and broad states
A study of charmed meson production in decays provides an opportunity to test predictions of Heavy Quark Effective Theory (HQET) and QCD sum rules. decays to final states are its dominant hadronic decay modes and are measured quite well PDG . The large data sample accumulated in the Belle experiment allows to study production of meson excited states. s are P-wave excitations of quark-antiquark systems that contain one charmed and one light (,) quark.
decays have been studied using the and final states d2s_belle .
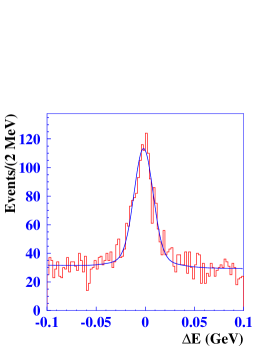
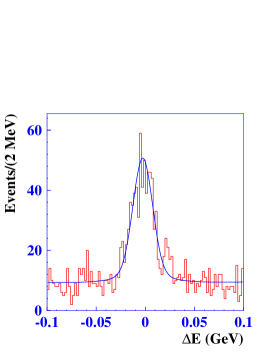
Figure 1 shows the distributions for the and candidates. The following branching fractions are measured: and , without any assumption about the intermediate final states.
| Mode | , | , | , |
|---|---|---|---|
| MeV | MeV | ||
| d2s_note | d2s_note | ||
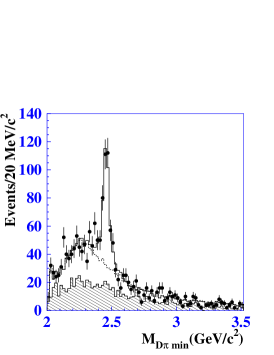
To study the dynamics of decays, analyses of the Dalitz plots are performed. The description of the Dalitz plot includes amplitudes of the known mode, possible contributions of the processes with virtual and production and an intermediate broad resonance structure with free mass and width. Figure 2(a) shows the invariant mass distribution together with the resulting fit. A clear signal of the broad resonance with is observed which can be identify as the scalar state. The results of the mass, width and branching fraction products are presented in Table 1.
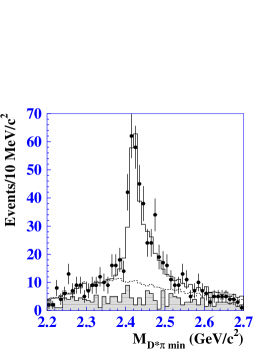
For the final state the fit of the density distribution is performed in four dimensional phase space to take into account the angles of the pion from decay. The fit function includes both known , intermediate state contributions and a broad resonance with free parameters. Figure 2(b) shows the invariant mass distribution as well as the resulting fit. Together with the narrow resonances a clear signal of the broad state is observed. The angular distribution of from this state is consistent with , . This state can be identified as a P-wave excitation of – . The results of the mass, width and branching fraction products are presented in Table 1.
Together with observations of the broad resonances the branching ratios of B decay to the modes with known : and have been measured. Using these measurements the ratio of branching fractions , consistent with the world average PDG , is obtained. The measured ratio is lower than the CLEO measurement r_cleo (although the results are consistent within errors) but is still a factor of two larger than the factorization prediction neubert . From our measurement it is impossible to determine whether the non-factorized part for tensor and axial mesons is large, or whether higher order corrections to the leading factorized terms should be taken into account.
Our measurements show that the narrow resonances compose of the decays and of the decays. This result is inconsistent with the QCD sum rule prediction and may indicate a large contribution from a color suppressed amplitude.
3 Observation of new states and
The narrow resonance at 2317 MeV, recently observed by the BaBar collaboration babar_dspi0 , is naturally interpreted as a P-wave excitation of the system. The observation of a nearby and narrow resonance by the CLEO collaboration cleo_dspi0 supports this view, since the mass difference of the two observed states is consistent with the expected hyperfine splitting for a P-wave doublet with total light-quark angular momentum bardeen ; pwave-doublets . The observed masses are, however, considerably lower than potential model predictions bartelt , and similar to those of the doublet states recently reported by Belle d2s_belle . Measurements of the quantum numbers and branching fractions (particularly those for radiative decays), will play an important role in determining the nature of these states.
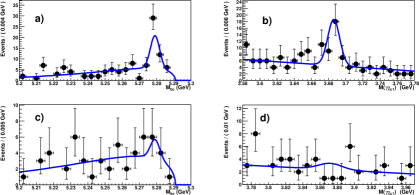
We confirmed both resonances and measured masses for and states to be MeV and MeV respectively belle_dsj . We also report the first observation of the radiative decay . Figure 3 shows the mass difference between the and candidates. The ratio is found to be .


We also search for production in decays dsj_bdecays . We reconstruct mesons in the , and decay channels. mesons are reconstructed in the , and decay channels. candidates are reconstructed from mesons and a , , or pair. The mass difference is used to select candidates. We use central mass values of 2317 MeV and 2460 MeV for and respectively and define signal regions within 12 MeV for the corresponding mass difference. We observe a clean signal for and . We also observe for the first time the decay. Figure 4(left) shows the invariant mass distributions for these decays. The measured branching fractions are presented in Table 2. We obtain the ratio , which is consistent with that from the continuum study.


| Decay channel | , | Signif. |
|---|---|---|
| — | ||
| — |
We also study the helicity distribution for the decay. The helicity angle is defined as the angle between the momentum in the meson rest frame and the momentum in the rest frame. The distribution in the data (Fig. 4(right)) is consistent with MC expectations for the hypothesis for the (n.d.f), and contradicts the hypothesis (n.d.f.). The hypothesis is already ruled out by the conservation of angular momentum and parity in .
4 Observation of a new narrow charmonium state in decay
A major experimental issue for the charmonium particle system is the existence of as yet unestablished charmonium states that are expected to be below threshold for decays to open charm and, thus, narrow. These include the singlet P state, the and possibly the singlet and triplet spin-2 D states, i.e. the and , all of which are narrow if their masses are below the threshold. The observation of these states and the determination of their masses would provide useful information about the spin dependence of the charmonium potential.
We report on an experimental study of the and mass spectra from exclusive and decays olsen using a 152M event sample. For the study we use events that have a pair of well identified oppositely charged electrons or muons with an invariant mass in the range GeV, a loosely identified charged kaon and a pair of oppositely charged pions.

Figure 5(a) shows the distribution of for events in the - signal region. Here a large peak corresponding to is evident at 0.589 GeV. In addition, there is a significant spike in the distribution at 0.775 GeV. Figure 5(b) shows the same distribution for a large sample of generic Monte Carlo (MC) events. Except for the prominent peak, the distribution is smooth and featureless.
| Quantity | region | MeV region |
|---|---|---|
| Signal events | ||
| peak | MeV | MeV |
| MeV | MeV |
We make separate fits to the data in the ( MeV) and the MeV ( MeV) regions using a simultaneous unbinned maximum likelihood fit to the , , and distributions. The results of the fits are presented in Table 3. Figures 6(a), (b) and (c) show the , , and signal-band projections for the MeV signal region, respectively. The superimposed curves indicate the results of the fit. There are clear peaks with consistent yields in all three quantities. The signal yield of events has a statistical significance of . In the following we refer to this as the .
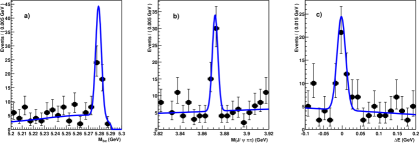
We determine the mass of the signal peak relative to the well measured mass: . Since we use the precisely known value of the mass PDG as a reference, the systematic error is small. The measured width of the peak is MeV, which is consistent with the MC-determined resolution and the value obtained from the fit to the signal. From this we infer a 90% confidence level (CL) upper limit of MeV.
We determine a ratio of product branching fractions for and to be .
The decay of the charmonium state to is an allowed transition with a partial width that is expected to be substantially larger than that for the final state; e.g. the authors of Ref. eichten predict . Thus, a measurement of the width for this decay channel can provide important information about the nature of the observed state. We searched for an signal in the decay channel, concentrating on the final state.
We select events with the same and charged kaon requirements plus two photons, each with energy more than 40 MeV. The signal-band projections of and for the region are shown in Figs. 7 (a) and (b), respectively, together with curves that represent the results of the fit. The fitted signal yield is events. The number of observed events is consistent with the expected yield of events based on the known and branching fractions PDG and the MC-determined acceptance.
The results of the application of the same procedure to the MeV region are shown in Figs. 7(c) and (d). Here, no signal is evident; the fitted signal yield is . From these results, we determine a 90% CL upper limit on the ratio of partial widths of . This limit on the decay width contradicts expectations for the charmonium state.
The mass of the observed state is higher than potential model expectations for the center-of-gravity (cog) of the states: MeV tye ; cornell .
In summary, we have observed a strong signal for a state that decays to with MeV and MeV (90% CL). This mass value and the absence of a strong signal in the decay channel are in some disagreement with potential model expectations for the charmonium state. The mass is within errors of the mass threshold ( MeV PDG ), which is suggestive of a loosely bound multiquark “molecular state,” as proposed by some authors voloshin .
5 Measurement of the cross-sections
The processes have not previously been observed at energies . A calculation in the HQET approach based on the heavy-quark spin symmetry grozin , predicts cross-sections of about 5 pb-1 for and at GeV (the subscripts indicate transverse [T] and longitudinal [L] polarization of the ); the cross-section for is expected to be suppressed by a factor of .
This analysis uglov is based on 88.9 fb-1 of data taken at or near the resonance. We reconstruct and mesons in the decay modes , and . mesons are reconstructed in the decay mode.
The processes can be identified by energy-momentum balance in fully reconstructed events that contain only a pair of charm mesons. However, the reconstruction efficiency is small in this case. Taking into account two body kinematics, it is sufficient to reconstruct only one of the two charmed mesons in the event to identify the processes of interest. We choose the mass of the system recoiling against the reconstructed () as a discriminating variable: , where and are the CM energy and momentum of the reconstructed . For the signal a peak in the distribution around the nominal mass of the recoiling or is expected. This method provides a significantly higher efficiency, but also a higher background, in comparison to full event reconstruction. For the processes we reconstruct in addition a slow pion from the decay. This reduces the background to a negligible level.
We calculate the difference between the masses of the systems recoil mass against a combination, and against the alone, . The variable peaks around the nominal mass difference with a resolution of as found by Monte Carlo simulation. For we combine candidates together with and require to be within a interval around the nominal mass difference.
The and distributions are shown in Figs. 8(a) and 8(b), respectively. Clear signals are observed in both cases. The higher recoil mass tails in the signal distribution are due to initial state radiation (ISR). The hatched histograms show the distributions for events in the sidebands.


Since the reconstruction efficiency depends on the production and helicity angles, we perform angular analysis before computing cross-sections. A scatter plot of the helicity angles for the two -mesons from ( vs ) for the recoil mass region GeV is shown in Fig. 9(a). The distribution is fitted by a sum of three functions corresponding to the , and final states, obtained from Monte Carlo simulation. The fit finds the fractions of , and final states to be , and , respectively. Figure 9(b) shows the meson helicity distribution for . The fraction of the final state is found from the fit to be equal to .


We search for the process by studying the recoiling against the reconstructed . Fig. 8(c) shows the distribution of after mass sideband subtraction. To extract the and yields we fit this distribution with the sum of two signal functions corresponding to and peaks and a threshold function describing background events. The fit finds events in the peak and in the peak. We obtains a cross-section of pb which agrees with the result using the method. For the cross-section we set an upper limit of 0.04 pb at the 90% confidence level.
In summary, we report the first measurement of the cross-sections for the and processes at GeV to be pb and pb, respectively, and set an upper limit on the cross-section of 0.04 pb at 90% CL. The measured cross-sections are an order of magnitude lower than those predicted in Ref. grozin , but their relative sizes are as predicted: the cross-sections for and are found to be close each other, while the cross-section for is much smaller. The helicity decomposition for is found to be saturated by the final state (the fraction is equal to ) and for — by the final state (), in good agreement with the predictions of Ref. grozin .
6 Observation of production and its mass measurement
Belle recently observed the production in exclusive decays to , where the is reconstructed in the final state. The mass was measured to be MeV olsen_etac2s which is much larger than the previous Crystal Ball measurement of MeV crball_etac2s . This year Belle also observed production ( events) in double charmonia events and confirmed a higher mass belle_conf_0331_pasha .
7 Conclusion
We have observed a strong signal for a new charmonium state that decays to with MeV, MeV at 90% CL. We confirm the observation of and and report the first observation of the decay . We also observe production in decays. In decays all four P-wave have been observed and their parameters have been measured. For the broad and states there are the first measurements.
References
- (1) Belle Collaboration, A. Abashian et al., Nucl. Inst. and Meth. A 479, 117 (2002).
- (2) K. Hagiwara et al. (Particle Data Group), Phys. Rev. D 66, 010001 (2002).
- (3) Belle Collaboration, K.Abe, et al. hep-ex/0307021, submitted to Phys. Rev. D.
- (4) CLEO Collaboration, G. Gronberg et al., CLEO CONF 96-25, Proc. of the ICHEP 96, July 1996, Poland.
- (5) Fixed from the parameters obtained in the analysis.
- (6) M. Neubert, Phys. Lett. B 418, 173 (1998).
- (7) BaBar Collaboration, B. Aubert et al., Phys. Rev. Lett. 90, (2003) 242001.
- (8) CLEO Collaboration, D. Besson et al., hep/ex-0305017.
- (9) W. Bardeen, E Eichten and C. Hill, Phys. Rev. D 68, 054024 (2003).
- (10) In the heavy -quark approximation, one expects two doublets of states with quantum numbers , () and , (). The second doublet has already been observed in and decays.
- (11) J. Bartelt and S. Shukla, Ann. Rev. Nucl. Part. Sci. 45 133, (1995).
- (12) Belle Collaboration, Y.Mikami et al., BELLE-CONF-0340, hep-ex/0307052, submitted to Phys. Rev. Lett.
- (13) Belle Collaboration, P.Krokovny et al., hep-ex/0308019 ,submitted to Phys. Rev. Lett.
- (14) A. Palano for the BaBar Collaboration, hep-ex/0309028.
- (15) Belle Collaboration, S.-K.Choi, S.L.Olsen et al., hep-ex/0309032, submitted to Phys. Rev. Lett.
- (16) E.J. Eichten, K. Lane, and C. Quigg, Phys. Rev. Lett. 89, 162002 (2002). See also P. Ko, J. Lee and H.S. Song, Phys. Lett. B395, 107 (1997).
- (17) See, for example, M.B. Voloshin and L.B. Okun, JETP Lett. 23, 333 (1976); A. De Rujula, H. Georgi and S.L. Glashow, Phys. Rev. Lett. 38, 317 (1977); and N. Tornqvist, Z. Phys. C 61, 525 (1994).
- (18) E. Eichten, K. Gottfried, T. Kinoshita, K.D. Lane and T.M. Yan, Phys. Rev. D 21, 203 (1980).
- (19) W. Buchmüller and S-H.H. Tye, Phys. Rev. D 24, 132 (1981).
- (20) A. G. Grozin, M. Neubert, Phys. Rev. D 55, 272 (1997).
- (21) Belle Collaboration, K.Abe et al. BELLE-CONF-0332, hep-ex/0307084.
- (22) Belle Collaboration, S.-K.Choi, S.L.Olsen et al., Phys. Rev. Lett. 89, 102001 (2002)
- (23) Crystal Ball Collaboration, C.Edwards et al., Phys. Rev. Lett. 48, 70 (1982).
- (24) Belle Collaboration, K.Abe et al., BELLE-CONF-0331.