LATEST NEWS FROM SNO
Abstract
From the initial pure D2O phase, the SNO experiment has measured the flux of 8B solar neutrinos via CC, NC, and ES interactions. The NC flux measurement, , represents the total flux of active neutrinos and is consistent with solar model expectations. When combined with the CC, , and ES, results, SNO demonstrates the existence of neutrino flavour transformations at the 5.3 level.
The second salt phase of SNO operation is nearing completion. The detector calibration for this phase has been carried out and systematic uncertainties have been evaluated in preparation for the first salt publication. As demonstrated from MC simulation studies, 1 year of salt data livetime will produce CC and ES results with similar precision as the pure D2O phase and a substantially improved NC measurement. In addition, precision flux measurements with no energy constraint will be possible.
1 Introduction
The Sudbury Neutrino Observatory (SNO) [1], a 1000 T D2O Cerenkov detector located 2 km underground (6010 m water equivalent) in Sudbury, Canada, is sensitive to 8B solar neutrinos via the interactions
| (1) |
where represents all active neutrino flavours.
Whereas the charged current (CC) interaction is only sensitive to neutrinos, the neutral current (NC) interaction is equally sensitive to all active neutrino flavours. This sensitivity to non- neutrinos, combined with the precise flux measurement from the CC channel, gives SNO the unique ability to test the hypothesis that a portion of the ’s produced in the sun undergo flavour change while in transit to earth. The elastic scattering (ES) interaction does have some sensitivity to non- neutrinos but for SNO is a low statistics channel.
Since the standard solar model predicts a negligible flux of non- neutrinos, a non-zero difference between the total flux of active neutrinos from the NC channel and the flux of electron neutrinos from the CC channel would provide a clear indication of neutrino flavour transformation.
SNO has nearly completed the second of the first two phases of data taking. Results from the initial ‘pure D2O’ phase, in which the central target consisted solely of purified heavy water, are described in the next section of this document. The final section provides an update of the status of the second ‘salt phase’ in which the characteristic response of NC events has been altered by the addition of NaCl to the D2O.
2 Pure D2O Phase Results
2.1 SNO Detector, Calibration, and Backgrounds
The SNO Detector consists of 9456 photo-multiplier tube (PMT) and light concentrator units arrayed on a geodesic support structure. This array surrounds a 1700 T spherical shell of light water, which in turn encloses the spherical acrylic vessel containing the 1000 T of heavy water.
Electrons produced in the D2O emit a cone of Cerenkov light which is detected by the PMT’s. Neutrons produced in the detector can be captured by a deuteron which subsequently emits a 6.25 MeV photon. Photons interact with electrons in the D2O via Compton scattering and these electrons are detected as described above.
The event energy is approximately linearly related to the number of PMT’s registering light. Vertex positions and event directions are reconstructed via fitting algorithms which use the relative PMT positions and firing times to reconstruct the Cerenkov cone.
In order to understand the detector response and systematic uncertainties, a series of calibration sources are placed at various positions within the detector volume. Analyses of the calibration data and comparisons with Monte Carlo simulated events are then carried out.
The optical properties of the detector are evaluated by transmitting laser light at wavelengths between 337-620 nm into the D2O volume via optical fibers affixed to a glass diffusing ball. The response of the PMT array, for various positions of the diffusing ball, is evaluated and the optical properties of the detector measured.
In order to set the absolute energy scale and to evaluate energy scale and resolution uncertainties, an 16N source[2], which emits 6.13 MeV photons, is utilized. These studies are supplemented by 8Li source [3] runs in which ’s with an end point near 14 MeV are produced and 3H(p,)4He(‘pT’) source [4] runs in which 19.8 MeV photons are emitted. In addition to the energy response, these sources are also used to determine the reconstructed event vertex and event direction detector response and uncertainties.
The NC flux measurement requires an understanding of the detector neutron capture efficiency. A 252Cf source is introduced at various positions within the detector to produce a known quantity of neutrons and analysis of this data provides a measurement of the capture efficiency and uncertainties.
Evaluations of backgrounds in the data set are carried out through a variety of ex-situ and in-situ analyses. Instrumental backgrounds are evaluated through an examination of calibration data and a series of selection cuts adopted to suppress them. Ex-situ measurements using ion exchange and membrane degassing techniques coupled with in-situ analyses of the SNO low-energy signal region are employed to estimate the level of radioactive thorium and uranium backgrounds. These backgrounds give rise to photons that contaminate the low-energy region of the SNO spectrum and, more crucially, can cause photo-disintegration of the deuterons inducing a neutron background signal indistinguishable from NC events.
| Source | CC Uncert. % | NC Uncert. % | Uncert. % |
|---|---|---|---|
| Energy scale | -4.2,+4.3 | -6.2,+6.1 | -10.4,+10.3 |
| Energy resolution | -0.9,+0.0 | -0.0,+4.4 | -0.0,+6.8 |
| Vertex accuracy | -2.8,+2.9 | ||
| D2O Cerenkov | -0.1,+0.2 | -2.6,+1.2 | -3.7,+1.7 |
| PMT Cerenkov | -2.1,+1.6 | -3.0,+2.2 | |
| Neutron capture | -4.0,+3.6 | -5.8,+5.2 | |
| Total uncertainty | -5.2,+5.2 | -8.5,+9.1 | -13.2,+14.1 |
The combined systematic uncertainties from these studies are presented in Table 1.
2.2 Pure D2O Phase Results
After applying data cuts to reduce backgrounds, including a lower kinetic energy threshold cut of T MeV, and event vertex radius cut R cm, 2928 events are selected from the 306.4 days of live time collected between Nov. 2, 1999 and May 28, 2001.
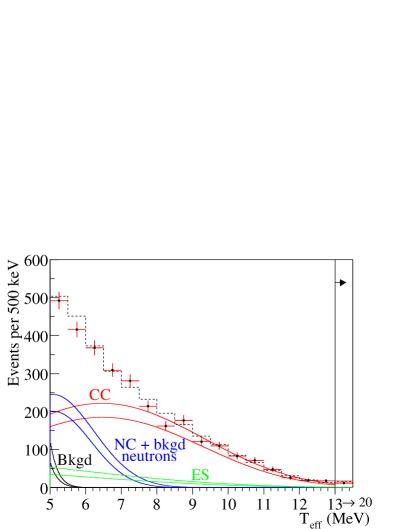
The reconstructed energy, angle between event direction and direction to the sun, and vertex radius spectra from this sample are simultaneously fit using an extended maximum likelihood technique to estimate the relative fractions of CC, NC, and ES events in the sample.
The fit results, assuming a standard 8B spectral shape[5], are CC events, ES events, and NC events; only statistical uncertainties are given. Figure 1 shows the energy spectrum of the data overlayed by the fit distribution and the relative contributions from CC, ES, NC, and backgrounds.
The measured fluxes of 8B neutrinos from each of the three channels, including systematic uncertainties, are [6][7]
| (2) | |||||
| (3) | |||||
| (4) |
Transforming these numbers into estimates of the flux of and the flux of (assuming only three active neutrino flavours) gives
| (5) | |||||
| (6) |
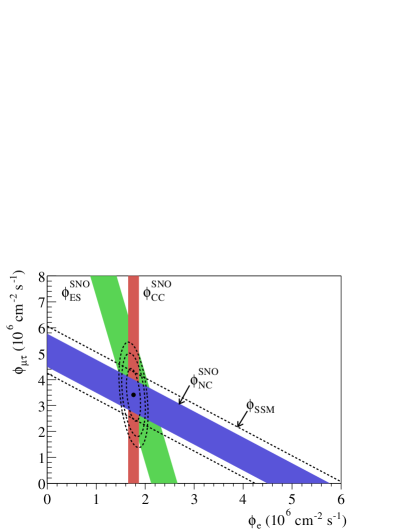
The measured non-zero flux of neutrinos indicates, at a more than 5 level, that produced in the sun undergo flavour transformation. Figure 1 indicates this result graphically, where it may be seen that the measurement comes almost entirely from the CC result whereas the estimate is primarily given by the NC result. The ES result does provide additional information for both fluxes and is in good agreement with the CC and NC values.
The NC measured total flux of active 8B neutrinos given in Equation 4 is consistent with the standard solar model theoretical prediction [8] of However, this result requires constraining the shape of the 8B energy spectrum. Relaxing this constraint produces the less precise result
| (7) |
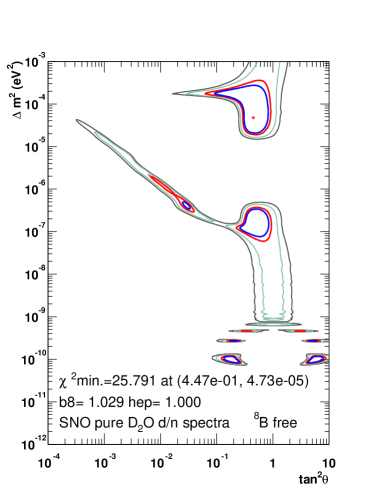
One of the leading theoretical candidates to explain neutrino flavour transformations is the MSW model [9]. SNO data has been evaluated in the context of this model producing the confidence level regions in the m2- plane given in Figure 2 [10]. As can be seen, a large portion of MSW space is rejected at the 90% C.L. by SNO data.
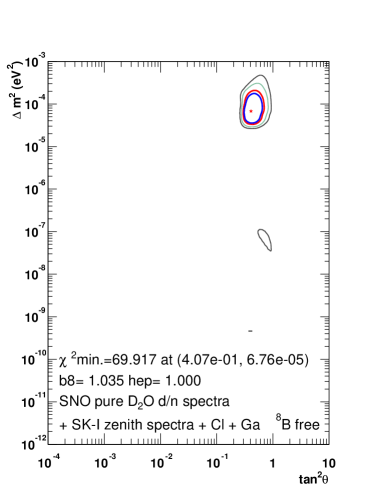
Combining the SNO measurements with results from Cl [11], Ga [13, 12, 14], and the Super-Kamiokande [15] experiments produces the confidence level contours given in Figure 2. As shown, current experimental evidence from solar neutrino experiments discounts all but LMA and LOW region solutions at better than a 99% C.L.. The relative minima in these two regions strongly favours the LMA solution.
3 Salt Phase Update
In May 2001, approximately 2 tonnes of NaCl was dissolved in the D2O volume of the SNO detector. The addition of the salt enhanced the neutron capture efficiency and the characteristic response to NC events. The first salt publication will focus on an initial data set corresponding to roughly 250 live days of running.
3.1 Detector Calibration and Response
As with the pure D2O phase, the detector response must be calibrated and systematic uncertainties evaluated for the salt phase. Three examples highlighting the current status of calibrations in the salt phase are given here.
The energy scale calibration is carried out via a combination of laser and 16N scans as outlined above. Full laser optical scans are taken at approximately 3-4 month intervals. 16N stability runs with the source positioned at the centre of the detector are taken every few weeks while full two-plane scans with the source located at many source positions throughout the D2O volume are taken every few months.
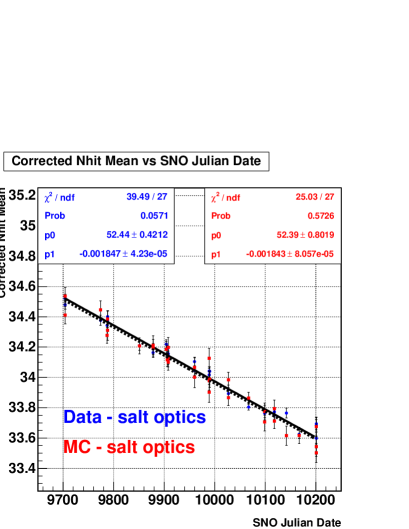
Early in the salt phase it was discovered that the energy response of the detector was changing with time. Figure 3 shows the mean effective number of PMT’s (Neff) triggering per 16N event as a function of run date for 16N stability runs. As can be seen, the response changes by approximately /year.
Subsequent evaluation of the laser data indicates that the measured D2O attenuations lengths were changing in a corresponding fashion. MC simulated 16N events have been generated assuming time varying attenuations and the mean effective number of PMT’s for each MC run are shown in Figure 3. As can be seen, the change in response predicted by the MC for the measured changing attenuations agrees well with the measured change in the 16N data.
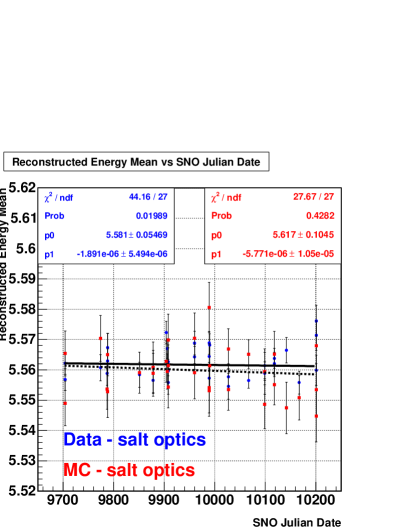
MC simulated electrons at a series energies are generated using the laser scan derived optical constants and a mapping between Neff and energy derived. After applying all corrections and this mapping function to the 16N events, the mean energy response shown in Figure 3 is produced. Systematic uncertainties associated with the stability of detector response in time are evaluated by examining the variations in and differences between the data and MC 16N energy distributions.
Systematic uncertainties associated with spatial variations and asymmetries in the detector are evaluated by examining 16N data and MC runs taken at various positions throughout the D2O volume. Including additional uncertainties associated with source modeling, rate dependence, hardware stability, timing calibration, and cross-talk the total energy scale systematic uncertainty is roughly percent level.
The primary method for distinguishing ES events from other signal and background events is to exploit the fact that the reconstructed event directions for such events will be correlated with the direction to the sun. Hence a good understanding of the detector angular response is required.
Data and MC 16N events are used to evaluate the systematic uncertainties on the angular response. What is important here is the agreement between data and MC spatially and temporally.
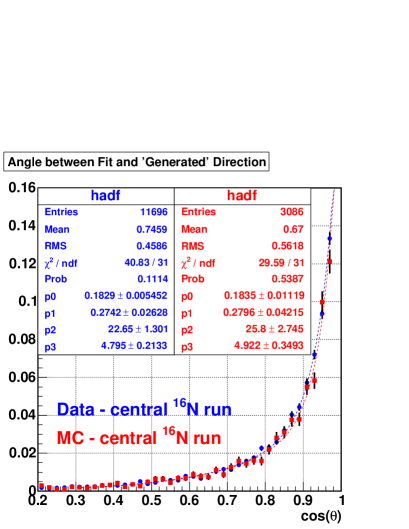
For these events, the ‘generated’ event direction is taken to be the direction from the 16N source position to the reconstructed event vertex. To ensure a reliable estimate for the ‘generated’ direction, a cut is placed requiring the reconstructed vertex of the electron to be at least 150 cm away from the 16N source position.
Figure 4 shows the distribution of the cosine of the angle between the fit and ‘generated’ direction for data and MC 16N events for a run taken at the centre of the detector. In order to characterize the these distributions, the following simple three parameter function
| (8) |
is fit to the distributions. The overall normalization is arbitrary but left free in the fit. As can be discerned in Figure 4, there is good agreement between the data and MC fit parameters for this run.
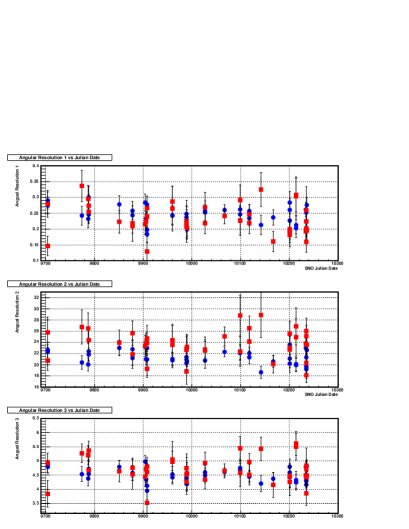
Figure 4 shows distributions of the three fit parameters for data and MC runs as a function of run date. Systematic uncertainties are derived from these distributions are dominated by the mean difference between the data and MC. Analogous distributions have been evaluated as a function of radial position within the D2O volume with the total systematic uncertainty on these parameters assessed to be at the 10-15% level. This translates into negligible uncertainties on the CC and NC measurements but does contribute substantially to the ES total systematic uncertainty. The ES measurement is, however, still dominated by statistical uncertainties.
The most significant change with the inclusion of salt corresponds to the change in response to NC events (neutrons). In this configuration, neutrons are primarily captured on 35Cl with a subsequent release of multiple photons
| (9) |
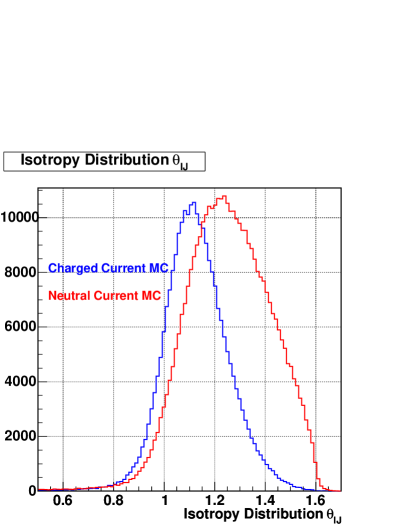
Thus not only does the higher capture cross-section on Cl dramatically improve the neutron detection efficiency, but in addition the the multiple photon nature of these events causes them to exhibit a greater degree of isotropy than, for example, CC events with a single Cerenkov cone.
Figure 5 compares CC and NC MC simulated events for isotropy parameter . This is the mean pair angle between PMT’s that have triggered in an event. As can be seen, such information is clearly useful in separating CC and NC events. In fact, utilizing this information will allow a precise determination of the fluxes to be made without the use of the energy spectrum.
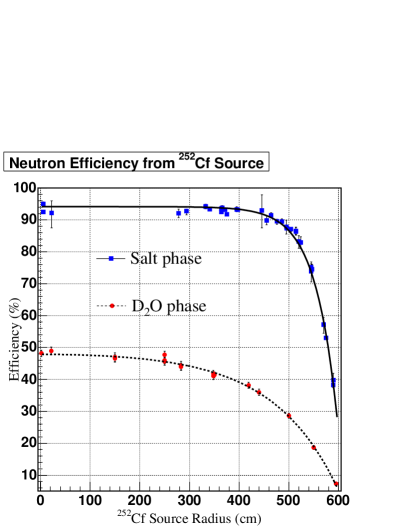
The neutron efficiency has been measured via analysis of neutrons produced from a 252Cf source placed at various positions within the D2O volume. Figure 5 shows the comparison of neutron detection efficiencies between the pure D2O and salt phases as a function of radial position within the D2O. The response at the centre of the detector is almost a factor of 2 higher in salt but, owing to the greater difference at high radii, the detection efficiency inside R=550 cm is improved by almost a factor of 3.
3.2 Signal Extraction
Signal extraction for the salt phase is carried out in the same fashion as pure D2O phase. The neutrino candidate event distributions are fit, using an unbinned extended maximum likelihood technique, with NC, CC, and ES signal pdf’s plus with fixed background pdf’s included. The primary difference for the salt phase is the altered shape of the NC pdf’s and the inclusion of an additional isotropy variable.
In order to evaluate the expected statistical sensitivities of the salt phase dataset, signal MC simulated samples with rates corresponding to the measured pure D2O fluxes were generated fit with various combinations of salt pdf’s. One live year of data was simulated and cuts corresponding to the pure D2O selection were applied.
Table 2 presents the percent statistical error from the published pure D2O results and for the salt MC study. When all four variables (energy, radius, angle between fit direction and direction to sun, and isotropy) are included in the fit, the CC and ES uncertainties are projected to be similar to the pure D2O but the NC measurement improves by almost a factor of 2.
| Phase | Variables in Fit | CC Error | NC Error | ES Error |
|---|---|---|---|---|
| Pure D2O | E,R, | 3.4% | 8.6% | 10% |
| Salt MC | E,R, | 4.2% | 6.3% | 10% |
| Salt MC | E,R,, | 3.3% | 4.6% | 10% |
| Salt MC | R,, | 3.8% | 5.3% | 10% |
Interestingly, when the energy pdf’s are not included in the fit the CC uncertainty does not increase appreciably and the NC uncertainty remains substantially better than in the pure D2O phase. Hence with the salt phase data a precision measurement will be made with no assumptions on the shapes of the signal energy distributions.
4 Summary
Precise measurements of the CC and NC fluxes from the pure D2O phase of SNO running have been presented. These results can be translated into values for electron neutrino and non-electron neutrino fluxes. The measurement of a statistically significant non-electron neutrino flux provides strong evidence for flavour transformation of electron neutrinos produced in the sun and can be consistent with an MSW oscillation model. The 8B shape constrained measurement of the total 8B neutrino flux is consistent with standard solar model predictions. The unconstrained measurement, while still consistent, is dominated by statistical uncertainties.
Various aspects of detector calibration and response for the salt phase have been presented including energy scale, angular resolution, and neutron response. As indicated, the salt phase detector response is well understood and these analyses are in an advanced stage in preparation for the forthcoming initial salt phase publication.
MC studies indicate that 1 year of salt livetime will produce a CC result with similar statistical precision as the pure D2O phase and an NC result with substantially improved statistical precision. Note that the currently published NC measurement uncertainty is dominated by statistics. In addition, it has been demonstrated that a precision energy-unconstrained fit can be made with the salt phase data.
References
- [1] The SNO Collaboration, Nucl. Instr. and Meth. A449, 172 (2000).
- [2] M.R. Dragowsky et al., Nucl. Instr. and Meth. A481, 284-296, (2002).
- [3] N.J. Tagg et al., Nucl. Instr. and Meth. A489, 178-188, (2002).
- [4] A.W.P. Poon et al., Nucl. Instr. and Meth. A452, 115, (2000).
- [5] C.E. Ortiz et al., Phys. Rev. Lett. 85, 2909 (2000).
- [6] Q.R. Ahmad et al., Phys. Rev. Lett. 87, 071301 (2001)
- [7] Q.R. Ahmad et al., Phys. Rev. Lett. 89, 011301 (2002).
- [8] J.N. Bahcall, M. H. Pinsonneault, and S. Basu, Astrophys. J. 555, 990 (2001).
- [9] S.P. Mikheyev, A.Y. Smirnov, Sov. Jour. Nucl. Phys. 42, 913-917 (1985).
- [10] Q.R. Ahmad et al., Phys. Rev. Lett. 89, 011302 (2002)
- [11] B.T. Cleveland et al., Astrophys. J. 496, 505 (1998).
- [12] J.N. Abdurashitov et al., Phys. Rev. C 60, 055801, (1999).
- [13] W. Hampel et al., Phys. Lett. B 447, 127 (1999).
- [14] M. Altmann et al., Phys. Lett. B 490, 16 (2000).
- [15] S. Fukuda et al., Phys. Rev. Lett. 86, 5651 (2001).