11institutetext: Institute of High Energy
Physics, Beijing, China 22institutetext: Dept. of Physics and Astronomy,
University of Hawaii, Honolulu, HI 96822, USA
Recent charmonium results from BES††thanks: Talk presented by
Jiangchuan Chen
Jiangchuan
Chen
11Frederick A. Harris
22
Abstract
Using 58 million decays, we have investigated the
invariant mass spectrum in the radiative decay and observe a prominent structure with mass
near . Fitting with an -wave Breit-Wigner, we obtain a peak
mass of . decays from the same sample
are used to determine the mass, width, and hadronic branching ratios
of the . From a sample of 14 million events, the
first observation of (J=0,1,2) decays to is made,
and branching ratios are determined, which are larger than expected
from the Color Octet Model. Branching ratios of in
both and decays are measured, and a more
than four sigma deviation from the pQCD predicted ”12% rule” is
observed. In decays, evidence for the non-
decay to is observed.
pacs:
13.20.GdDecays
of J/psi, Upsilon, and other quarkonia
1 Introduction
The Beijing Spectrometer (BES) is a general purpose
sole-
noidal
detector at the Beijing Electron Positron Collider (BEPC). BEPC
operates in the center of mass (cm) energy range from 2 to 5 GeV with a
luminosity at the energy of approximately
cm-2s-1. BES (BESI) is described in detail in Ref.
bes1 , and the upgraded BES detector (BESII) is described in
Ref. bes2 . This paper presents some recent results; details
may be found in the references.
2 Studies of
There is evidence for anomalous behavior in the proton-antiproton
system very near the mass threshold. The cross
section for has a narrow dip-like structure at a
cm energy of
FENICE . In addition, the proton’s time-like magnetic
form-factor, determined from high statistics measurements of the
annihilation process, exhibits a very steep fall-off
just above the mass threshold LEAR . These data are
suggestive of a narrow, -wave triplet resonance
with and mass near .
Using 58 million decays, we have investigated the invariant
mass spectrum of pairs in the radiative process
and observe a peak corresponding to at high mass and a prominent structure with mass near ,
as shown in Fig. 1.
Figure 2(a) shows the threshold region for the
selected events.
The solid curve is the result of a fit using an acceptance-weighted
-wave Breit-Wigner function to represent the low-mass enhancement
plus the dashed curve to represent the background, primarily
due to where one of
the photons from the is missed. The fit yields
a peak mass of and a full width of MeV. Here the systematic errors include errors determined by generating
Monte Carlo samples with below threshold peak masses and measuring the
shift in the
output fit masses.
Figure 1:
The invariant mass distribution for the
event sample
Figure 2:
(a) The near-threshold distribution for
the event sample. The solid curve
is the result of the fit;
the dashed curve shows the fitted background function.
(b) The distribution with events weighted
by .
Further evidence that the peak mass is below the threshold is
provided by Fig. 2(b), which shows the
distribution when the threshold behavior is removed
by weighting each event by , where q is the proton momentum in
the restframe and is the value for
GeV/. The sharp and monotonic increase at threshold can only occur
for an -wave BW function when the peak mass is below 2.
A -wave BW yields a fit which is worse than the -wave fit, but
still acceptable. The structure is
not consistent with the properties of any known particle.
More detail may be found in Ref. ppbar .
3 Parameters
The mass and width of the are rather poorly known; the
confidence level for the Particle Data Group (PDG) weighted average mass is only 0.001
PDG . Previously BES measured the mass using the BESI
4.02 million sample and obtained etac1 . BES also used 7.8 million BESI
events and obtained MeV
etac2 . For the two data sets combined, MeV and the total width MeV etac2 .
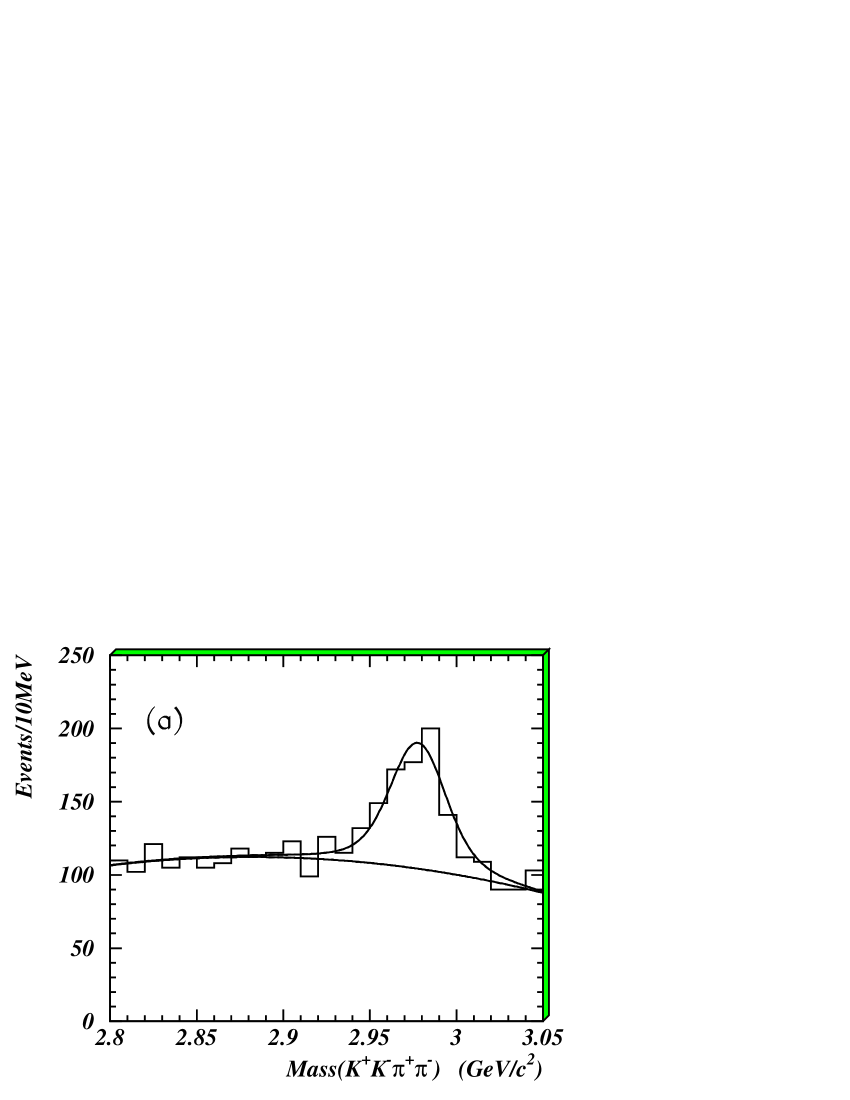
Here, the mass and width have been determined using our BESII 58 million
event sample. We use the channels , with , , ,
, and . Events are selected using
particle identification and kinematic fitting. Figs. 3 and
4 show the mass distributions in the mass region for
, and , respectively. Fitting the five decay
channels simultaneously, we obtain MeV and
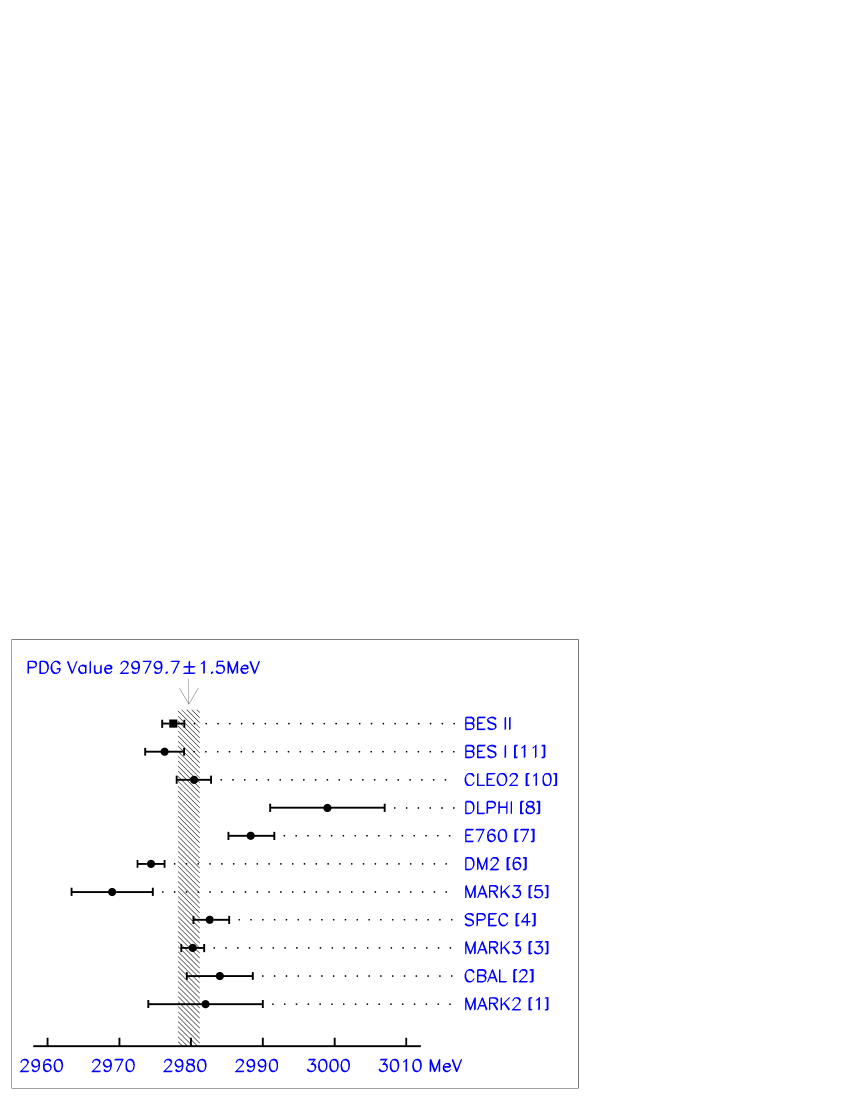
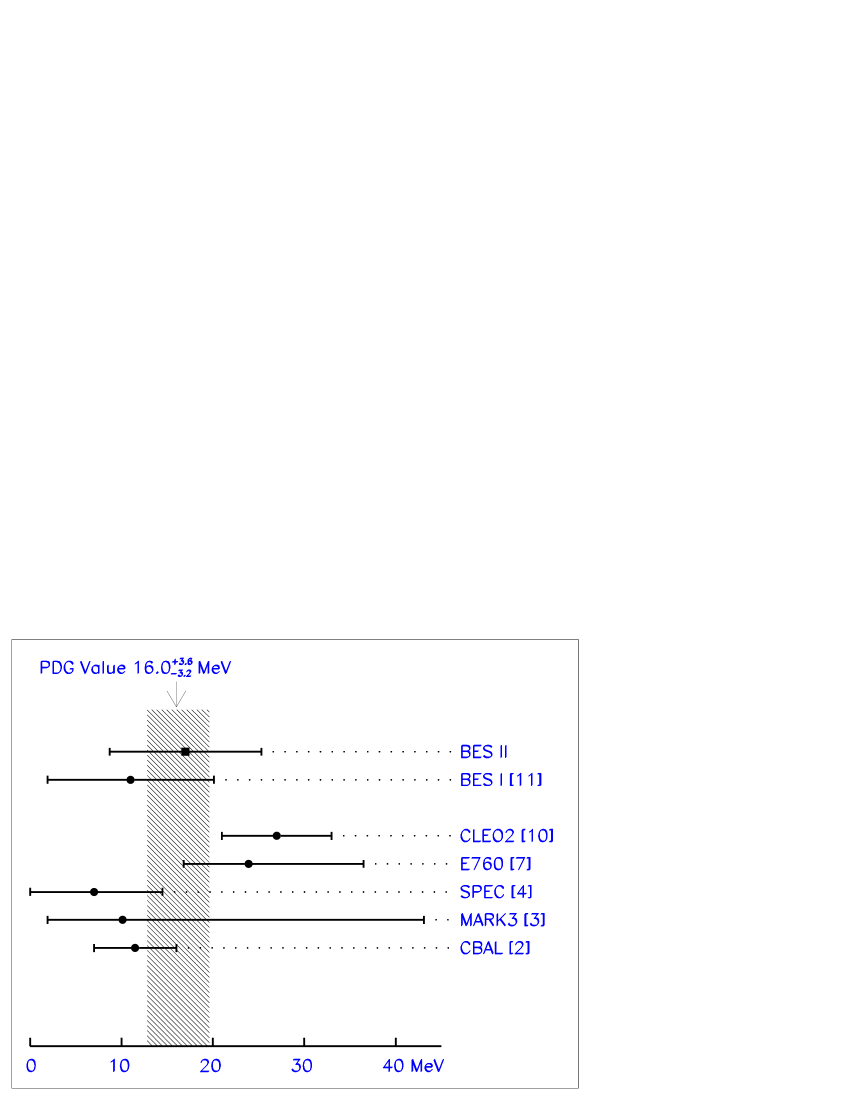
MeV. The results for the mass and width are compared with
previous measurements, including previous BES measurements, in
Figs. 5 and 6. The results are in good
agreement with previous BES measurements and the PDG fit values.
More detail on this analysis may be found in Ref. etanew .
Figure 3: The invariant mass distribution in the
region.
Figure 4: The invariant mass distribution
in the region.
Figure 5: Mass measurements of the meson.
Figure 6: Width measurements of the meson.
The numbers of events determined
from the fit and the corresponding product branching ratios, by decay channel,
are listed in Table 1.
Using the branching fraction PDG ,
preliminary branching fractions can be obtained. Table 2
shows the BES results together with the PDG PDG values.
The BES is smaller than
the current PDG value of and is consistent
with Belle belle2 and DM2 dm2 measurements within errors.
Details may be found in Ref. etacbr .
Table 1: Number of events and corresponding branching ratios
for the individual channels. Preliminary.
Process
Events
Product of
detected
branching ratios
Table 2: Branching fractions of the . Preliminary.
The lowest Fock state expansion (color singlet mechanism, CSM) of
charmonium states is insufficient to describe P-wave quarkonium
decays. Instead, the next higher Fock state (color octet mechanism,
COM) plays an important role so ; width . A calculation of the
partial width of using the COM and a carefully
constructed nucleon wave function wong , obtains results in
reasonable agreement with measurements PDG . Generalizing the
nucleon wave function to other baryons, the partial widths of many
other baryon anti-baryon pairs can be predicted. Among these predictions, the
partial width of is about half of that of (J=1,2) wong .
Using 14
million events and making
a scatter plot of the
versus the invariant mass for events with mass
between GeV/ and GeV/, a clear signal
is observed.
After requiring that both the and the
mass lie within twice the mass resolution around the nominal
mass, the invariant mass distribution shown in
Fig. 7 is obtained. There are clear , , and
signals. The highest peak around the mass is
due to with a fake photon.
Figure 7: Mass distribution of candidates fitted with three
resolution smeared Breit-Wigner functions and background, as
described in the text.
Background from non events is estimated from the mass
sidebands. The background from channels with
production, including , , , etc. are
simulated by Monte Carlo.
Fixing the , and mass resolutions at their
Monte Carlo predicted values, and fixing the widths of the three
states to their world average values PDG , the mass
spectrum (Fig. 7) was fit between 3.22 and
3.64 with three Breit-Wigner functions
folded with Gaussian resolutions and background, including a linear
term representing the non background and a component
representing the background.
Fig. 7 shows the fit
result.
The branching ratios of obtained are
where the first errors are statistical and the second are
systematic.
The results are
in contradiction with the expectations from Ref. wong ,
although the errors are large.
There is no prediction for
. More detail may be
found in Ref. gll .
5 Observation of in decays and
decays
There is a longstanding ” puzzle” between and
decays in some modes: compared with the corresponding
decays, many decay channels are suppressed
relative to the pQCD predicted ”12% rule” BES1 . Here
is observed for the first time in
the BESII 14 million event sample, and the
branching ratio is used to test the ”12% rule” between and
decays.
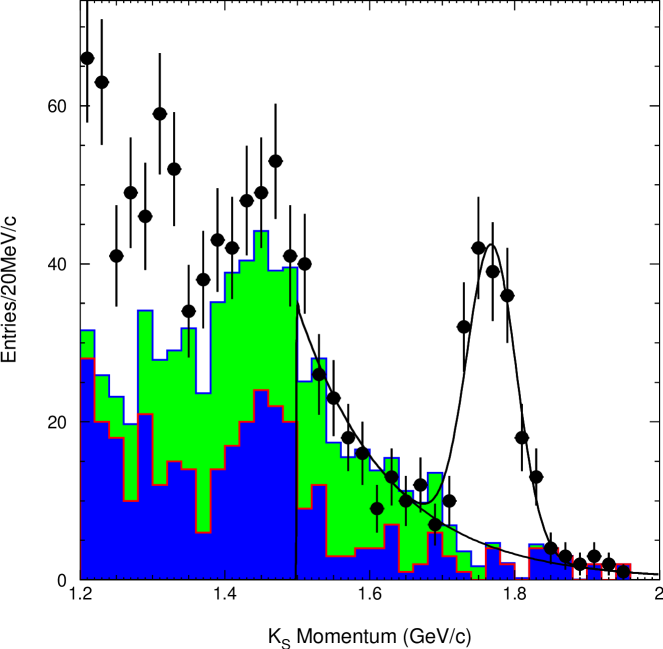
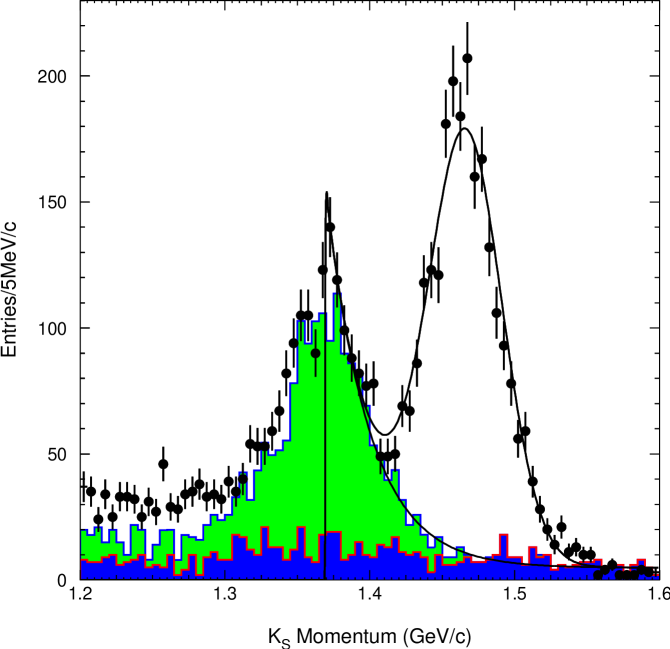
Candidate events are required to have two charged tracks with net
charge zero. The two tracks are assumed to be and , and
the fitted intersection of the two tracks is taken as the vertex.
After requiring the invariant mass within twice the mass
resolution around the nominal mass and a decay length
in the transverse plane longer than 1 cm, the momentum
distribution, shown in Figure 8, is
obtained. Also shown are the mass side band
events and Monte Carlo simulated backgrounds. The signal peak at 1.77
GeV is
fitted with a Gaussian, and the background below the peak is fitted
with an exponential function. The preliminary branching
ratio obtained is . This branching
ratio, together with results for and
, have been used to extract the relative phase between the
three-gluon and the one-photon annihilation amplitudes of
decays to pseudoscalar meson pairs. It is found that a phase around
can explain the result Yuancz .
Figure 8: The momentum distribution in the . The dots with error bars
are data, the dark shaded histogram is from mass side band events,
and the light shaded histogram is the Monte Carlo simulated background.
The curve shown in the plot is the best fit of the distribution.
Figure 9: The momentum distribution in .
With a similar analysis using the BESII 58 million events, we also measured the branching ratio of . The momentum distribution in decays is shown in Figure
9. The preliminary branching ratio of is . This result is significantly larger than the world average
of PDG . Using the branching
ratio of , and considering the common
errors which cancel out in the calculation of the ratio of the two
branching ratios, one obtains
(1)
This number deviates from the pQCD predicted ”12% rule” by more than
four sigma. Most interesting is that this channel is
enhanced in decays, while in almost all other channels
which deviate from the ”12% rule”, decays are suppressed.
These results are preliminary. More detail may be found in
Refs. psipkskl and jpsikskl .
6 Search for non- decay to
The resonance is believed to be a mixture of
and states of the system Rapidis . Since
its mass is above open charm-pair threshold and its width is two
orders of the magnitude larger than that of the , it is
thought to decay almost entirely to pure
Bacino . However, recently some theoretical calculations point
out that could decay to non- final states
Lipkin .
Here, we report evidence for based on of data taken in the
cm energy region around 3.773 GeV with BESII. Another
source of is from the radiative return process (due
to initial state radiation (ISR)) to the followed by . We developed a new generator isrpsi which
includes production of , and other resonances due
to radiative return. The Monte Carlo simulation includes
leading-log-order radiative return, where the cm energies after ISR
are generated according to Ref. Kuraev .
To search for the decay of
and or ,
and candidate events are selected. They are
required to have four charged tracks with zero total charge.
Figure 10: Scatter plot of the measured
energies versus the fitted masses. There are two clusters.
The cluster whose energy is around 0.65 GeV is mostly composed of
signal events from , while the
events whose energies are around 0.57 GeV are due to radiative return
events. The projections are shown in the middle and bottom plots.
The open circles are data, the histograms are the results of
the Monte Carlo simulation for ,
and the solid smooth curve is the fit to the data.
Figure 10 shows a scatter plot of the
energies versus the fitted masses of the after a four
constraint fit to the process . In the middle sub-figure, the higher mass peak is
due to radiative return to the followed by . This peak is shifted to 3.18 GeV because is
set to 3.773GeV in the kinematic fitting. The fit to this peak yields
a total of background events near the signal peak at
3.097 GeV, out of the events. After background
subtraction, signal events remain. The branching fraction
for the non- decay
is measured to be
(2)
where the first error is statistical and the second systematic. Using
the total width of the resonance from the PDG PDG , this
branching
ratio corresponds to a partial width of
(3)
More detail may be found in Ref. gongr . These results are preliminary.
References
(1) J. Z. Bai et al., (BES Collab.), Nuc. Inst. Meth. A344, 319 (1994).
(2) J. Z. Bai et al., (BES Collab.), Nuc. Inst. Meth. A458, 627 (2001).
(3) A. Antonelli et al., Nucl. Phys.
B517, 3 (1998).
(4) G. Bardin et al., Nucl. Phys. B411, 3 (1994).
(5) J. Z. Bai et al., (BES Collab.), Phys. Rev. Lett. 91,
022001 (2003).
(6) K. Hagiwara et al., Phys. Rev. D66, 010001 (2002).
(7) J. Z. Bai et al., (BES Collab.), Phys. Rev. D60,
72001 (1999).
(8) J.Z. Bai et al., (BES Collab.), Phys. Rev. D 62,
72001 (2000).
(9) J.Z. Bai et al., (BES Collab.),
Phys. Lett. B555, 174 (2003).
(10) H.-C Huang et al. (Belle Collaboration), hep-ex/0305068.
(11) D. Bisello et al. (DM2 Collaboration), Nucl. Phys. B350, 1 (1991).
(12) J. Z. Bai et al., (BES Collab.), submitted to
Phys. Lett. B, hep-ex/0308073 (2003).
(13) See, for example G.T. Bodwin,
E. Braaten and G.P. Lepage,
Phys. Rev. D51, 1125 (1995);
Han-Wen Huang and Kuang-Ta Chao,
Phys. Rev. D54, 6850 (1996);
J. Bolz, P. Kroll and G. A. Schuler,
Phys. Lett. B392, 198 (1997).
(14) J. Z. Bai et al. (BES Collab.),
Phys. Rev. Lett. 81, 3091 (1998).
(15) S. M. Wong, Eur. Phys. J. C14, 643 (2000).
(16) J.Z. Bai et al., (BES Collab.),
Phys. Rev. D67, 112001 (2003).
(17) J. Z. Bai, et al. (BES Collab.) Phys. Rev. D67, 052002 (2003).
(18) C.Z. Yuan, P. Wang and X.H. Mo, Phys. Lett. B567, 73 (2003).
(19) J. Z. Bai et al., (BES Collab.), submitted to
Phys. Rev. Lett., hep-ex/0310024 (2003).
(20) J. Z. Bai et al., (BES Collab.), submitted to
Phys. Rev. D, hep-ex/0310023 (2003).
(21) P.A. Rapidis et al.(MARK-I Collaboration), Phys. Rev. Lett. 39, (1978) 526.
(22) W. Bacino et al., Phys. Rev. Lett. 40,
671 (1978).