QCD@Work 2003 - International Workshop on QCD, Conversano, Italy,
14–18 June 2003
Scalar mesons and at KLOE
The KLOE collaboration
Presented by Claudio Gatti
The KLOE collaboration:
A. Aloisio, F. Ambrosino, A. Antonelli,
M. Antonelli, C. Bacci, G. Bencivenni, S. Bertolucci, C. Bini,
C. Bloise, V. Bocci, F. Bossi, P. Branchini, S. A. Bulychjov,
R. Caloi, P. Campana, G. Capon, T. Capussela, G. Carboni,
G. Cataldi, F. Ceradini, F. Cervelli, F. Cevenini, G. Chiefari,
P. Ciambrone, S. Conetti, E. De Lucia, P. De Simone, G. De Zorzi,
S. Dell’Agnello, A. Denig, A. Di Domenico, C. Di Donato,
S. Di Falco, B. Di Micco, A. Doria, M. Dreucci, O. Erriquez,
A. Farilla, G. Felici, A. Ferrari, M. L. Ferrer, G. Finocchiaro,
C. Forti, A. Franceschi, P. Franzini, C. Gatti, P. Gauzzi,
S. Giovannella, E. Gorini, E. Graziani, M. Incagli, W. Kluge,
V. Kulikov, F. Lacava, G. Lanfranchi, J. Lee-Franzini, D. Leone,
F. Lu, M. Martemianov, M. Matsyuk, W. Mei, L. Merola, R. Messi,
S. Miscetti, M. Moulson, S. Müller, F. Murtas, M. Napolitano,
A. Nedosekin, F. Nguyen, M. Palutan, E. Pasqualucci, L. Passalacqua,
A. Passeri, V. Patera, F. Perfetto, E. Petrolo, L. Pontecorvo,
M. Primavera, F. Ruggieri, P. Santangelo, E. Santovetti, G. Saracino,
R. D. Schamberger, B. Sciascia, A. Sciubba, F. Scuri, I. Sfiligoi,
A. Sibidanov, T. Spadaro, E. Spiriti, M. Testa, L. Tortora,
P. Valente, B. Valeriani, G. Venanzoni, S. Veneziano, A. Ventura,
S. Ventura, R. Versaci, I. Villella, G. Xu
Dipartimento di Fisica, Università di Roma “La Sapienza”
and INFN Sezione di Roma, Italy
Abstract
The KLOE measurements of radiative decays and of
the ratio
are discussed. The first measurement aims at understanding the real nature of
the scalar mesons and , whose possible compositions are
, , or molecule. The second measurement
is related to the estimate of the phase shift difference
. Previous measurements were affected
by a large uncertainty due to the presence of radiative effects which are
correctly included in our analysis.
1 The KLOE experiment
The KLOE experiment collects data at DANE, an
with center of mass energy
corresponding to the meson mass.
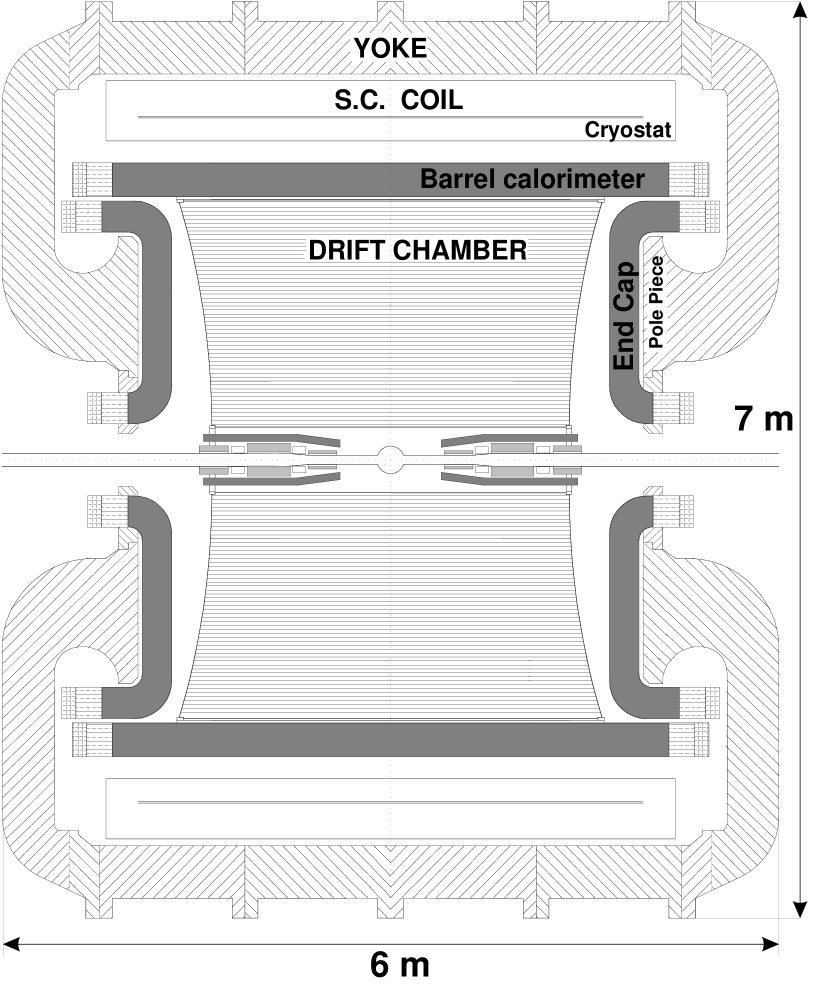
The detector consists of a large drift chamber surrounded by an
electromagnetic calorimeter, both embedded in
a magnetic field of (Fig. 1).
Figure 1: Section of the KLOE detector.
The drift chamber [1] is a cylinder 4 m in diameter
and 3.3 m in length, with a stereo write-geometry for the reconstruction of the
longitudinal coordinate. The momentum resolution for particles with
is .
The calorimeter [2] is a lead/scintillating-fiber
sampling calorimeter,
composed of a barrel and two end-caps. The energy resolution is
. The intrinsic time resolution is
.
KLOE collected in three years of data taking.
During the year 2002 DANE reached a maximum luminosity of
.
2 Scalar mesons
SU(3) flavor symmetry has been very useful in classifying mesons and
baryons. Both the pseudoscalar () and vector
mesons () clearly show the nonet structure
expected for states, with masses following expectation.
The same is not true for scalar mesons ().
In fact, instead of the expected
9 particles, 15 scalar mesons are observed below 2 GeV as listed
by the Particle Data Group [3], with masses not in accord
with the model.
The excess of particles can
be explained by introducing non-conventional mesons such as
glue balls, multi-quark states, or mesonic molecules.
Two possible non-conventional scalar mesons are the isoscalar
and the isovector .
These particles can be studied in the radiative decays
and .
The branching ratios for these processes strongly
depend on the meson compositions:
for conventional mesons;
for mesons;
for molecules.
The decays and
contribute to the radiative decays
and , respectively.
However, other contributions to these decays come from
with the decaying to
and , and from
.
The and contributions are therefore extracted by
fitting the and mass spectra.
The branching ratios and mass spectra (Figs. 2 and 3)
for the decays [4]
and [5]
have been measured by the KLOE collaboration using data
collected in the year 2000 corresponding to an integrated luminosity of
( mesons).
The mass spectra have been fitted using a
theoretical framework mainly due to Achasov and
co-workers [6] [7] [8]. However,
there is no general agreement on the fit method.
Several other authors have analyzed the KLOE data using alternative
fits [9] [10] [11].
Figure 2: Mass spectra for decays.
The fit is superimposed together with individual contributions.
Figure 3: Mass spectra for decays:
comparison of data (points) and fit (histogram) for (a)
5 final state and (b) final state.
In (c) is shown the theoretical contribution of the as extracted
from the fit.
2.1 Event selection
events are selected first of all
by looking for five photons with total energy close to the mass
and total momentum close to zero. Specifically,
we require 5 clusters in the calorimeter with a time compatible
with the photon hypothesis, with total energy
and total momentum .
Sources of background for this decay are
,
, and
decays with
signal-to-background ratios of 0.8, 3.52, and 0.027,
respectively. Energy and momentum conservation for the five photons
are imposed in a kinematic fit in which photons
coming from a are paired. The correct pairing is obtained in
of the time. Events with a invariant mass
consistent with the mass are identified as events
and rejected. Data and Monte Carlo (MC) distributions are compared and good
agreement is found. The background contribution, which is obtained
from MC simulation, is then subtracted from the
3102 selected events.
events remain. The signal acceptance
is obtained using MC simulation and data control samples
such as events. A systematic
uncertainty of has been estimated. The measured branching ratio is:
(1)
The mass spectrum is fitted by combining experimental
effects, such as mass resolution and wrong pairing, with the theoretical
function. The ratio between the function with and without experimental
effects folded in is used to
correct the mass spectrum.
The purely theoretical spectrum is shown in Fig. 2.
Two different final states are selected for
decays: and .
The main background processes for the final state are
,
, and
with and .
For decays there is no background
with the same final state, so only decays with similar topologies
but larger branching ratio contribute. These are
,
, and
decays with kaons decaying into both charged and neutral pions
close to the interaction point (IP).
events are selected as in the previous analysis
by requiring 5 photon clusters and constraining energy-momentum conservation
with a kinematic fit. Events with a invariant mass close to
the mass are retained. Events with a photon with energy greater than
MeV are identified as and rejected.
invariant masses are used to pair photons from
’s and ’s. and events are rejected
using the and invariant masses obtained by pairing
the photons in the two different hypotheses. The final sample consists
of 916 events. The average acceptance is .
The number of background events as estimated from MC
simulation is .
events are selected by requiring two tracks
of opposite charge connected to a vertex at the IP and 5
photon clusters. A kinematic fit is then performed imposing energy-momentum
conservation and the and mass constraints.
197 events are found with about 10 background events. The acceptance
() obtained from MC has been corrected using
data sample to obtain tracking efficiency, and
a sample to obtain cluster efficiency.
For the branching ratio, we obtain
from the final state:
According to the results of the fits to the
and events, the and the give
the dominant contributions to these decays, and the branching ratios
are and
for and decays,
respectively. According to the predictions given in the previous section
for various meson compositions, the is likely to be a
state, while the value obtained for the doesn’t distinguish between
2- and 4-quark states.
3
and
Assuming that electromagnetic interactions can be neglected,
the amplitudes for decays can be written as:
(4)
where are the amplitudes to states with
isospin 0 and 2 respectively.
Unitarity and CPT-invariance requires inclusion
of the S-wave scattering phases [12]
in Eq. (4).
However, the value extracted from the previously measured
branching ratios of kaon decays
does not agree with the values obtained from
scattering. For instance, the most recent evaluations are
[13] and
[14].
This disagreement is ascribed to two effects [15] [16].
The first is the presence of isospin breaking effects
such as electromagnetic interactions. In presence of these effects
the isospin amplitudes become [16]:
(5)
Hence, the phase shift measured from kaon decays using Eq. (4),
,
differs from the phase shift difference by a factor :
(6)
An estimate of this difference is [16].
The second is the uncertainty on what portion of
the decay is included in the
branching ratio. The last measurement of
ratio was performed in 1976 with a 4.3% accuracy [17] and
there is no information on the procedure used to handle the radiated
photon. This uncertainty lead to a large error on the
estimate of .
The KLOE collaboration measured this ratio using an integrated
luminosity of collected during the year 2000.
The KLOE measurement fully includes
radiative decays [18].
3.1 Event selection
The decays of the time into .
The decay occurs nearly at rest and the two kaons are collinear.
Since the initial state is , the final state
is always . This peculiarity allows us to select
a pure beam by identifying a inside the
detector (-tagging).
While the has a decay length
and decays close to the IP, the
decay length is . Hence about
of the reach the calorimeter before decaying.
The interaction in the calorimeter () is
identified by requiring a cluster not associated to any track,
with energy above 200 MeV, and velocity obtained by time-of-flight
compatible with the kaon velocity .
The is used to tag the .
The correct measurement of the velocity () requires
the subtraction of the initial time of the event from
the cluster times. Due to the small bunch crossing period,
, the in KLOE has to be determined event by event.
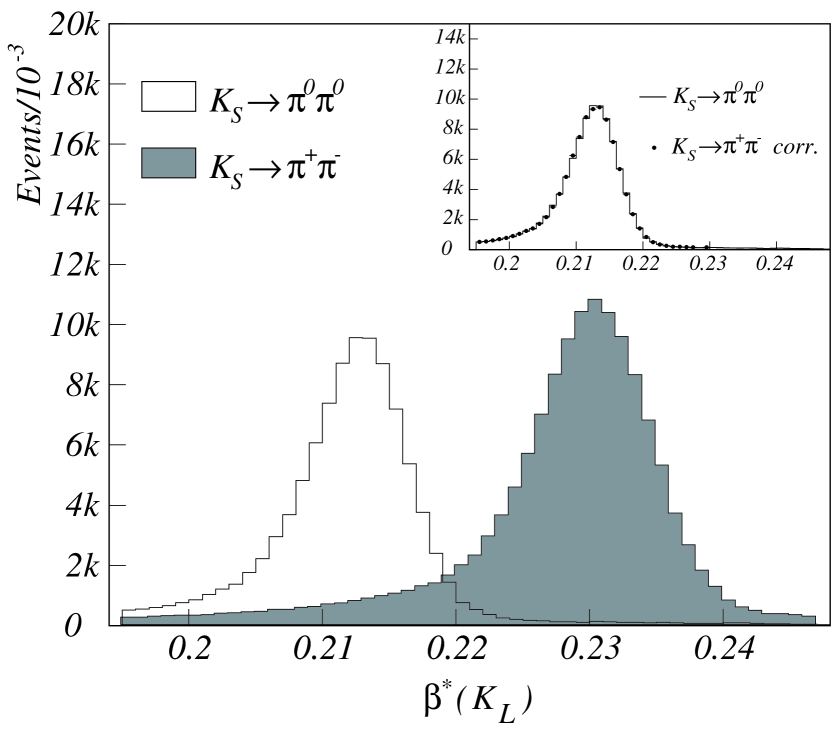
A first estimate is obtained by assuming that the
first cluster to arrive, with and
distance to the beam line is due to
a photon. This assumption, which is correct for
but not for , leads to a different
distribution for the two decay modes as shown in Fig. 4.
Therefore, different tagging efficiencies are obtained if
cluster is selected
by requiring .
The correction is obtained by measuring
the -corrected distribution for
from a control sample and comparing it with the uncorrected distribution.
Figure 4: Distribution of the velocity
in the rest frame measured from clusters, for
decays (empty histogram) and
decays (shaded histogram). In the inset,
the distribution for decays (dots), corrected for
the wrong determination, is compared with that for
.
events are selected by requiring at least 3
photons defined as clusters not associated to any track
with . The background is rejected
by cutting on energy and polar angle:
and . The distribution of the number of
clusters in is shown in Tab. 1.
Almost 90% of the events are retained.
The effects of cluster splitting and accidental
clusters are reduced by an order of magnitude by these cuts.
The photon detection efficiency is measured from
samples and used to correct
the MC simulation.
Table 1: Distribution of the number of clusters in events.
N. clusters
%
2
1.3
2
8.6
3
33.2
4
56.6
4
0.3
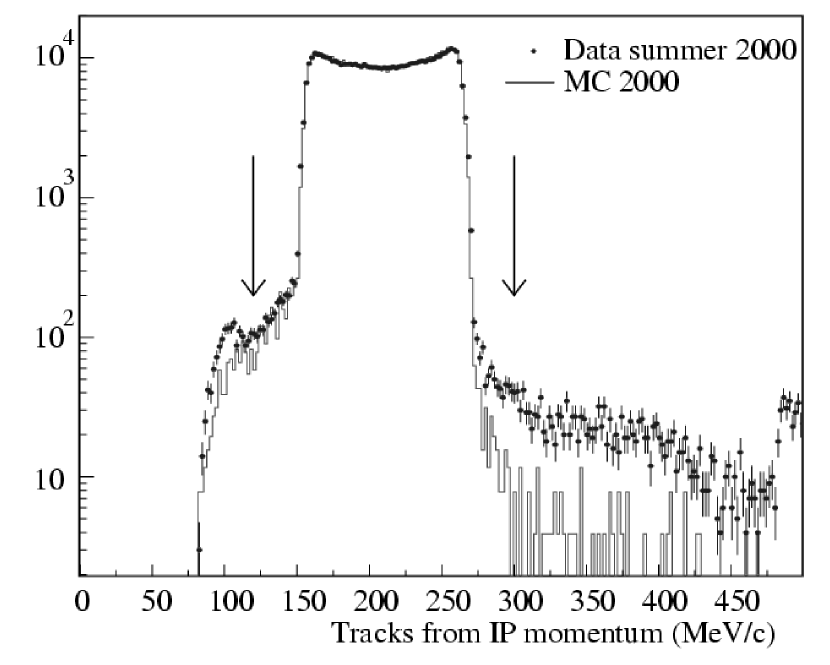
events are selected by requiring
the presence of two tracks of opposite charge coming
from the IP that reach the calorimeter.
The momentum distribution for charged
tracks in tagged events is shown in Fig. 5.
A peak due to charged kaons is visible at 100 MeV in the data (dots)
as well as a long tail at higher momentum due to residual background.
These events are rejected by requiring .
Figure 5: Momentum distribution for tracks in tagged events.
Data (dots) and MC (histogram). The arrows show the cut applied.
The efficiency for reconstructing a track is measured from
a control sample of decays and then combined
with the MC simulation. The overall acceptance is obtained
from MC taking the radiated photon into account. The acceptance
is shown in Fig. 6 as a function of the photon
energy. The value for is obtained from
simulation, and for
from simulation. The acceptance
in the region is obtained by
linear interpolation.
The decrease in acceptance is due to the requirement
that both pions reach the calorimeter.
For high values of the photon energy the
probability for both pions to reach the calorimeter is low.
The overall acceptance is obtained
by folding this efficiency with the photon spectrum from [16].
The inclusion of the radiated photon leads to a correction
of .
Figure 6: Acceptance for
events as a function of the energy of the radiated photon,
obtained from MC simulation ()
and from MC simulation
().
In the data collected during the year 2000 we identify
1,060,821 and
766,308 events.
The ratio of the branching ratios is obtained by correcting
the ratio of these numbers with the acceptance and
the tagging efficiencies.
The result is:
(7)
This value is higher than the world average, , as we
expect due to the inclusion of all the radiative decays.
The error, , is dominated by
systematics. The statistical error is already
at the level. The main contribution to the systematic
error comes from the correction for the different tagging
efficiencies. The cut on was loosened
in the year 2001 in order to reduce the contribution from
this correction.
Using this new value, the phase shift
is found to be:
(8)
which is now in agreement with the values extracted
from scattering. The contribution of the electromagnetic
interactions can be estimated from the difference between
and .
For instance, using the value in [13]:
(9)
4 Conclusion and perspectives
With the data collected during the year 2000,
the KLOE collaboration has improved the previous existing
measurements of branching ratios and mass spectra
for radiative decays and the ratio
.
After two more years of data taking, the total integrated luminosity
has increased by a factor of , allowing new and more
precise measurements.
Preliminary results on radiative decays are in agreement
with the previous ones. New analyses are also underway in order
to study the Dalitz plot for
decays and the branching ratio
and mass spectrum for decays
in order to look for the intermediate state.
The ratio
has a statistical error which is already at per-mil level while
the systematic error is .
However, the higher statistics, together with the looser cut on the
distribution should allow us to reduce
the systematic error.
With the expected fractional error, we can measure
with an error of .
Finally we are also planning to measure the energy distribution
of the radiated photon.
References
[1]
M. Adinolfi et al. [KLOE Collaboration],
Nucl. Inst. Meth. A 488 (2002) 1.
[2]
M. Adinolfi et al. [KLOE Collaboration],
Nucl. Inst. Meth. A 482 (2002) 363.
[3]
K. Hagiwara et al. [Particle Data Group Collaboration],
Phys. Rev. D 66 (2002) 010001.
[4]
A. Aloisio et al. [KLOE Collaboration],
Phys. Lett. B 537 (2002) 21.
[5]
A. Aloisio et al. [KLOE Collaboration],
Phys. Lett. B 536 (2002) 209.
[6]
N.N. Achasov and V.N. Ivanchenko,
Nucl. Phys. B 315 (1989) 465.
[7]
N.N. Achasov and V.V. Gubin,
Phys. Rev. D 56 (1997) 4084.
[8]
N.N. Achasov and V.V. Gubin,
Phys. Rev. D 63 (2001) 094007.
[9]
N.N. Achasov and A.V. Kiselev,
hep-ph/0212153v1 11 Dec 2002.
[10]
M. Boglione and M.R. Pennigton,
hep-ph/0303200v1 24 Mar 2003.
[11]
J.A. Oller,
hep-ph/0205121 v3 11 Nov 2002.
[12]
E. de Rafael,
hep-ph/9502254 v1 8 Feb 1995.
[13]
G. Colangelo,J. Gasser and H. Leutwyler,
hep-ph/0103088 v1 8 Mar 2001.