SLAC–PUB–9949
October 2003
Production of , , , , p and in Light (), and Jets from Decays***Work supported by Department of Energy contracts: DE-FG02-91ER40676, DE-FG03-91ER40618, DE-FG03-92ER40689, DE-FG03-93ER40788, DE-FG02-91ER40672, DE-FG02-91ER40677, DE-AC03- 76SF00098, DE-FG02-92ER40715, DE-FC02-94ER40818, DE-FG03-96ER40969, DE-AC03-76SF00515, DE-FG05-91ER40627, DE-FG02-95ER40896, DE-FG02-92ER40704; National Science Foundation grants: PHY-91-13428, PHY-89-21320, PHY-92-04239, PHY-95-10439, PHY-88-19316, PHY-92-03212; The UK Particle Physics and Astronomy Research Council; The Istituto Nazionale di Fisica Nucleare of Italy; The Japan-US Cooperative Research Project on High Energy Physics; The Korea Science and Engineering Foundation.
The SLD Collaboration∗∗
Stanford Linear Accelerator Center,
Stanford University, Stanford, CA 94309
Abstract
We present improved measurements of the differential production rates of stable charged particles in hadronic decays, and of charged pions, kaons and protons identified over a wide momentum range using the SLD Cherenkov Ring Imaging Detector. In addition to flavor-inclusive decays, measurements are made for decays into light (, , ), and primary flavors, selected using the upgraded Vertex Detector. Large differences between the flavors are observed that are qualitatively consistent with expectations based upon previously measured production and decay properties of heavy hadrons. These results are used to test the predictions of QCD in the Modified Leading Logarithm Approximation, with the ansatz of Local Parton-Hadron Duality, and the predictions of three models of the hadronization process. The light-flavor results provide improved tests of these predictions, as they do not include the contribution of heavy-hadron production and decay; the heavy-flavor results provide complementary model tests. In addition we have compared hadron and antihadron production in light quark (as opposed to antiquark) jets. Differences are observed at high momentum for all three charged hadron species, providing direct probes of leading particle effects, and stringent constraints on models.
Submitted to Physical Review D
1 Introduction
The production of jets of hadrons from hard partons produced in high energy collisions is understood qualitatively in terms of three stages. Considering the process , the first stage, “fragmentation”, involves the radiation of gluons from the primary quark and antiquark, which in turn may radiate gluons or split into pairs until their virtuality approaches the hadron mass scale. This process is in principle calculable in perturbative QCD, and three approaches have been taken so far: i) differential cross sections have been calculated [1] for the production of up to 4 partons to second order in the strong coupling , and leading order calculations have been performed recently for as many as 6 partons (see e.g. [2]); ii) certain parton distributions have been calculated to all orders in in the Modified Leading Logarithm Approximation (MLLA) [3]; iii) “parton shower” calculations [4] have been implemented in Monte Carlo simulations that consist of an arbitrary number of , and branchings, with each branching probability determined from QCD at up to next-to-leading logarithmic order.
In the second stage these partons transform into “primary” hadrons. This “hadronization” process is not understood quantitatively and there are few theoretical predictions for light hadrons, i.e. those that do not contain a or quark. One approach is to make the ansatz of local parton-hadron duality (LPHD) [3], that inclusive distributions of primary hadrons are the same, up to a normalization factor, as those for partons. Calculations using MLLA QCD, cut off at a virtual parton mass comparable with the mass of the hadron in question, have been used in combination with LPHD to predict properties of the distribution of , where and are the hadron momentum and the energy, respectively, in the center of mass frame. For a given primary hadron species: the shape should be described well by a Gaussian function within about one unit of the peak position; a wider range should be described with the addition of small distortion terms; and the peak position should depend inversely on the hadron mass and logarithmically on . At sufficiently high , perturbative QCD has also been used to calculate the dependence of the distributions [5]. It is desirable to test these predictions experimentally and to encourage deeper theoretical understanding of the hadronization process.
In the third stage unstable primary hadrons decay into the stable particles that traverse particle detectors. This stage is understood inasmuch as proper lifetimes and decay branching ratios have been measured for many hadron species. However, these decays complicate fundamental hadronization measurements because many of the stable particles are decay products rather than primary hadrons, and it is typically not possible to determine whether a given detected hadron is primary. Previous measurements at colliders (see e.g. [6, 7]) indicate that decays of vector mesons, strange baryons and decuplet baryons produce roughly two-thirds of the stable particles; scalar and tensor mesons, and radially excited baryons have also been observed [7], which contribute additional secondaries. Ideally one would measure every possible hadron species and distinguish primary hadrons from decay products on a statistical basis. A body of knowledge could be assembled by reconstructing heavier and heavier states, and subtracting their known decay products from the measured differential production rates of lighter hadrons. The measurements presented here constitute a first step.
Additional complications arise in jets initiated by heavy quarks, since the leading heavy hadrons carry a large fraction of the beam energy, restricting that available to other primary hadrons, and their decays produce a sizable fraction of the stable particles in the jet. Although the production and decay of some and hadrons, containing a and quark, respectively, have been studied inclusively [8] and the effect of heavy quark masses on the charged multiplicity in their jets has been observed [9, 10], there remain large uncertainties in, e.g., and heavy baryon decays, and heavy quark masses. The removal of heavy flavor events will therefore allow the direct study of the hadronization of light quark jets, and measurements of and jets may shed additional light on some of the above issues.
A particularly interesting aspect of light quark hadronization is the question of what happens to the quark or antiquark that initiated a given jet. Recent experimental results [11, 12, 13] have confirmed the notion that it is “contained” as a valence constituent of a particular hadron, and that this “leading” hadron has on average a higher momentum than the other hadrons of the same type in the jet. More precise measurements of such leading particle effects could lead to methods for identifying jets of a specific light primary flavor, with a number of applications in and hadron-hadron collisions as well as in annihilations.
There are several phenomenological models of jet production that combine modelling of all three stages of particle production and it is important to test their predictions. To model the parton production stage the HERWIG 5.8 [14], JETSET 7.4 [15] and UCLA 4.1 [16] event generators use a combination of first order matrix elements and a parton shower. To model the hadronization stage, the HERWIG model splits the gluons produced in the first stage into pairs, and these quarks and antiquarks are paired up locally to form colorless clusters that decay into the primary hadrons. The JETSET model takes a different approach, representing the color field between the partons by a semi-classical string; this string is broken, according to an iterative algorithm, into several pieces, each of which corresponds to a primary hadron. In the UCLA model whole events are generated according to weights derived from the phase space available to their final states and the relevant Clebsch-Gordan coefficients. Each of these models contains arbitrary parameters that control various aspects of hadronization and have been tuned to reproduce data from annihilations. The JETSET model includes a large number of parameters that control, on average, the species of primary hadron produced at each string break, giving it the potential to model the observed properties of identified hadron species in great detail. In the HERWIG model, clusters are decayed into pairs of primary hadrons according to phase space, and the relative production of different hadrons is effectively governed by two parameters that control the distribution of cluster masses. In the UCLA model, there is only one such free parameter, which controls the degree of locality of baryon-antibaryon pair formation.
In this paper we present an analysis of inclusive charged particle and identified , , and p/ production in hadronic decays collected by the SLC Large Detector (SLD). The analysis is based upon the approximately 400,000 hadronic events obtained in runs of the SLC between 1996 and 1998, and supersedes our previous measurements [12]. We measure differential production rates for these hadron species in a flavor-inclusive sample of hadronic decays and use the results to test the predictions of MLLA QCDLPHD and of the three models just described. We also measure these differential production rates separately in decays into light flavors (, and ), and , which provide improved tests of the QCD predictions and new tests of the models that separate the heavy hadron production and decay modelling from that of the rest of the hadronization process. In addition we measure hadron and antihadron differential production rates in light quark jets, thereby obtaining precise information on leading particles and additional stringent tests of the models.
In section 2 we describe the SLD, in particular its precision vertexing and particle identification capabilities. Section 3 describes the selection of hadronic events, their separation into samples of different primary flavors using displaced vertices from heavy hadron decays, and the selection of light quark and antiquark hemispheres using the large production asymmetry in polar angle induced by the polarization of the SLC electron beam. In section 4 we present a measurement of the inclusive stable charged particle production rate. We describe the hadron species identification and present results for flavor-inclusive events in section 5, and section 6 presents results separately for light- (), - () and -flavor () events. In sections 7 and 8 we use these results to test the predictions of MLLA QCDLPHD, and extract total yields of each hadron species per event of each flavor, respectively. We present measurements of leading particle production in light-flavor jets in section 9, and summarize the results in section 10.
2 The SLD
This analysis of data from the SLD [17] used charged tracks measured in the Central Drift Chamber (CDC) [18] and upgraded CCD Vertex Detector (VXD3) [19], and identified in the Cherenkov Ring Imaging Detector (CRID) [12, 20]. Energy deposits reconstructed in the Liquid Argon Calorimeter (LAC) [21] were used in the initial hadronic event selection and in the calculation of the event thrust [22] axis. Momentum measurement was provided by an axial magnetic field of 0.6T. The CDC and VXD3 gave a momentum resolution of = , where is the track momentum transverse to the beam axis in GeV/.
In the plane normal to the beamline the centroid of the micron-sized SLC interaction region was reconstructed from tracks in sets of approximately thirty sequential hadronic decays to a precision of 3 m and used as an estimate of the primary interaction point (IP). The IP position along the beam axis was determined event by event using charged tracks, with an average resolution of 20 m. Including the uncertainty on the IP position, the resolution on the charged track impact parameter was parametrized in the plane perpendicular to the beamline as 829/ m, and in any plane containing the beam axis as 929/ m, where is the track polar angle with respect to the beamline.
The barrel CRID covered the polar angle range , and comprised liquid and gaseous radiator systems with refractive indices of 1.278 and 1.00176, respectively. In the high momentum limit, an average of 13 (10) Cherenkov photons was reconstructed per track traversing the liquid (gas) system, with an average Cherenkov angle resolution of 15 (4.3) mrad. The combination of these systems gave efficient and pure separation of pions, kaons and protons over much of the kinematic range, as detailed in section 5.
3 Event Selection
The trigger and initial selection of hadronic events are described in [23]. The analysis presented here is based on charged tracks measured in the CDC and VXD3. A set of cuts was applied in order to select charged tracks and events well-contained within the detector acceptance. Tracks were required to have: (i) a closest approach to the beam axis within 5 cm, and within 10 cm along the beam axis of the measured IP; (ii) a polar angle with respect to the beam axis with 0.80; (iii) a momentum transverse to this axis 150 MeV/; and (iv) a momentum 50 GeV/c. Events were required to have: a minimum of seven such tracks; a visible energy GeV, calculated from the accepted tracks, assigned the charged pion mass; a thrust axis polar angle with respect to the beam axis with 0.71; and the CDC and VXD3 active and a well-measured IP position. A sample of 284,494 events passed these cuts. For the identified hadrons, the CRID was also required to be active, giving a sample of 232,802 events. The non-hadronic background was estimated to be 0.1%, dominated by events.
Samples of events enriched in light, , and primary flavors were selected [24] using tracks with well measured impact parameters. For each event we defined as the number of tracks with an impact parameter greater than three times its estimated error, . We also ran a topological vertex finding algorithm [25] on the set of tracks in each hemisphere and considered the -corrected mass [25] of any secondary vertex (significantly separated from the IP) found. Any event containing a vertex with GeV/c2 was assigned to the -tagged sample. If not -tagged, an event was -tagged if either: it contained a vertex with 0.52 GeV/c2, a total momentum of tracks assigned to the vertex 2 GeV/c and GeV; or it contained no secondary vertex and had . Events with no secondary vertex and were assigned to the light-tagged sample. The remaining events were kept as an untagged sample. The 15% of the data taken in 1996 were excluded due to uncertainties in the simulation, and the light-, - and -tagged samples comprised roughly 83,000, 28,000 and 33,000 events, respectively. Selection efficiencies were calculated from a detailed detector simulation based on a version of JETSET tuned to the world’s data on inclusive particle production and and hadron production and decay [26]; efficiencies and sample purities for the above selection are listed in table 1.
| Efficiency for | Purity of | |||||
|---|---|---|---|---|---|---|
| -tag | 0.703 | 0.190 | 0.010 | 0.925 | 0.070 | 0.005 |
| -tag | 0.061 | 0.551 | 0.105 | 0.204 | 0.638 | 0.158 |
| -tag | 0.001 | 0.024 | 0.815 | 0.005 | 0.023 | 0.973 |
| no-tag | 0.235 | 0.235 | 0.070 | 0.721 | 0.201 | 0.078 |
Samples of hemispheres enriched in light-quark and light-antiquark jets were selected by exploiting the large electroweak forward-backward production asymmetry with respect to the beam direction induced by the high polarization of the SLC electron beam. Here a looser light-flavor event tag of was applied, giving a simulated efficiency of 84% and purity of 89%, with the background dominated by -flavor events. The event thrust axis was used to approximate the initial axis and was signed such that its -component was along the electron beam direction, . Events in the central region of the detector, where the production asymmetry is small, were removed by the requirement , leaving 109,000 events. The quark-tagged hemisphere in events with left- (right-)handed electron beam polarization was defined to comprise the set of tracks with positive (negative) momentum projection along the signed thrust axis. The remaining tracks in each event were defined to be in the antiquark-tagged hemisphere. For the selected event sample, the average magnitude of the beam polarization was 0.73. Using this value and assuming Standard Model couplings, a tree-level calculation gives a quark (antiquark) purity of 0.73 in the quark-(antiquark-)tagged sample.
4 Stable Charged Particle Rates
We first measured the differential production rate of all stable charged particles defined conventionally as the sum of electrons, muons, pions, kaons and protons that are either primary hadrons or products of a chain of decays of particles with proper lifetime less than 3s. Tracks satisfying the requirements in sec. 3 were counted in momentum bins and corrected, using our detector simulation, for the track finding and selection efficiency and resolution, non-hadronic event background, and spurious tracks from beam-related backgrounds and interactions in the detector material. The resulting integrated rate was constrained to be 20.950.21 charged particles per event, an average of measurements [10, 27, 28] in decays.
The momentum dependence of the selection was constrained by comparing the properties of reconstructed charged tracks in measured and simulated lepton decays, for which the momentum and particle type distributions are well known. We selected events according to the criteria in [29], with the additional requirement of at least one track in the event with 7 GeV/c, to reduce beam-related and two-photon event background. Comparisons were made for 1-, 3-, and 5-prong decays separately, as well as for hemispheres in which 2 or 4 tracks were found, giving constraints on both isolated tracks and those in close proximity to others. We also checked the momentum distributions for tagged electrons, muons, pions, and kaons, and the overall multiplicity distribution in selected -pair events. In all cases the simulation was consistent with the data. Linear fits were made to the ratios of data:simulated tracks, and a momentum-dependent uncertainty of 0.10 GeV/c% was assigned, reflecting the error on a typical fitted slope. Here is the particle momentum in GeV/c and 2.7 GeV/c is the average momentum of all charged particles, so that this uncertainty is independent of the normalization uncertainty noted above. Variations of the background levels, detector material and momentum resolution were also considered and found to have much smaller effects, except at the lowest and highest momenta.
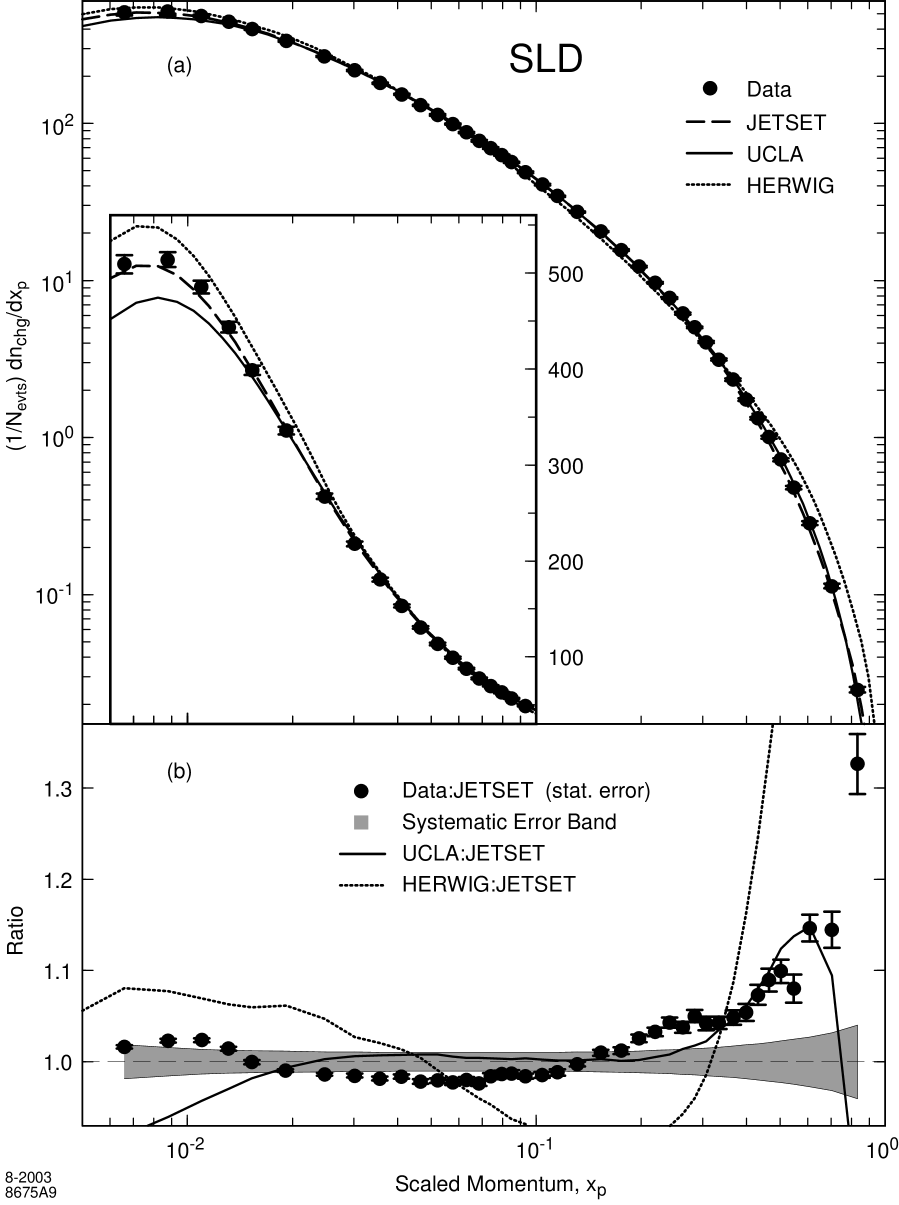
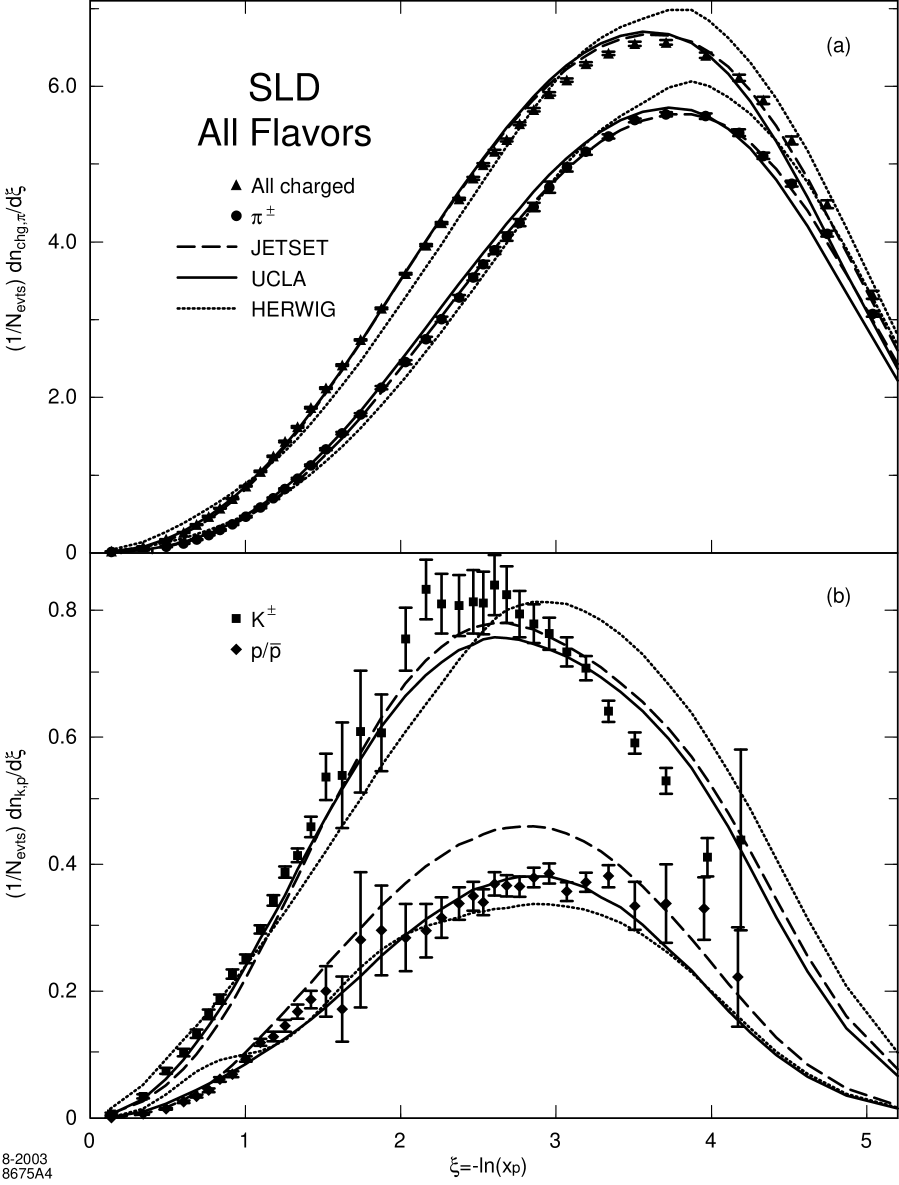
The inclusive charged particle differential production rate is listed in table 2, in terms of the variables momentum , scaled momentum and . The distribution is shown in fig. 1, and compared with the predictions of the JETSET, UCLA and HERWIG event generators described in section 1, using the default parameter values for each model. The JETSET model is the most consistent with the data, but predicts a slightly softer spectrum; the UCLA model describes the data over most of the region, but falls low for 0.7 and 0.015 units; the HERWIG model predicts a spectrum quite different from that seen in the data. Our results for the shape of the spectrum are consistent with those published previously [10, 27, 28].
| Inclusive Stable Charged Particle Production Rate | ||||||||||
| (GeV/c) | stat. | effic. | other | |||||||
| 0.25– | 0.35 | 0.300 | 11.166 | 0.022 | 0.115 | 0.173 | 509.2 | 9.5 | 3.234 | 0.062 |
| 0.35– | 0.45 | 0.400 | 11.271 | 0.022 | 0.116 | 0.128 | 513.9 | 7.8 | 4.399 | 0.068 |
| 0.45– | 0.55 | 0.499 | 10.646 | 0.022 | 0.109 | 0.096 | 485.5 | 6.6 | 5.221 | 0.072 |
| 0.55– | 0.65 | 0.599 | 9.724 | 0.021 | 0.099 | 0.073 | 443.4 | 5.6 | 5.665 | 0.073 |
| 0.65– | 0.75 | 0.699 | 8.744 | 0.020 | 0.089 | 0.057 | 398.7 | 4.9 | 6.110 | 0.075 |
| 0.75– | 1.00 | 0.870 | 7.364 | 0.011 | 0.075 | 0.040 | 335.8 | 3.9 | 6.324 | 0.074 |
| 1.00– | 1.25 | 1.121 | 5.860 | 0.010 | 0.059 | 0.024 | 267.2 | 2.9 | 6.486 | 0.072 |
| 1.25– | 1.50 | 1.371 | 4.775 | 0.009 | 0.048 | 0.015 | 217.8 | 2.3 | 6.465 | 0.070 |
| 1.50– | 1.75 | 1.622 | 3.962 | 0.008 | 0.040 | 0.011 | 180.7 | 1.9 | 6.338 | 0.068 |
| 1.75– | 2.00 | 1.872 | 3.360 | 0.008 | 0.034 | 0.009 | 153.2 | 1.6 | 6.202 | 0.066 |
| 2.00– | 2.25 | 2.122 | 2.865 | 0.007 | 0.029 | 0.007 | 130.6 | 1.4 | 5.990 | 0.063 |
| 2.25– | 2.50 | 2.375 | 2.488 | 0.007 | 0.025 | 0.005 | 113.4 | 1.2 | 5.807 | 0.062 |
| 2.50– | 2.75 | 2.625 | 2.173 | 0.006 | 0.022 | 0.004 | 99.09 | 1.03 | 5.605 | 0.059 |
| 2.75– | 3.00 | 2.875 | 1.920 | 0.006 | 0.019 | 0.004 | 87.57 | 0.91 | 5.419 | 0.058 |
| 3.00– | 3.25 | 3.125 | 1.701 | 0.005 | 0.017 | 0.003 | 77.56 | 0.81 | 5.214 | 0.056 |
| 3.25– | 3.50 | 3.375 | 1.530 | 0.005 | 0.015 | 0.003 | 69.78 | 0.73 | 5.061 | 0.054 |
| 3.50– | 3.75 | 3.625 | 1.378 | 0.005 | 0.014 | 0.002 | 62.84 | 0.66 | 4.892 | 0.053 |
| 3.75– | 4.00 | 3.875 | 1.244 | 0.005 | 0.013 | 0.002 | 56.72 | 0.60 | 4.713 | 0.051 |
| 4.00– | 4.50 | 4.244 | 1.072 | 0.003 | 0.011 | 0.001 | 48.90 | 0.51 | 4.450 | 0.047 |
| 4.50– | 5.00 | 4.744 | 0.894 | 0.003 | 0.009 | 0.001 | 40.78 | 0.43 | 4.141 | 0.045 |
| 5.00– | 5.50 | 5.244 | 0.754 | 0.003 | 0.008 | 0.001 | 34.39 | 0.37 | 3.856 | 0.042 |
| 5.50– | 6.50 | 5.975 | 0.600 | 0.002 | 0.006 | 0.001 | 27.35 | 0.29 | 3.492 | 0.038 |
| 6.50– | 7.50 | 6.977 | 0.4502 | 0.0014 | 0.0049 | 0.0005 | 20.53 | 0.23 | 3.051 | 0.035 |
| 7.50– | 8.50 | 7.980 | 0.3429 | 0.0012 | 0.0039 | 0.0003 | 15.64 | 0.18 | 2.647 | 0.032 |
| 8.50– | 9.50 | 8.982 | 0.2687 | 0.0011 | 0.0032 | 0.0003 | 12.25 | 0.15 | 2.328 | 0.029 |
| 9.50– | 10.50 | 9.980 | 0.2120 | 0.0010 | 0.0026 | 0.0002 | 9.67 | 0.12 | 2.039 | 0.027 |
| 10.5– | 11.5 | 10.99 | 0.1700 | 0.0009 | 0.0022 | 0.0002 | 7.75 | 0.11 | 1.792 | 0.025 |
| 11.5– | 12.5 | 11.99 | 0.1351 | 0.0008 | 0.0018 | 0.0001 | 6.161 | 0.088 | 1.551 | 0.023 |
| 12.5– | 13.5 | 12.99 | 0.1103 | 0.0007 | 0.0016 | 0.0001 | 5.029 | 0.076 | 1.368 | 0.022 |
| 13.5– | 14.5 | 13.99 | 0.0889 | 0.0006 | 0.0013 | 0.0001 | 4.053 | 0.065 | 1.184 | 0.020 |
| 14.5– | 16.0 | 15.22 | 0.0688 | 0.0005 | 0.0011 | 0.0001 | 3.139 | 0.052 | 0.997 | 0.017 |
| 16.0– | 17.5 | 16.72 | 0.0513 | 0.0004 | 0.0009 | 0.0001 | 2.338 | 0.042 | 0.812 | 0.016 |
| 17.5– | 19.0 | 18.23 | 0.0383 | 0.0003 | 0.0007 | 0.0001 | 1.748 | 0.034 | 0.661 | 0.014 |
| 19.0– | 20.5 | 19.72 | 0.0291 | 0.0003 | 0.0006 | 0.0001 | 1.326 | 0.028 | 0.544 | 0.012 |
| 20.5– | 22.0 | 21.21 | 0.0221 | 0.0003 | 0.0005 | 0.0001 | 1.008 | 0.023 | 0.444 | 0.011 |
| 22.0– | 24.0 | 22.96 | 0.0159 | 0.0002 | 0.0004 | 0.0001 | 0.724 | 0.018 | 0.3468 | .0090 |
| 24.0– | 26.0 | 24.94 | 0.0105 | 0.0001 | 0.0003 | 0.0001 | 0.480 | 0.013 | 0.2513 | .0073 |
| 26.0– | 30.0 | 27.74 | 0.0063 | 0.0001 | 0.0002 | 0.0001 | 0.285 | 0.009 | 0.1700 | .0056 |
| 30.0– | 35.0 | 32.14 | 0.0025 | 0.0000 | 0.0001 | 0.0001 | 0.114 | 0.005 | 0.0800 | .0035 |
| 35.0– | 45.0 | 38.23 | 0.0005 | 0.0000 | 0.0000 | 0.0001 | 0.024 | 0.001 | 0.0207 | .0013 |
5 Charged Pion, Kaon and Proton Production
Additional track selection cuts [24] were applied to remove tracks that interacted or scattered through large angles before exiting the CRID and to ensure that the CRID performance was well-modelled by the simulation. Good information from the liquid (gas) system was required for tracks in the “liquid” (“gas”) region, with momenta below 2.25 GeV/c (above 10.5 GeV/c); good information from both systems was required for momenta in the “combined” region, 2.25–10.5 GeV/c. Tracks were required to have at least 40 CDC hits, at least one of which was at a radius of at least 92 cm, to extrapolate through an active region of the appropriate radiator(s), and to have at least 40 (70)% of their expected liquid (gas) ring contained within a sensitive region of the CRID TPCs. The latter requirement included dead and inefficient regions within the TPCs and also rejected tracks with GeV/c for which there was a saturated CRID hit within a 2 cm radius (the maximum ring radius) of a point 1 cm behind the expected gas ring center in the photoelectron drift direction. Saturated hits arise from the passage of tracks through the TPCs and from various backgrounds, and mask single photoelectron hits in their vicinity. Liquid region tracks that extrapolated through an active TPC were required to have a saturated hit within 1 cm of the extrapolated track, indicating that the track traversed the TPC and hence the liquid radiator; gas region tracks were required to have either such a saturated hit or the presence of at least four hits consistent with a liquid ring. These cuts accepted 71%, 68% and 74% of the tracks within the CRID geometrical acceptance in the liquid, combined and gas regions, respectively.
Tracks were identified using a global likelihood technique [12, 30]. For each track and each of the five hypotheses , p, a likelihood was calculated based upon: the number of detected photoelectrons and their measured Cherenkov angles; the expected number of photons; the expected Cherenkov angle; and terms accounting for random backgrounds and hits consistent with Cherenkov radiation from other tracks in the event. The best hypothesis for each track was used to determine its contribution to the background for other tracks, and the calculation was iterated until there was no change in any best hypothesis. Particle separation was based upon differences between logarithms of the three likelihoods, , , p. A track in the liquid (combined, gas) region was identified as species if exceeded both of the other log-likelihoods by at least 3 (2) units. The electron and muon likelihoods are generally quite similar to the pion likelihood, and the leptons were included in the pion category at this stage.
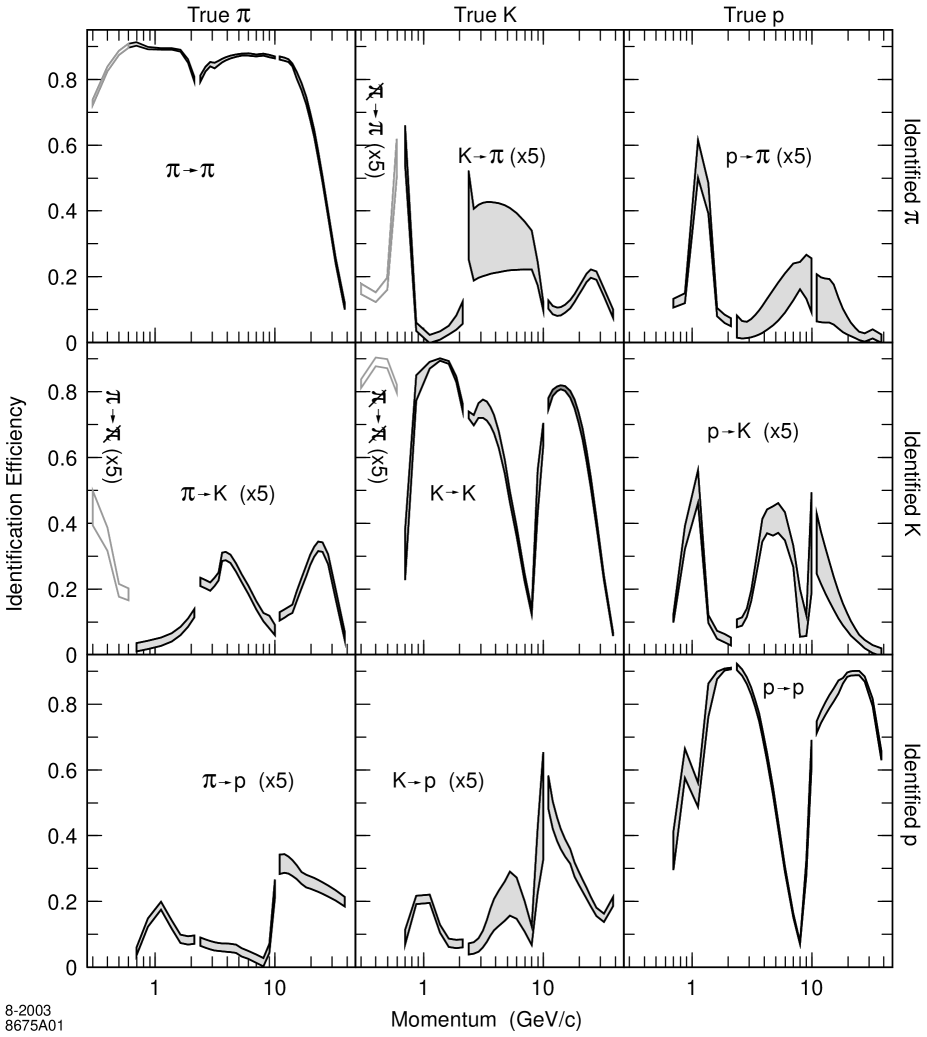
We quantified the identification performance in terms of a momentum-dependent identification efficiency matrix E, each element of which represents the probability that the selected track from a true -hadron is identified as a -hadron, with ,,p. The elements of this matrix were determined where possible from the data [24, 31]. For example, tracks from selected and decays were used as “pion” test samples, having estimated kaon plus proton contents of 0.3% and 1.7% respectively. Probabilities for such tracks to be identified as pions, kaons and protons were compared with the predictions of our detailed MC simulation, which was found to describe the momentum dependence of the efficiencies well and to reproduce their amplitudes to within a few percent. Functional forms, chosen to describe the momentum dependence of both data and simulated test samples as well as that of simulated true pions in hadronic events, were fitted to the data, except for momenta below 0.8 GeV/c where there was significant structure on the scale of the bin size and bin-by-bin corrections were used. The simulation was used to correct the fitted parameters for non-pion content in the test samples and differences in tracking performance between tracks in these samples and those passing our selection cuts in hadronic events. The resulting identification efficiency functions, , and , are shown in the leftmost column of fig. 2. A similar procedure using only and p likelihoods was used to measure the -p separation in the liquid (gas) system for (17) GeV/c. This information was combined with that from test samples of protons and kaons from decays of hyperons and mesons, respectively, to derive the remaining efficiencies in fig. 2.
The bands in fig. 2 encompass the upper and lower systematic error bounds on the efficiencies. There are discontinuities between the liquid, combined and gas regions, and there are strong point-to-point correlations within each region. For the diagonal elements, these errors correspond to those on the fitted parameters, and fall into four categories. The overall amplitude of the efficiency is driven by the average and rms of the number of photons detected per track; the corresponding uncertainty is common to all momenta in a given region and is also correlated between the liquid and combined regions for protons and the combined and gas regions for pions. The Cherenkov angle resolution affects the positions of the falling edges; its uncertainty is therefore correlated across the range of a given edge, as well as between pions and kaons in the regions 1.5–2.25 GeV/c and 12–45 GeV/c, and between kaons and protons in the region 3–8 GeV/c. Performance near a Cherenkov threshold depends on the relevant index of refraction and its stability; since the efficiencies change rapidly on the scale of our bin sizes, bin-by-bin calibrations were done for () in the range 1 GeV/c ( GeV/c), and and in the range 7.510.5 GeV/c, which are completely independent. In the region 10.5–18 GeV/c, protons are below threshold in the gas, whereas pions and kaons are well above threshold; here depends largely on the background level, and its uncertainty is correlated across this region.
For the off-diagonal elements, representing misidentification rates, the errors on fitted parameters were also used, but subject to a minimum value of to account for the limited statistics of the test sample constraints on the momentum dependences. These uncertainties correspond to a combination of the effects listed above for the diagonal elements, and each is typically dominated by one effect in a given momentum region. These errors should also therefore be considered strongly positively correlated across each of the liquid, combined and gas regions.
The identification efficiencies in fig. 2 peak near or above 0.9 and are greater than 0.8 over wide ranges. The pion (kaon and proton) coverage is continuous from 0.25 GeV/c (0.65 GeV/c) up to the beam energy, although the efficiencies fall below 0.2 for pions and kaons above about 30 GeV/c, and kaons and protons in the 6–9 GeV/c range. Misidentification rates are typically at the few percent level, with peak values of up to 0.1.
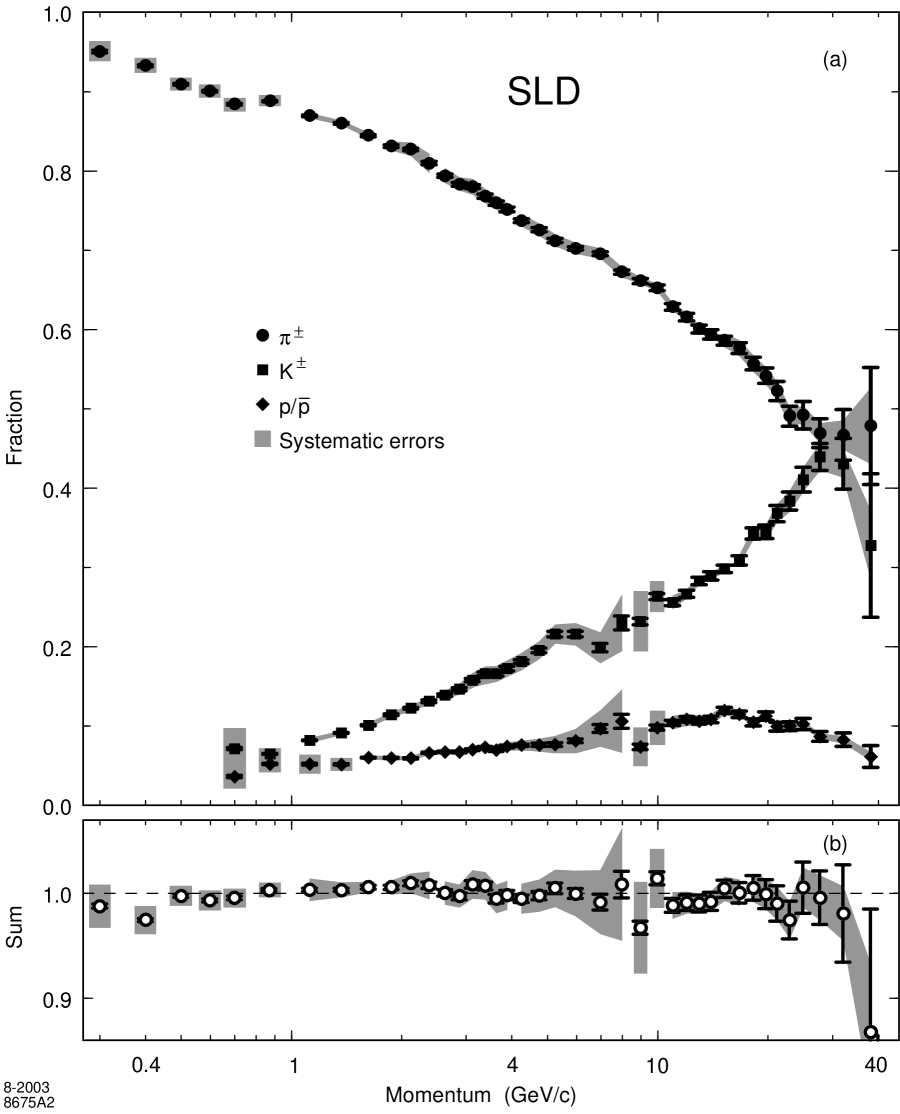
In each momentum bin we measured the fractions of the selected tracks that were identified as pions, kaons and protons. The observed fractions were related to the true production fractions by an efficiency matrix, composed of the values shown in fig. 2. This matrix was inverted and used to unfold our observed identified hadron fractions. This analysis procedure does not require that the sum of the charged hadron fractions be unity; instead the sum was used as a consistency check, which was found to be satisfied at all momenta (see fig. 3). For momenta below 0.65 GeV/c, we could not distinguish kaons from protons, but pions could be identified down to 0.25 GeV/c. An analogous 22 analysis of pions and non-pions was used in this region, and we present only the pion fraction.
The background from electrons and muons was estimated from the simulation to be about 5% of the tracks in the inclusive flavor sample, predominantly from - and -flavor events. The fractions were corrected for the lepton backgrounds using the simulation, as well as for the effects of beam-related backgrounds, particles interacting in the detector material, and particles decaying outside the tracking volume. The conventional definition of a final-state charged hadron was used, namely a charged pion, kaon or proton that is either from the primary interaction or a product of a chain of decays of hadrons each with a proper lifetime less than 3s.
The measured charged hadron fractions in inclusive hadronic decays are shown in fig. 3 and listed in tables 3–5. The systematic errors were determined by propagating the errors on the calibrated efficiency matrix and are strongly correlated as described above. They are indicated by the shaded regions in fig. 3. The errors on the points below 15 GeV/c are dominated by the systematic uncertainties; those above 30 GeV/c are dominated by statistical uncertainties. The sum of fractions is consistent with unity everywhere.
| Range | (1/Nevts) d/d | |||||||
| 0.005– | 0.008 | 0.0066 | 0.951 | 0.002 | 0.010 | 471.8 | 1.3 | 9.2 |
| 0.008– | 0.010 | 0.0088 | 0.933 | 0.001 | 0.007 | 470.4 | 1.1 | 6.6 |
| 0.010– | 0.012 | 0.0109 | 0.910 | 0.001 | 0.006 | 434.6 | 1.1 | 5.0 |
| 0.012– | 0.014 | 0.0131 | 0.901 | 0.001 | 0.006 | 388.8 | 1.0 | 4.0 |
| 0.014– | 0.016 | 0.0153 | 0.885 | 0.001 | 0.006 | 352.7 | 0.9 | 3.3 |
| 0.016– | 0.022 | 0.0191 | 0.888 | 0.001 | 0.004 | 294.8 | 0.5 | 2.2 |
| 0.022– | 0.027 | 0.0246 | 0.870 | 0.001 | 0.003 | 229.6 | 0.5 | 1.3 |
| 0.027– | 0.033 | 0.0301 | 0.860 | 0.001 | 0.003 | 185.0 | 0.4 | 0.9 |
| 0.033– | 0.038 | 0.0356 | 0.845 | 0.001 | 0.003 | 150.6 | 0.4 | 0.7 |
| 0.038– | 0.044 | 0.0411 | 0.831 | 0.002 | 0.005 | 125.6 | 0.4 | 0.9 |
| 0.044– | 0.049 | 0.0465 | 0.828 | 0.002 | 0.008 | 106.5 | 0.4 | 1.1 |
| 0.049– | 0.055 | 0.0521 | 0.810 | 0.002 | 0.012 | 90.40 | 0.35 | 1.33 |
| 0.055– | 0.060 | 0.0576 | 0.794 | 0.002 | 0.009 | 77.38 | 0.31 | 0.91 |
| 0.060– | 0.066 | 0.0630 | 0.784 | 0.002 | 0.008 | 67.39 | 0.29 | 0.70 |
| 0.066– | 0.071 | 0.0685 | 0.780 | 0.002 | 0.010 | 59.40 | 0.27 | 0.75 |
| 0.071– | 0.077 | 0.0740 | 0.768 | 0.003 | 0.009 | 52.57 | 0.25 | 0.60 |
| 0.077– | 0.082 | 0.0795 | 0.760 | 0.003 | 0.008 | 46.76 | 0.24 | 0.50 |
| 0.082– | 0.088 | 0.0850 | 0.752 | 0.003 | 0.008 | 41.70 | 0.23 | 0.43 |
| 0.088– | 0.099 | 0.0931 | 0.738 | 0.002 | 0.007 | 35.26 | 0.15 | 0.36 |
| 0.099– | 0.110 | 0.1040 | 0.726 | 0.002 | 0.007 | 28.89 | 0.13 | 0.29 |
| 0.110– | 0.121 | 0.1150 | 0.712 | 0.003 | 0.007 | 23.88 | 0.12 | 0.25 |
| 0.121– | 0.143 | 0.1310 | 0.702 | 0.002 | 0.007 | 18.69 | 0.08 | 0.19 |
| 0.143– | 0.164 | 0.1530 | 0.696 | 0.002 | 0.006 | 13.85 | 0.07 | 0.14 |
| 0.164– | 0.186 | 0.1750 | 0.673 | 0.003 | 0.006 | 10.16 | 0.06 | 0.11 |
| 0.186– | 0.208 | 0.1970 | 0.662 | 0.003 | 0.004 | 7.812 | 0.050 | 0.069 |
| 0.208– | 0.230 | 0.2189 | 0.653 | 0.004 | 0.004 | 6.076 | 0.044 | 0.061 |
| 0.230– | 0.252 | 0.2410 | 0.629 | 0.004 | 0.005 | 4.674 | 0.039 | 0.053 |
| 0.252– | 0.274 | 0.2629 | 0.616 | 0.005 | 0.005 | 3.632 | 0.035 | 0.044 |
| 0.274– | 0.296 | 0.2849 | 0.601 | 0.005 | 0.004 | 2.886 | 0.031 | 0.037 |
| 0.296– | 0.318 | 0.3068 | 0.594 | 0.006 | 0.004 | 2.292 | 0.028 | 0.031 |
| 0.318– | 0.351 | 0.3338 | 0.586 | 0.006 | 0.009 | 1.749 | 0.021 | 0.034 |
| 0.351– | 0.384 | 0.3666 | 0.577 | 0.007 | 0.010 | 1.275 | 0.018 | 0.028 |
| 0.384– | 0.417 | 0.3997 | 0.557 | 0.008 | 0.010 | 0.921 | 0.016 | 0.022 |
| 0.417– | 0.450 | 0.4325 | 0.542 | 0.010 | 0.010 | 0.680 | 0.014 | 0.018 |
| 0.450– | 0.482 | 0.4651 | 0.523 | 0.012 | 0.011 | 0.499 | 0.013 | 0.014 |
| 0.482– | 0.526 | 0.5035 | 0.491 | 0.013 | 0.010 | 0.338 | 0.010 | 0.010 |
| 0.526– | 0.570 | 0.5470 | 0.492 | 0.018 | 0.011 | 0.226 | 0.009 | 0.007 |
| 0.570– | 0.658 | 0.6083 | 0.469 | 0.018 | 0.012 | 0.130 | 0.005 | 0.005 |
| 0.658– | 0.768 | 0.7047 | 0.467 | 0.032 | 0.018 | 0.0526 | 0.0037 | 0.0029 |
| 0.768– | 1.000 | 0.8383 | 0.479 | 0.074 | 0.048 | 0.0113 | 0.0018 | 0.0013 |
| 0.005– | 1.000 | 15.74 | 0.01 | 0.17 | ||||
| Range | (1/Nevts) d/d | ||||||
| 0.014–0.016 | 0.0153 | 0.072 | 0.002 | 0.023 | 28.59 | 0.64 | 9.26 |
| 0.016–0.022 | 0.0191 | 0.065 | 0.001 | 0.005 | 21.57 | 0.20 | 1.57 |
| 0.022–0.027 | 0.0246 | 0.082 | 0.001 | 0.003 | 21.62 | 0.19 | 0.80 |
| 0.027–0.033 | 0.0301 | 0.091 | 0.001 | 0.002 | 19.65 | 0.18 | 0.53 |
| 0.033–0.038 | 0.0356 | 0.101 | 0.001 | 0.002 | 18.02 | 0.16 | 0.44 |
| 0.038–0.044 | 0.0411 | 0.114 | 0.001 | 0.003 | 17.27 | 0.17 | 0.43 |
| 0.044–0.049 | 0.0465 | 0.123 | 0.001 | 0.004 | 15.78 | 0.17 | 0.47 |
| 0.049–0.055 | 0.0521 | 0.131 | 0.002 | 0.004 | 14.664 | 0.194 | 0.442 |
| 0.055–0.060 | 0.0576 | 0.139 | 0.002 | 0.005 | 13.535 | 0.189 | 0.503 |
| 0.060–0.066 | 0.0630 | 0.147 | 0.002 | 0.006 | 12.599 | 0.176 | 0.558 |
| 0.066–0.071 | 0.0685 | 0.158 | 0.002 | 0.008 | 12.036 | 0.165 | 0.635 |
| 0.071–0.077 | 0.0740 | 0.166 | 0.002 | 0.009 | 11.349 | 0.162 | 0.622 |
| 0.077–0.082 | 0.0795 | 0.166 | 0.003 | 0.010 | 10.207 | 0.164 | 0.603 |
| 0.082–0.088 | 0.0850 | 0.172 | 0.003 | 0.010 | 9.571 | 0.160 | 0.566 |
| 0.088–0.099 | 0.0931 | 0.181 | 0.002 | 0.011 | 8.671 | 0.113 | 0.505 |
| 0.099–0.110 | 0.1040 | 0.196 | 0.003 | 0.011 | 7.784 | 0.114 | 0.440 |
| 0.110–0.121 | 0.1150 | 0.216 | 0.004 | 0.012 | 7.237 | 0.120 | 0.395 |
| 0.121–0.143 | 0.1310 | 0.216 | 0.003 | 0.014 | 5.746 | 0.089 | 0.369 |
| 0.143–0.164 | 0.1530 | 0.199 | 0.005 | 0.019 | 3.959 | 0.102 | 0.381 |
| 0.164–0.186 | 0.1750 | 0.230 | 0.009 | 0.035 | 3.473 | 0.134 | 0.532 |
| 0.186–0.208 | 0.1970 | 0.232 | 0.004 | 0.035 | 2.739 | 0.047 | 0.419 |
| 0.208–0.230 | 0.2189 | 0.264 | 0.004 | 0.017 | 2.452 | 0.037 | 0.163 |
| 0.230–0.252 | 0.2410 | 0.256 | 0.004 | 0.008 | 1.903 | 0.030 | 0.063 |
| 0.252–0.274 | 0.2629 | 0.267 | 0.004 | 0.006 | 1.574 | 0.027 | 0.036 |
| 0.274–0.296 | 0.2849 | 0.283 | 0.005 | 0.004 | 1.360 | 0.024 | 0.026 |
| 0.296–0.318 | 0.3068 | 0.290 | 0.005 | 0.004 | 1.118 | 0.022 | 0.020 |
| 0.318–0.351 | 0.3338 | 0.298 | 0.005 | 0.004 | 0.890 | 0.016 | 0.017 |
| 0.351–0.384 | 0.3666 | 0.309 | 0.006 | 0.006 | 0.683 | 0.014 | 0.016 |
| 0.384–0.417 | 0.3997 | 0.343 | 0.007 | 0.008 | 0.567 | 0.013 | 0.015 |
| 0.417–0.450 | 0.4325 | 0.345 | 0.008 | 0.009 | 0.433 | 0.012 | 0.014 |
| 0.450–0.482 | 0.4651 | 0.368 | 0.010 | 0.011 | 0.351 | 0.011 | 0.012 |
| 0.482–0.526 | 0.5035 | 0.384 | 0.011 | 0.013 | 0.264 | 0.008 | 0.010 |
| 0.526–0.570 | 0.5470 | 0.411 | 0.016 | 0.015 | 0.188 | 0.008 | 0.008 |
| 0.570–0.658 | 0.6083 | 0.439 | 0.017 | 0.017 | 0.122 | 0.005 | 0.006 |
| 0.658–0.768 | 0.7047 | 0.431 | 0.032 | 0.018 | 0.0485 | 0.0037 | 0.0027 |
| 0.768–1.000 | 0.8383 | 0.328 | 0.090 | 0.042 | 0.0078 | 0.0022 | 0.0011 |
| 0.014–1.000 | 2.074 | 0.006 | 0.066 | ||||
| Range | (1/Nevts) d/d | ||||||
| 0.014–0.016 | 0.0153 | 0.036 | 0.001 | 0.013 | 14.51 | 0.52 | 5.08 |
| 0.016–0.022 | 0.0191 | 0.052 | 0.001 | 0.008 | 17.32 | 0.27 | 2.58 |
| 0.022–0.027 | 0.0246 | 0.052 | 0.001 | 0.009 | 13.75 | 0.29 | 2.50 |
| 0.027–0.033 | 0.0301 | 0.052 | 0.001 | 0.006 | 11.12 | 0.17 | 1.24 |
| 0.033–0.038 | 0.0356 | 0.060 | 0.001 | 0.003 | 10.75 | 0.14 | 0.47 |
| 0.038–0.044 | 0.0411 | 0.060 | 0.001 | 0.002 | 9.048 | 0.123 | 0.350 |
| 0.044–0.049 | 0.0465 | 0.060 | 0.001 | 0.002 | 7.669 | 0.117 | 0.298 |
| 0.049–0.055 | 0.0521 | 0.066 | 0.001 | 0.003 | 7.410 | 0.113 | 0.294 |
| 0.055–0.060 | 0.0576 | 0.068 | 0.001 | 0.003 | 6.587 | 0.109 | 0.259 |
| 0.060–0.066 | 0.0630 | 0.067 | 0.001 | 0.003 | 5.788 | 0.105 | 0.238 |
| 0.066–0.071 | 0.0685 | 0.070 | 0.001 | 0.003 | 5.344 | 0.100 | 0.228 |
| 0.071–0.077 | 0.0740 | 0.073 | 0.002 | 0.003 | 4.987 | 0.104 | 0.229 |
| 0.077–0.082 | 0.0795 | 0.069 | 0.002 | 0.004 | 4.278 | 0.100 | 0.242 |
| 0.082–0.088 | 0.0850 | 0.074 | 0.002 | 0.005 | 4.117 | 0.101 | 0.253 |
| 0.088–0.099 | 0.0931 | 0.076 | 0.002 | 0.006 | 3.633 | 0.072 | 0.269 |
| 0.099–0.110 | 0.1040 | 0.076 | 0.002 | 0.008 | 3.036 | 0.076 | 0.300 |
| 0.110–0.121 | 0.1150 | 0.077 | 0.002 | 0.011 | 2.568 | 0.081 | 0.357 |
| 0.121–0.143 | 0.1310 | 0.081 | 0.003 | 0.015 | 2.165 | 0.069 | 0.398 |
| 0.143–0.164 | 0.1530 | 0.097 | 0.005 | 0.023 | 1.931 | 0.096 | 0.452 |
| 0.164–0.186 | 0.1750 | 0.106 | 0.009 | 0.039 | 1.603 | 0.133 | 0.594 |
| 0.186–0.208 | 0.1970 | 0.074 | 0.004 | 0.022 | 0.871 | 0.045 | 0.255 |
| 0.208–0.230 | 0.2189 | 0.098 | 0.003 | 0.019 | 0.912 | 0.030 | 0.179 |
| 0.230–0.252 | 0.2410 | 0.104 | 0.003 | 0.008 | 0.775 | 0.025 | 0.062 |
| 0.252–0.274 | 0.2629 | 0.108 | 0.004 | 0.007 | 0.639 | 0.022 | 0.044 |
| 0.274–0.296 | 0.2849 | 0.106 | 0.004 | 0.007 | 0.511 | 0.019 | 0.033 |
| 0.296–0.318 | 0.3068 | 0.109 | 0.004 | 0.006 | 0.419 | 0.016 | 0.024 |
| 0.318–0.351 | 0.3338 | 0.120 | 0.004 | 0.006 | 0.358 | 0.011 | 0.018 |
| 0.351–0.384 | 0.3666 | 0.115 | 0.004 | 0.005 | 0.254 | 0.009 | 0.012 |
| 0.384–0.417 | 0.3997 | 0.105 | 0.004 | 0.005 | 0.173 | 0.008 | 0.008 |
| 0.417–0.450 | 0.4325 | 0.113 | 0.005 | 0.004 | 0.141 | 0.007 | 0.005 |
| 0.450–0.482 | 0.4651 | 0.100 | 0.006 | 0.003 | 0.0950 | 0.0055 | 0.0036 |
| 0.482–0.526 | 0.5035 | 0.100 | 0.005 | 0.003 | 0.0688 | 0.0039 | 0.0027 |
| 0.526–0.570 | 0.5470 | 0.103 | 0.007 | 0.003 | 0.0470 | 0.0032 | 0.0018 |
| 0.570–0.658 | 0.6083 | 0.087 | 0.006 | 0.003 | 0.0241 | 0.0017 | 0.0012 |
| 0.658–0.768 | 0.7047 | 0.083 | 0.009 | 0.004 | 0.0093 | 0.0010 | 0.0006 |
| 0.768–1.000 | 0.8383 | 0.062 | 0.014 | 0.005 | 0.0015 | 0.0003 | 0.0001 |
| 0.014–1.000 | 0.984 | 0.006 | 0.035 | ||||
Pions are seen to dominate the charged hadron production at low momentum, and to decline steadily in fraction as momentum increases. The kaon fraction rises steadily, approaching the pion fraction at high momentum. The proton fraction rises to a plateau value of about one-tenth at about 10 GeV/c, then declines at the highest momenta.
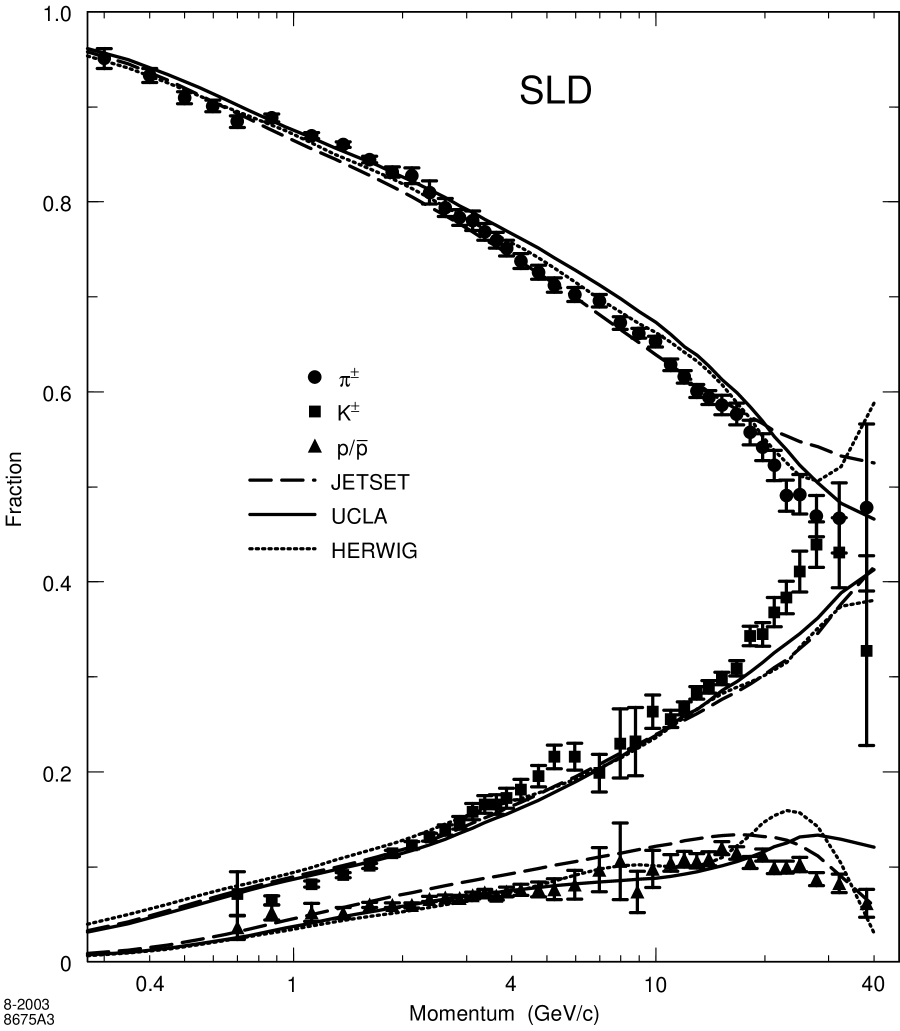
In fig. 4 we compare our results with the predictions of the JETSET, UCLA and HERWIG models. The momentum dependence for each of the three hadron species is reproduced qualitatively by all models. All three models overestimate the kaon fraction for momenta below about 1.5 GeV/c, and underestimate it for momenta above about 15 GeV/c. The UCLA model overestimates the pion fraction by about 2 (taking into account the correlation in the experimental errors) in the 5–15 GeV/c range, but is the only model consistent with the behavior above about 20 GeV/c. The JETSET model overestimates the proton fraction at all momenta, but describes the momentum dependence; HERWIG and UCLA predict behavior at high momentum that is inconsistent with the proton data.
Since the JETSET model has a number of parameters that control specific aspects of relative particle production, we have investigated some simple changes. We find that reducing the diquark:quark ratio (PARJ(1)) from 0.10 to 0.08, while leaving all other parameters unchanged, results in a good description of the proton fraction. The kaon fraction is sensitive to both the -quark probability (PARJ(2)) and the strange vector:pseudoscalar ratio (PARJ(12)), however no combination of these two parameters was found to give a good description of the kaon fraction over the entire measured momentum range.
In order to obtain charged hadron production rates, the simulation was used to subtract the contribution of all particles (mostly leptons) that were not charged pions, kaons or protons from our measured total charged production rate (table 2). The pion, kaon and proton fractions were multiplied by this adjusted rate to obtain the individual rates tabulated in tables 3–5 as a function of scaled momentum. In fig. 5 we compare our distributions with the predictions of the three models. The features for pions are similar to those for all charged tracks: all models describe the data qualitatively; JETSET is within about 2% except for and ; UCLA shows a spectrum very similar to the data but shifted slightly toward lower values; HERWIG is several percent high (low) for and (). For the protons we see features similar to those seen in the proton fraction (fig. 4): JETSET describes the shape of the spectrum but is high by about 20%; UCLA describes the data well except for the structure for ; HERWIG is consistent with the data for , but shows a pronounced structure at lower values of that is inconsistent with the data. For kaons, all three predictions are too high for , especially HERWIG, which is also quite high for and low for ; the other two predictions are low for , and consistent with the data elsewhere, although they peak at higher values than the data.
Our fractions and production rates are generally consistent with those from previous experiments at the [27, 28, 32]. The ALEPH pion spectrum lies above ours at large ; the OPAL proton spectrum is lower than all others at small ; all other differences are within two standard deviations, considering correlations in the systematic errors. Our measurement is the most precise in several regions, most notably for pions in the range , kaons in the range and protons in the range . Measurements based on ring imaging and those based on ionization energy loss rates cover complementary momentum ranges and could be combined to provide continuous, high-precision coverage over the range from the beam momentum () down to GeV/c ().
6 Flavor-Dependent Analysis
The analyses described above were repeated on the light-, -, -, and untagged event samples described in section 3, to yield differential production rates , , , , , respectively; the correction for leptons was not performed at this point, so that , , p. True differential rates in events of the three flavor types, , , , representing events of the types , , and , respectively, were extracted by solving for each species the relations:
| (1) |
Here, is the fraction of hadronic decays of flavor type , taken from the Standard Model, is an element of the event tagging efficiency matrix (see table 1), and represents the momentum-dependent bias of tag toward selecting events of flavor that contain hadrons of species . Ideally all biases would be unity in this formulation. The biases were calculated from the simulation as , where is the number of simulated events (hadrons of species in events) of true flavor and is the number of (-hadrons in) those events that are tagged as flavor . The diagonal bias values [24] are within a few percent of unity reflecting the small dependences of the flavor tags on the charged multiplicity of the event and tracks from strange mesons and baryons that decay close to the IP. The sum of the products of biases and efficiencies must be unity for events of a given true flavor , ; some off-diagonal bias values therefore deviate substantially from unity since the corresponding mistagging rate can be small, but these do not affect the results as the figure of merit is the diagonal element.
The unfolded pion rates were corrected for the contributions from leptons by subtracting the absolute lepton rate predicted by the simulation. At low momentum this background is dominated by electrons from photon conversions, and is a 6% contribution at 1 GeV/c that falls rapidly with increasing momentum. For the heavy flavors, electrons and muons from semi-leptonic decays of heavy hadrons cause the correction to increase with momentum above about 5 GeV/c, reaching 13% (60%) for -(-)flavor events in the highest momentum bins.
The resulting differential production rates are listed in tables 6–8. The systematic errors listed are only those relevant for the comparison of different flavors, namely those due to uncertainties in the unfolding procedure; the relative systematic errors given in the preceding section are also applicable, but are common to all three flavor categories; we also list ratios, for which these common errors cancel. The flavor unfolding systematic errors were evaluated by varying: each diagonal element of the event tagging efficiency matrix by 0.01; the heavy quark production fractions and by the errors on their respective world averages; each diagonal bias value by the larger of 0.005 and 20% of its difference from unity; the photon conversion rate in the simulation by 15%; and the simulated physics lepton rates in light-, -, and -flavor events by 20%, 10% and 5%, respectively. These variations correspond to uncertainties on measurements from our data or other experiments except for the variation of the bias, which was chosen conservatively to be larger than any change seen in a set of comparisons of relevant quantities in data and simulation when selection cuts were varied. The unfolding systematic errors are similar in magnitude to (smaller than) the statistical errors at low (high) momenta, and are generally dominated by the bias for the relevant flavor. There are also substantial contributions from the lepton correction at high momentum for and , and from all three bias terms for and .
| Pion Production Rates | Ratios | |||||||||
| , , | : | : | ||||||||
| 0.0066 | 474.0 | 13.9 | 425.5 | 26.6 | 478.1 | 15.8 | 0.898 | 0.058 | 1.009 | 0.019 |
| 0.0088 | 467.3 | 10.5 | 440.5 | 23.2 | 488.4 | 11.9 | 0.943 | 0.054 | 1.045 | 0.017 |
| 0.0109 | 418.2 | 8.4 | 453.8 | 20.0 | 463.7 | 9.5 | 1.085 | 0.055 | 1.109 | 0.018 |
| 0.0131 | 375.5 | 6.9 | 409.2 | 17.2 | 432.2 | 7.7 | 1.090 | 0.053 | 1.151 | 0.019 |
| 0.0153 | 327.7 | 5.7 | 372.8 | 14.6 | 382.4 | 6.5 | 1.138 | 0.052 | 1.167 | 0.019 |
| 0.0191 | 275.8 | 4.2 | 306.4 | 10.9 | 333.3 | 4.6 | 1.111 | 0.047 | 1.208 | 0.017 |
| 0.0246 | 216.0 | 3.0 | 234.6 | 8.0 | 261.7 | 3.3 | 1.086 | 0.044 | 1.212 | 0.018 |
| 0.0301 | 171.2 | 2.2 | 197.4 | 6.2 | 214.2 | 2.7 | 1.153 | 0.043 | 1.251 | 0.017 |
| 0.0356 | 140.4 | 1.9 | 155.8 | 6.0 | 175.2 | 2.3 | 1.109 | 0.050 | 1.247 | 0.016 |
| 0.0411 | 116.4 | 1.5 | 132.5 | 4.3 | 145.4 | 1.9 | 1.138 | 0.043 | 1.249 | 0.018 |
| 0.0465 | 99.9 | 1.2 | 109.3 | 3.5 | 121.4 | 1.7 | 1.095 | 0.040 | 1.215 | 0.018 |
| 0.0521 | 85.4 | 1.0 | 92.9 | 2.9 | 103.3 | 1.5 | 1.088 | 0.038 | 1.209 | 0.019 |
| 0.0576 | 72.85 | 0.89 | 77.56 | 2.48 | 89.24 | 1.36 | 1.065 | 0.037 | 1.225 | 0.020 |
| 0.0630 | 64.51 | 0.79 | 68.23 | 2.17 | 75.47 | 1.21 | 1.058 | 0.036 | 1.170 | 0.020 |
| 0.0685 | 56.82 | 0.72 | 60.06 | 1.97 | 65.97 | 1.12 | 1.057 | 0.038 | 1.161 | 0.022 |
| 0.0740 | 50.84 | 0.66 | 51.76 | 1.81 | 59.39 | 1.04 | 1.018 | 0.038 | 1.168 | 0.023 |
| 0.0795 | 45.34 | 0.61 | 45.28 | 1.67 | 52.11 | 0.97 | 0.999 | 0.039 | 1.149 | 0.024 |
| 0.0850 | 40.71 | 0.56 | 40.04 | 1.55 | 45.86 | 0.90 | 0.984 | 0.041 | 1.127 | 0.025 |
| 0.0931 | 34.60 | 0.40 | 33.50 | 1.12 | 38.29 | 0.65 | 0.968 | 0.034 | 1.106 | 0.020 |
| 0.1040 | 28.99 | 0.35 | 27.45 | 0.99 | 30.57 | 0.58 | 0.947 | 0.036 | 1.054 | 0.021 |
| 0.1150 | 24.19 | 0.31 | 22.92 | 0.87 | 24.34 | 0.51 | 0.947 | 0.038 | 1.006 | 0.022 |
| 0.1310 | 18.97 | 0.22 | 18.73 | 0.63 | 18.21 | 0.36 | 0.987 | 0.036 | 0.960 | 0.019 |
| 0.1530 | 14.52 | 0.17 | 13.72 | 0.50 | 12.27 | 0.28 | 0.945 | 0.038 | 0.845 | 0.020 |
| 0.1750 | 11.06 | 0.14 | 10.18 | 0.41 | 8.25 | 0.22 | 0.920 | 0.040 | 0.746 | 0.021 |
| 0.1970 | 8.67 | 0.12 | 7.53 | 0.34 | 5.83 | 0.18 | 0.868 | 0.042 | 0.673 | 0.022 |
| 0.2189 | 6.79 | 0.10 | 5.76 | 0.29 | 4.14 | 0.15 | 0.848 | 0.046 | 0.609 | 0.023 |
| 0.2410 | 5.341 | 0.085 | 4.381 | 0.235 | 2.984 | 0.128 | 0.820 | 0.048 | 0.559 | 0.025 |
| 0.2629 | 4.214 | 0.073 | 3.358 | 0.202 | 2.303 | 0.110 | 0.797 | 0.051 | 0.547 | 0.027 |
| 0.2849 | 3.452 | 0.064 | 2.487 | 0.171 | 1.642 | 0.094 | 0.720 | 0.052 | 0.475 | 0.028 |
| 0.3068 | 2.727 | 0.056 | 1.947 | 0.148 | 1.365 | 0.085 | 0.714 | 0.057 | 0.501 | 0.032 |
| 0.3338 | 2.138 | 0.042 | 1.436 | 0.108 | 0.886 | 0.063 | 0.672 | 0.053 | 0.414 | 0.030 |
| 0.3666 | 1.652 | 0.036 | 0.817 | 0.087 | 0.631 | 0.052 | 0.495 | 0.054 | 0.382 | 0.032 |
| 0.3997 | 1.164 | 0.031 | 0.614 | 0.074 | 0.490 | 0.047 | 0.527 | 0.066 | 0.421 | 0.042 |
| 0.4325 | 0.874 | 0.027 | 0.386 | 0.063 | 0.276 | 0.038 | 0.441 | 0.074 | 0.316 | 0.045 |
| 0.4651 | 0.622 | 0.024 | 0.429 | 0.061 | 0.187 | 0.033 | 0.689 | 0.102 | 0.301 | 0.054 |
| 0.5035 | 0.441 | 0.019 | 0.206 | 0.043 | 0.111 | 0.025 | 0.467 | 0.101 | 0.252 | 0.058 |
| 0.5470 | 0.300 | 0.017 | 0.142 | 0.037 | 0.045 | 0.019 | 0.472 | 0.128 | 0.151 | 0.062 |
| 0.6083 | 0.178 | 0.010 | 0.066 | 0.021 | 0.039 | 0.010 | 0.371 | 0.122 | 0.222 | 0.060 |
| 0.7047 | 0.081 | 0.007 | 0.003 | 0.010 | 0.011 | 0.005 | 0.043 | 0.125 | 0.141 | 0.062 |
| 0.8383 | 0.016 | 0.003 | 0.003 | 0.006 | 0.003 | 0.002 | 0.160 | 0.356 | 0.190 | 0.150 |
| Total | 15.294 | 0.250 | 15.783 | 0.465 | 16.841 | 0.278 | ||||
| Kaon Production Rates | Ratios | |||||||||
| , , | : | : | ||||||||
| 0.0153 | 27.05 | 1.27 | 30.92 | 3.86 | 30.21 | 1.99 | 1.143 | 0.155 | 1.117 | 0.090 |
| 0.0191 | 20.00 | 0.42 | 22.43 | 1.37 | 23.06 | 0.62 | 1.121 | 0.078 | 1.153 | 0.040 |
| 0.0246 | 19.74 | 0.40 | 22.04 | 1.27 | 22.89 | 0.60 | 1.116 | 0.074 | 1.159 | 0.039 |
| 0.0301 | 17.52 | 0.37 | 20.82 | 1.17 | 21.64 | 0.55 | 1.189 | 0.076 | 1.236 | 0.041 |
| 0.0356 | 16.08 | 0.37 | 16.79 | 1.15 | 21.36 | 0.53 | 1.044 | 0.083 | 1.328 | 0.046 |
| 0.0411 | 15.04 | 0.34 | 16.68 | 1.15 | 21.36 | 0.56 | 1.110 | 0.086 | 1.420 | 0.048 |
| 0.0465 | 13.54 | 0.34 | 16.46 | 1.06 | 19.90 | 0.57 | 1.215 | 0.088 | 1.469 | 0.056 |
| 0.0521 | 11.87 | 0.34 | 15.81 | 1.08 | 18.91 | 0.60 | 1.332 | 0.103 | 1.593 | 0.068 |
| 0.0576 | 11.44 | 0.33 | 12.62 | 0.99 | 18.46 | 0.58 | 1.103 | 0.094 | 1.613 | 0.069 |
| 0.0630 | 10.64 | 0.30 | 12.24 | 0.92 | 17.43 | 0.54 | 1.151 | 0.095 | 1.639 | 0.069 |
| 0.0685 | 10.24 | 0.29 | 11.42 | 0.87 | 16.92 | 0.53 | 1.115 | 0.093 | 1.652 | 0.070 |
| 0.0740 | 9.67 | 0.29 | 10.95 | 0.85 | 15.62 | 0.52 | 1.133 | 0.096 | 1.616 | 0.072 |
| 0.0795 | 8.13 | 0.27 | 10.88 | 0.84 | 15.11 | 0.52 | 1.339 | 0.114 | 1.859 | 0.090 |
| 0.0850 | 7.98 | 0.28 | 9.62 | 0.81 | 13.18 | 0.50 | 1.206 | 0.111 | 1.651 | 0.084 |
| 0.0931 | 7.00 | 0.19 | 9.84 | 0.59 | 12.43 | 0.36 | 1.406 | 0.094 | 1.778 | 0.070 |
| 0.1040 | 6.36 | 0.19 | 8.08 | 0.58 | 11.56 | 0.37 | 1.271 | 0.100 | 1.819 | 0.080 |
| 0.1150 | 5.85 | 0.20 | 8.98 | 0.63 | 9.96 | 0.38 | 1.535 | 0.122 | 1.704 | 0.088 |
| 0.1310 | 4.89 | 0.15 | 6.59 | 0.45 | 7.17 | 0.27 | 1.349 | 0.104 | 1.467 | 0.072 |
| 0.1530 | 3.41 | 0.17 | 5.50 | 0.51 | 4.58 | 0.29 | 1.614 | 0.175 | 1.343 | 0.108 |
| 0.1750 | 2.84 | 0.22 | 5.12 | 0.68 | 4.20 | 0.36 | 1.805 | 0.289 | 1.480 | 0.173 |
| 0.1970 | 2.564 | 0.082 | 3.850 | 0.245 | 2.541 | 0.126 | 1.502 | 0.110 | 0.991 | 0.059 |
| 0.2189 | 2.401 | 0.067 | 3.087 | 0.190 | 2.009 | 0.096 | 1.286 | 0.090 | 0.837 | 0.047 |
| 0.2410 | 1.973 | 0.054 | 2.074 | 0.145 | 1.627 | 0.078 | 1.051 | 0.081 | 0.825 | 0.046 |
| 0.2629 | 1.643 | 0.048 | 1.960 | 0.132 | 1.116 | 0.062 | 1.193 | 0.090 | 0.679 | 0.043 |
| 0.2849 | 1.481 | 0.044 | 1.681 | 0.119 | 0.830 | 0.053 | 1.135 | 0.090 | 0.560 | 0.039 |
| 0.3068 | 1.211 | 0.039 | 1.368 | 0.104 | 0.640 | 0.045 | 1.129 | 0.096 | 0.529 | 0.041 |
| 0.3338 | 1.001 | 0.029 | 1.043 | 0.076 | 0.452 | 0.032 | 1.042 | 0.084 | 0.451 | 0.034 |
| 0.3666 | 0.746 | 0.025 | 0.874 | 0.068 | 0.337 | 0.028 | 1.171 | 0.102 | 0.451 | 0.040 |
| 0.3997 | 0.666 | 0.023 | 0.600 | 0.058 | 0.245 | 0.024 | 0.900 | 0.094 | 0.367 | 0.038 |
| 0.4325 | 0.559 | 0.022 | 0.408 | 0.050 | 0.149 | 0.020 | 0.730 | 0.094 | 0.266 | 0.036 |
| 0.4651 | 0.426 | 0.020 | 0.408 | 0.050 | 0.108 | 0.018 | 0.957 | 0.126 | 0.253 | 0.043 |
| 0.5035 | 0.363 | 0.016 | 0.243 | 0.037 | 0.057 | 0.012 | 0.669 | 0.106 | 0.156 | 0.035 |
| 0.5470 | 0.261 | 0.015 | 0.173 | 0.034 | 0.061 | 0.013 | 0.663 | 0.136 | 0.233 | 0.050 |
| 0.6083 | 0.183 | 0.010 | 0.064 | 0.020 | 0.012 | 0.005 | 0.351 | 0.109 | 0.066 | 0.030 |
| 0.7047 | 0.079 | 0.007 | 0.009 | 0.011 | 0.002 | 0.003 | 0.113 | 0.141 | 0.026 | 0.035 |
| 0.8383 | 0.008 | 0.004 | 0.008 | 0.008 | –.001 | 0.001 | 0.989 | 1.126 | –.098 | 0.102 |
| Total | 1.869 | 0.062 | 2.273 | 0.093 | 2.377 | 0.080 | ||||
| Proton Production Rates | Ratios | |||||||||
| , , | : | : | ||||||||
| 0.0153 | 13.98 | 0.99 | 13.28 | 2.94 | 13.79 | 1.49 | 0.950 | 0.226 | 0.987 | 0.127 |
| 0.0191 | 17.63 | 0.58 | 15.22 | 1.89 | 17.93 | 0.78 | 0.863 | 0.120 | 1.017 | 0.056 |
| 0.0246 | 13.42 | 0.60 | 13.32 | 1.86 | 16.41 | 0.93 | 0.992 | 0.152 | 1.223 | 0.089 |
| 0.0301 | 10.57 | 0.36 | 9.60 | 1.16 | 12.11 | 0.52 | 0.909 | 0.122 | 1.146 | 0.063 |
| 0.0356 | 9.98 | 0.31 | 11.64 | 1.01 | 10.32 | 0.42 | 1.166 | 0.118 | 1.034 | 0.052 |
| 0.0411 | 8.37 | 0.26 | 10.07 | 0.87 | 9.52 | 0.40 | 1.203 | 0.118 | 1.138 | 0.059 |
| 0.0465 | 7.33 | 0.24 | 8.10 | 0.76 | 7.72 | 0.36 | 1.105 | 0.117 | 1.054 | 0.059 |
| 0.0521 | 7.79 | 0.23 | 6.09 | 0.72 | 6.86 | 0.32 | 0.781 | 0.099 | 0.879 | 0.049 |
| 0.0576 | 6.62 | 0.22 | 6.54 | 0.67 | 6.19 | 0.32 | 0.988 | 0.111 | 0.935 | 0.057 |
| 0.0630 | 5.88 | 0.20 | 6.36 | 0.63 | 4.96 | 0.29 | 1.082 | 0.117 | 0.845 | 0.056 |
| 0.0685 | 5.39 | 0.19 | 4.62 | 0.59 | 4.82 | 0.29 | 0.857 | 0.115 | 0.895 | 0.062 |
| 0.0740 | 5.22 | 0.19 | 4.43 | 0.58 | 4.57 | 0.29 | 0.848 | 0.117 | 0.875 | 0.064 |
| 0.0795 | 4.42 | 0.18 | 4.08 | 0.55 | 4.07 | 0.29 | 0.924 | 0.133 | 0.920 | 0.076 |
| 0.0850 | 4.44 | 0.19 | 3.67 | 0.55 | 3.82 | 0.29 | 0.827 | 0.131 | 0.860 | 0.074 |
| 0.0931 | 3.65 | 0.13 | 4.07 | 0.42 | 3.29 | 0.21 | 1.116 | 0.123 | 0.901 | 0.066 |
| 0.1040 | 3.11 | 0.13 | 2.98 | 0.41 | 2.68 | 0.22 | 0.960 | 0.139 | 0.861 | 0.079 |
| 0.1150 | 2.73 | 0.15 | 2.30 | 0.43 | 2.24 | 0.23 | 0.844 | 0.166 | 0.819 | 0.096 |
| 0.1310 | 2.15 | 0.12 | 2.39 | 0.36 | 1.84 | 0.19 | 1.110 | 0.180 | 0.856 | 0.100 |
| 0.1530 | 1.83 | 0.16 | 1.72 | 0.50 | 1.91 | 0.27 | 0.940 | 0.287 | 1.048 | 0.174 |
| 0.1750 | 1.84 | 0.24 | 0.31 | 0.71 | 1.25 | 0.36 | 0.171 | 0.392 | 0.683 | 0.219 |
| 0.1970 | 0.905 | 0.078 | 0.561 | 0.235 | 0.867 | 0.121 | 0.619 | 0.265 | 0.958 | 0.157 |
| 0.2189 | 1.065 | 0.054 | 0.978 | 0.163 | 0.739 | 0.072 | 0.918 | 0.161 | 0.695 | 0.077 |
| 0.2410 | 0.822 | 0.044 | 0.907 | 0.136 | 0.645 | 0.060 | 1.104 | 0.176 | 0.784 | 0.085 |
| 0.2629 | 0.762 | 0.038 | 0.652 | 0.116 | 0.392 | 0.047 | 0.855 | 0.159 | 0.515 | 0.067 |
| 0.2849 | 0.628 | 0.033 | 0.572 | 0.101 | 0.252 | 0.038 | 0.911 | 0.169 | 0.401 | 0.064 |
| 0.3068 | 0.486 | 0.029 | 0.494 | 0.089 | 0.266 | 0.035 | 1.016 | 0.195 | 0.547 | 0.079 |
| 0.3338 | 0.446 | 0.022 | 0.454 | 0.069 | 0.146 | 0.022 | 1.016 | 0.165 | 0.327 | 0.052 |
| 0.3666 | 0.306 | 0.018 | 0.314 | 0.054 | 0.102 | 0.018 | 1.026 | 0.190 | 0.333 | 0.061 |
| 0.3997 | 0.230 | 0.015 | 0.170 | 0.041 | 0.020 | 0.012 | 0.741 | 0.186 | 0.085 | 0.053 |
| 0.4325 | 0.197 | 0.013 | 0.103 | 0.033 | 0.034 | 0.011 | 0.522 | 0.171 | 0.171 | 0.055 |
| 0.4651 | 0.145 | 0.011 | 0.064 | 0.028 | –.004 | 0.007 | 0.445 | 0.196 | –.026 | 0.048 |
| 0.5035 | 0.108 | 0.008 | 0.015 | 0.018 | 0.016 | 0.006 | 0.142 | 0.166 | 0.150 | 0.058 |
| 0.5470 | 0.070 | 0.006 | 0.044 | 0.017 | –.003 | 0.003 | 0.626 | 0.243 | –.043 | 0.049 |
| 0.6083 | 0.036 | 0.003 | 0.007 | 0.007 | 0.004 | 0.002 | 0.186 | 0.193 | 0.107 | 0.061 |
| 0.7047 | 0.013 | 0.002 | 0.015 | 0.005 | –.001 | 0.001 | 1.150 | 0.434 | –.089 | 0.045 |
| 0.8383 | 0.003 | 0.001 | 0.001 | 0.002 | 0.000 | 0.000 | 0.221 | 0.620 | 0.159 | 0.160 |
| Total | 1.008 | 0.038 | 0.930 | 0.056 | 0.909 | 0.037 | ||||
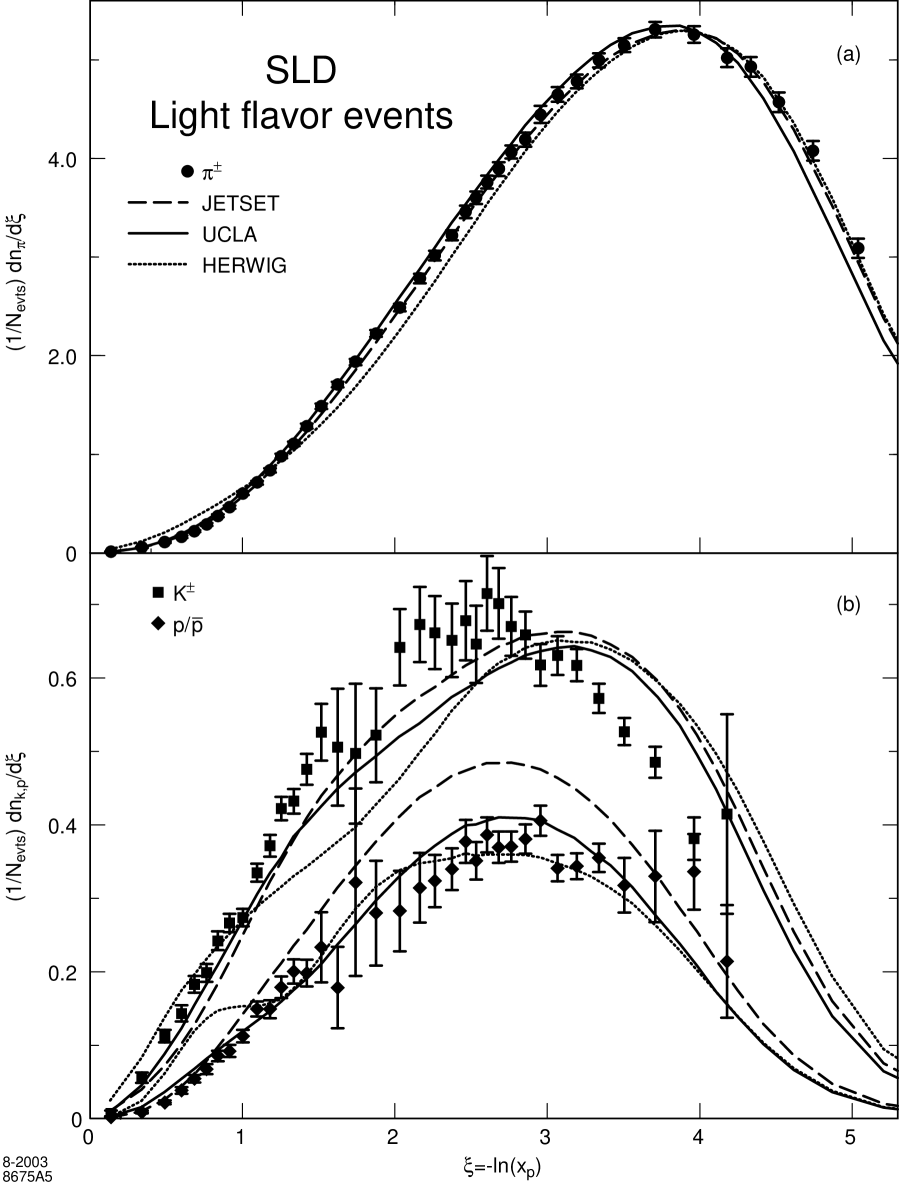
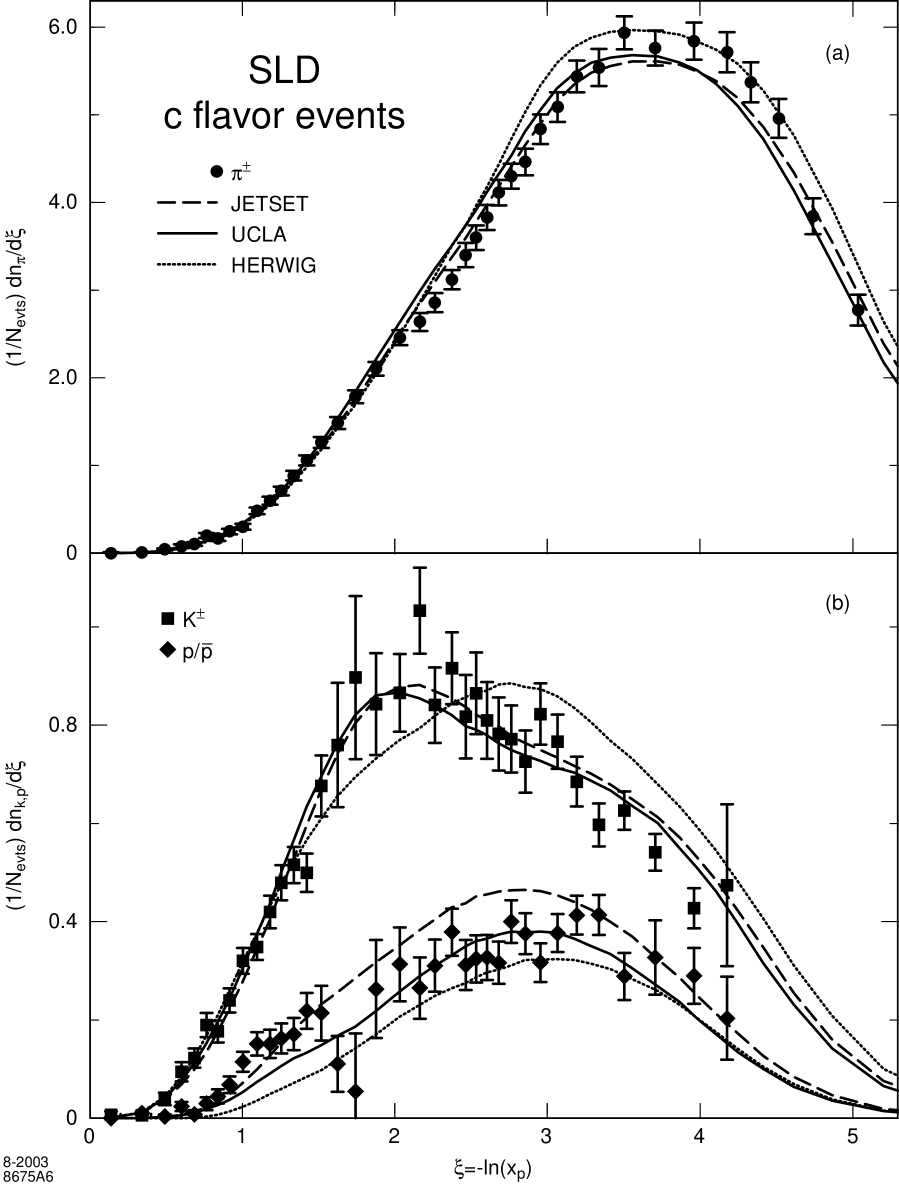
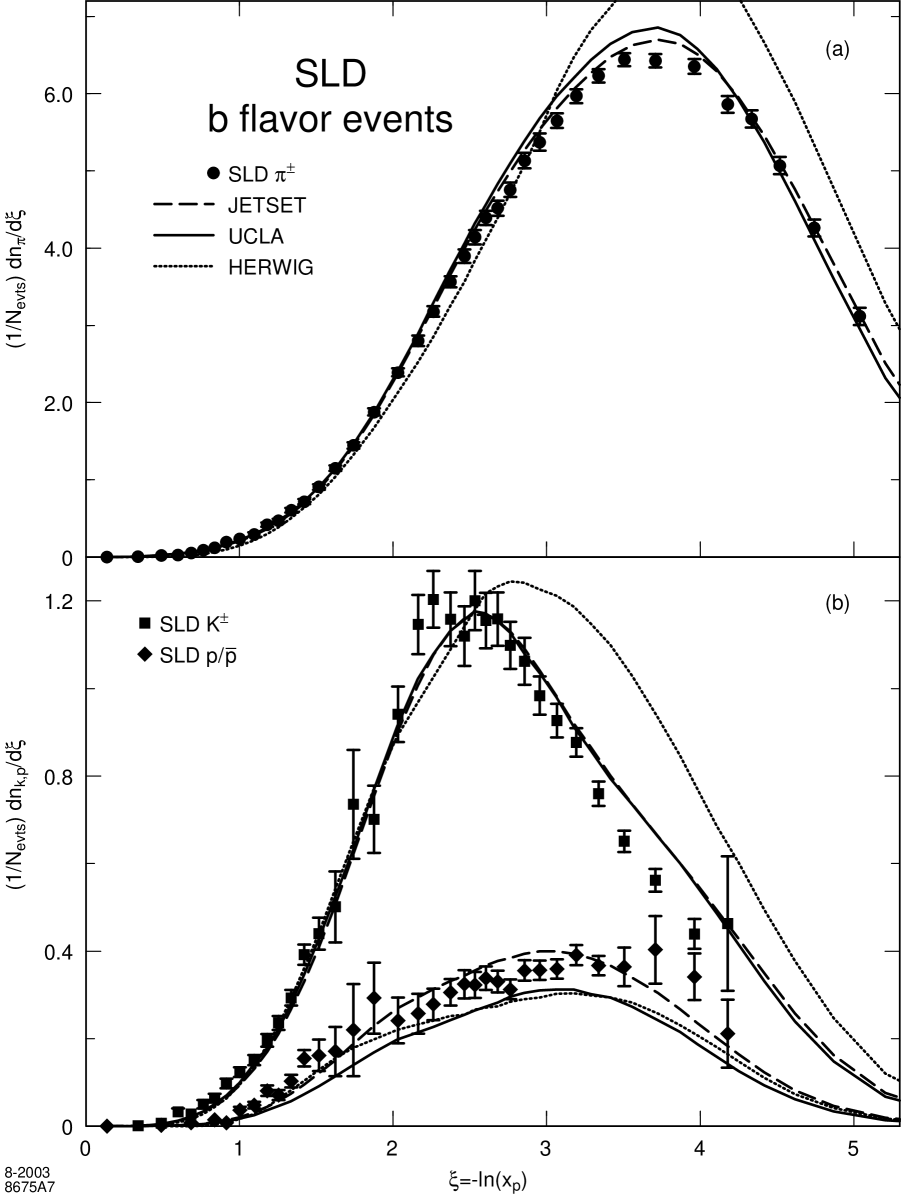
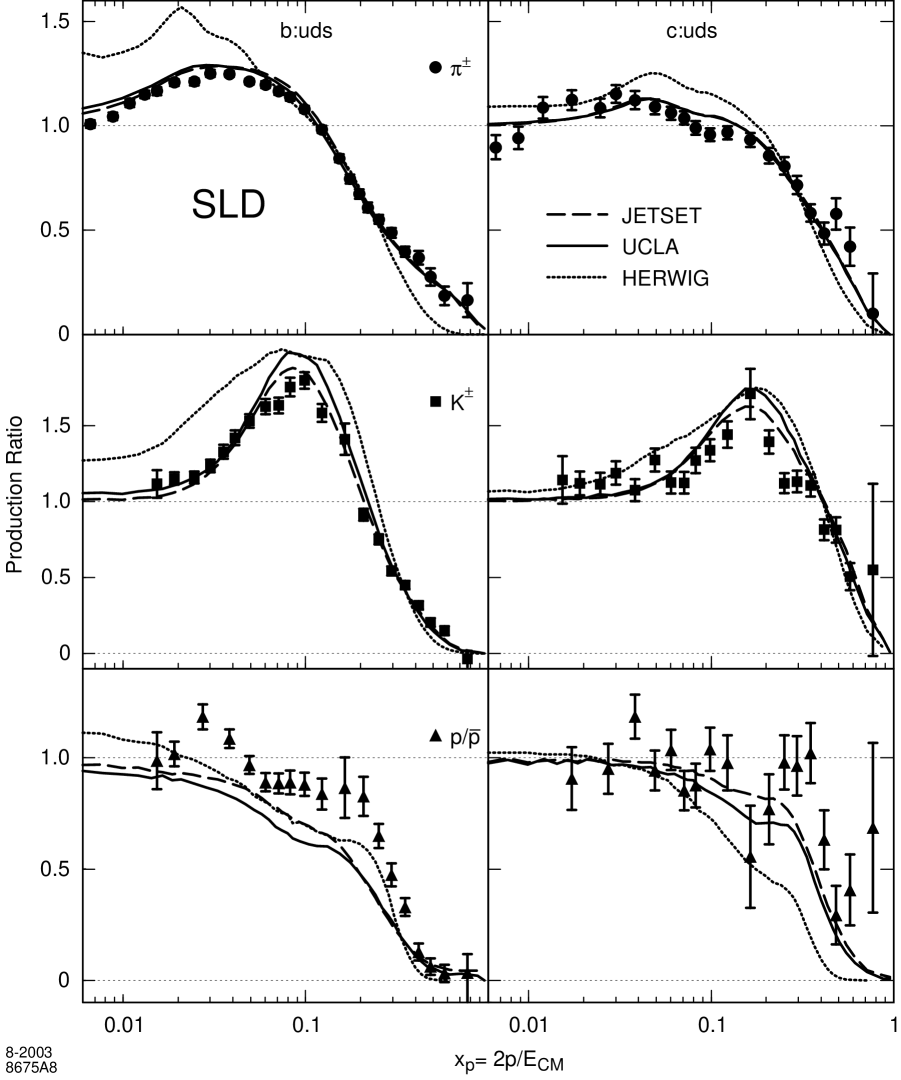
In figs. 6–8 we show the distributions for the three flavor categories, and in fig. 9 we show the ratios of production in -flavor to light-flavor events and -flavor to light-flavor events vs. . At low momentum (high ), there is substantially higher production of charged pions in - and -flavor events than in light-flavor events, and much higher production of charged kaons in -flavor events than in light- or -flavor events; proton production is roughly equal at low momentum. As momentum increases, the production of all three charged hadron species falls much more rapidly in -flavor events than in light-flavor events, and that in -flavor events also drops off sharply at very low .
| Charged Particle Production Rates | Ratios | |||||||||
|---|---|---|---|---|---|---|---|---|---|---|
| , , | : | : | ||||||||
| 0.0066 | 507.8 | 11.9 | 468.7 | 25.3 | 546.1 | 14.2 | 0.923 | 0.053 | 1.075 | 0.014 |
| 0.0088 | 505.2 | 9.2 | 485.4 | 22.6 | 558.5 | 10.3 | 0.961 | 0.050 | 1.105 | 0.013 |
| 0.0109 | 465.3 | 7.5 | 507.2 | 20.2 | 531.9 | 8.0 | 1.090 | 0.052 | 1.143 | 0.014 |
| 0.0131 | 421.9 | 6.3 | 464.0 | 17.6 | 490.8 | 6.3 | 1.100 | 0.050 | 1.163 | 0.014 |
| 0.0153 | 371.7 | 5.8 | 422.9 | 16.9 | 436.5 | 6.7 | 1.137 | 0.054 | 1.174 | 0.020 |
| 0.0191 | 315.5 | 4.2 | 349.1 | 12.7 | 382.8 | 4.4 | 1.107 | 0.049 | 1.213 | 0.017 |
| 0.0246 | 250.5 | 3.2 | 274.1 | 9.5 | 308.6 | 3.4 | 1.094 | 0.046 | 1.232 | 0.018 |
| 0.0301 | 200.3 | 2.3 | 231.5 | 7.3 | 254.8 | 2.6 | 1.156 | 0.044 | 1.272 | 0.017 |
| 0.0356 | 167.3 | 2.0 | 187.5 | 6.9 | 213.2 | 2.1 | 1.121 | 0.050 | 1.275 | 0.016 |
| 0.0411 | 140.4 | 1.6 | 162.3 | 5.2 | 182.1 | 1.9 | 1.156 | 0.044 | 1.297 | 0.017 |
| 0.0465 | 121.2 | 1.3 | 136.6 | 4.2 | 154.5 | 1.7 | 1.127 | 0.041 | 1.275 | 0.018 |
| 0.0521 | 105.5 | 1.1 | 117.3 | 3.6 | 134.3 | 1.6 | 1.112 | 0.040 | 1.273 | 0.019 |
| 0.0576 | 91.2 | 1.0 | 99.1 | 3.0 | 118.6 | 1.4 | 1.087 | 0.038 | 1.301 | 0.020 |
| 0.0630 | 81.29 | 0.89 | 89.21 | 2.65 | 102.4 | 1.3 | 1.097 | 0.037 | 1.260 | 0.020 |
| 0.0685 | 72.69 | 0.81 | 78.25 | 2.42 | 91.92 | 1.22 | 1.077 | 0.037 | 1.265 | 0.021 |
| 0.0740 | 65.92 | 0.76 | 69.26 | 2.23 | 83.63 | 1.14 | 1.051 | 0.038 | 1.269 | 0.022 |
| 0.0795 | 58.06 | 0.70 | 62.25 | 2.06 | 75.06 | 1.10 | 1.072 | 0.040 | 1.293 | 0.024 |
| 0.0850 | 53.26 | 0.66 | 55.28 | 1.93 | 66.58 | 1.04 | 1.038 | 0.040 | 1.250 | 0.024 |
| 0.0931 | 45.37 | 0.48 | 49.14 | 1.42 | 57.31 | 0.74 | 1.083 | 0.035 | 1.263 | 0.020 |
| 0.1040 | 38.55 | 0.43 | 40.11 | 1.29 | 47.80 | 0.71 | 1.040 | 0.037 | 1.240 | 0.022 |
| 0.1150 | 32.84 | 0.41 | 35.64 | 1.22 | 39.19 | 0.67 | 1.085 | 0.041 | 1.194 | 0.025 |
| 0.1310 | 26.05 | 0.28 | 28.94 | 0.83 | 29.54 | 0.48 | 1.111 | 0.035 | 1.134 | 0.022 |
| 0.1530 | 19.79 | 0.29 | 21.99 | 0.86 | 20.69 | 0.48 | 1.111 | 0.048 | 1.045 | 0.029 |
| 0.1750 | 15.75 | 0.35 | 16.51 | 1.03 | 15.36 | 0.55 | 1.048 | 0.071 | 0.975 | 0.041 |
| 0.1970 | 12.16 | 0.17 | 12.69 | 0.50 | 10.65 | 0.26 | 1.044 | 0.046 | 0.876 | 0.024 |
| 0.2189 | 10.27 | 0.14 | 10.41 | 0.40 | 8.06 | 0.20 | 1.013 | 0.044 | 0.785 | 0.022 |
| 0.2410 | 8.14 | 0.11 | 7.86 | 0.32 | 6.28 | 0.16 | 0.965 | 0.044 | 0.772 | 0.022 |
| 0.2629 | 6.62 | 0.10 | 6.37 | 0.28 | 4.69 | 0.13 | 0.961 | 0.047 | 0.709 | 0.023 |
| 0.2849 | 5.565 | 0.087 | 5.060 | 0.241 | 3.490 | 0.110 | 0.909 | 0.048 | 0.627 | 0.022 |
| 0.3068 | 4.428 | 0.076 | 4.080 | 0.210 | 2.935 | 0.098 | 0.922 | 0.052 | 0.663 | 0.025 |
| 0.3338 | 3.588 | 0.057 | 3.123 | 0.156 | 2.041 | 0.068 | 0.870 | 0.048 | 0.569 | 0.021 |
| 0.3666 | 2.706 | 0.049 | 2.141 | 0.126 | 1.534 | 0.058 | 0.791 | 0.051 | 0.567 | 0.024 |
| 0.3997 | 2.062 | 0.042 | 1.472 | 0.106 | 1.111 | 0.051 | 0.714 | 0.055 | 0.539 | 0.027 |
| 0.4325 | 1.631 | 0.037 | 0.952 | 0.090 | 0.736 | 0.042 | 0.584 | 0.058 | 0.451 | 0.028 |
| 0.4651 | 1.193 | 0.034 | 0.935 | 0.085 | 0.510 | 0.037 | 0.783 | 0.076 | 0.427 | 0.033 |
| 0.5035 | 0.912 | 0.026 | 0.485 | 0.061 | 0.330 | 0.027 | 0.532 | 0.070 | 0.362 | 0.032 |
| 0.5470 | 0.632 | 0.023 | 0.372 | 0.055 | 0.188 | 0.022 | 0.588 | 0.091 | 0.298 | 0.037 |
| 0.6083 | 0.398 | 0.015 | 0.140 | 0.031 | 0.089 | 0.012 | 0.353 | 0.081 | 0.224 | 0.031 |
| 0.7047 | 0.172 | 0.011 | 0.027 | 0.016 | 0.017 | 0.006 | 0.158 | 0.096 | 0.099 | 0.034 |
| 0.8383 | 0.027 | 0.005 | 0.011 | 0.010 | 0.003 | 0.002 | 0.412 | 0.386 | 0.103 | 0.095 |
These features are consistent with expectations based on the known properties of events, namely that a large fraction of the event energy is carried by the leading and hadrons [33], leaving little energy available to produce nonleading hadrons. The hadrons decay into a large number of lighter particles, including on average 5.5 stable charged hadrons [8], which are expected to populate primarily the region . The mixture of particle types might be similar to that in light-flavor jets, except that the weak decay chain of the hadron should produce one ‘additional’ per event, and baryon production might be suppressed since a typical baryon-antibaryon pair mass is not small compared with the hadron mass. Similar effects in -jets result in an intermediate situation: each jet contains a charmed hadron with on average about half the beam energy, a lower fraction than for -hadrons, which leaves more energy available for nonleading hadrons than in -jets. A meson decay produces an additional kaon that often carries a large fraction of its momentum, and fewer additional particles than a decay. Our results are consistent with those published previously [28] and considerably more precise.
Also shown in figs. 6–9 are the predictions of the three models; they all reproduce the observed flavor dependence qualitatively. In the case of the light flavors, problems with the models very similar to those seen in the preceding section for the flavor inclusive sample are observed, indicating problems in the modelling of hadronization, and not just in that of heavy hadron decay. Some of the discrepancies are larger in the light flavors than in all flavors; in particular the structure at small in the HERWIG model is now very pronounced for all three particle types.
In -flavor events, all models predict the pion yield within a few percent, but the spectra are slightly too hard. JETSET again predicts the shape of the proton spectrum reasonably well, but is slightly high on the amplitude; UCLA and HERWIG describe the data at large , but fall well below the data at small . JETSET and UCLA predict a kaon spectrum in which those from leading hadron decays peak at , and those from the hadronization of the remaining jet form a broad shoulder at larger values. They are qualitatively consistent with the data, though the data prefer a lower shoulder. HERWIG predicts a quite different shape that is inconsistent with the data, probably reflecting known problems in the modelling of heavy hadron production and decay.
In -flavor events, JETSET and UCLA describe the pion and kaon spectra reasonably well, predicting a few too many pions in the range , and too many kaons for ; both also predict the shape of the proton spectrum well, but UCLA is too low in amplitude and JETSET is consistent with the data. Again, HERWIG predicts very different spectra, all of which are inconsistent with the data at large values.
The rate for all charged tracks in each of the flavor samples was derived by summing the rates for the three charged hadron species and adding the simulated contribution from leptons. These rates and their ratios are listed in table 9; no plots are shown since the features correspond to those of the pion data and models in figs. 6–9. Our data are consistent with those published by DELPHI [28] and OPAL [10], and substantially more precise.
7 Comparison with QCD Predictions
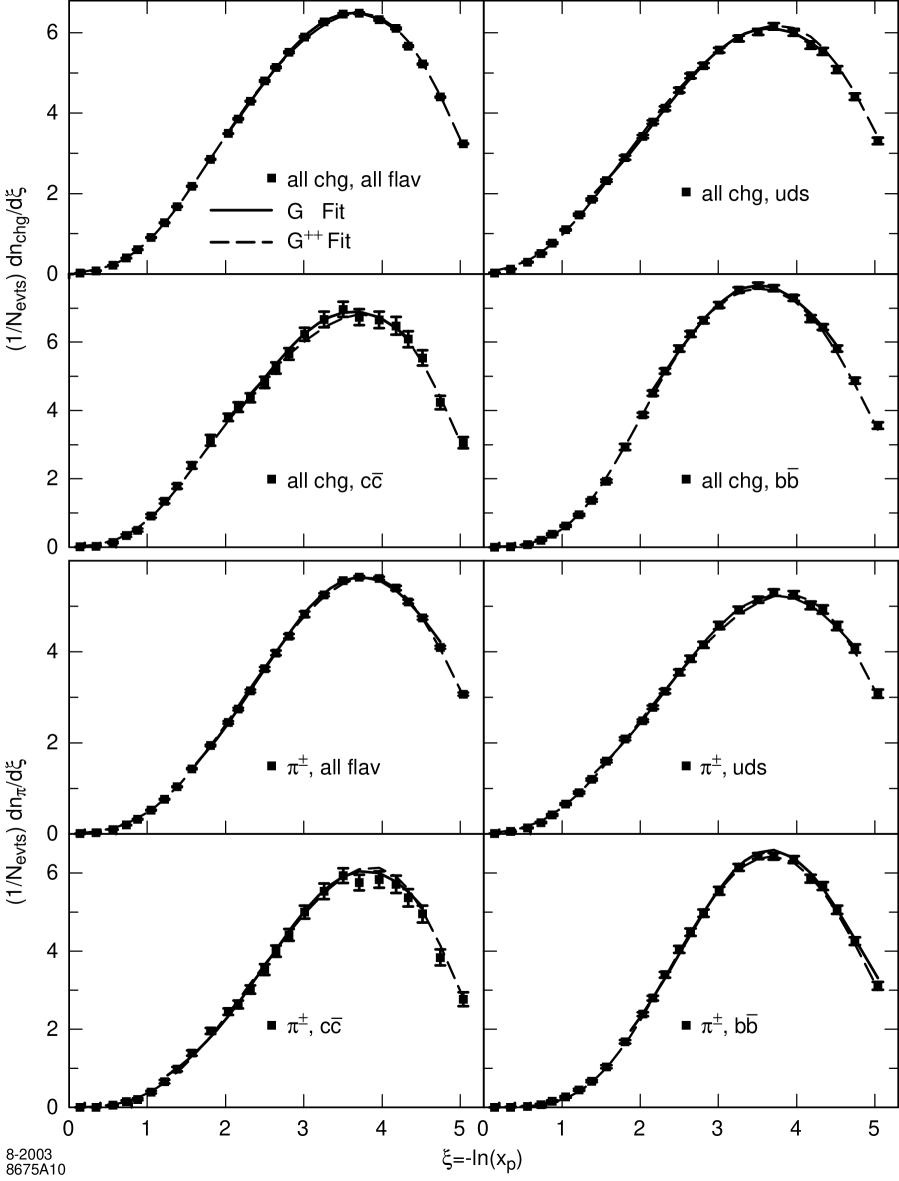
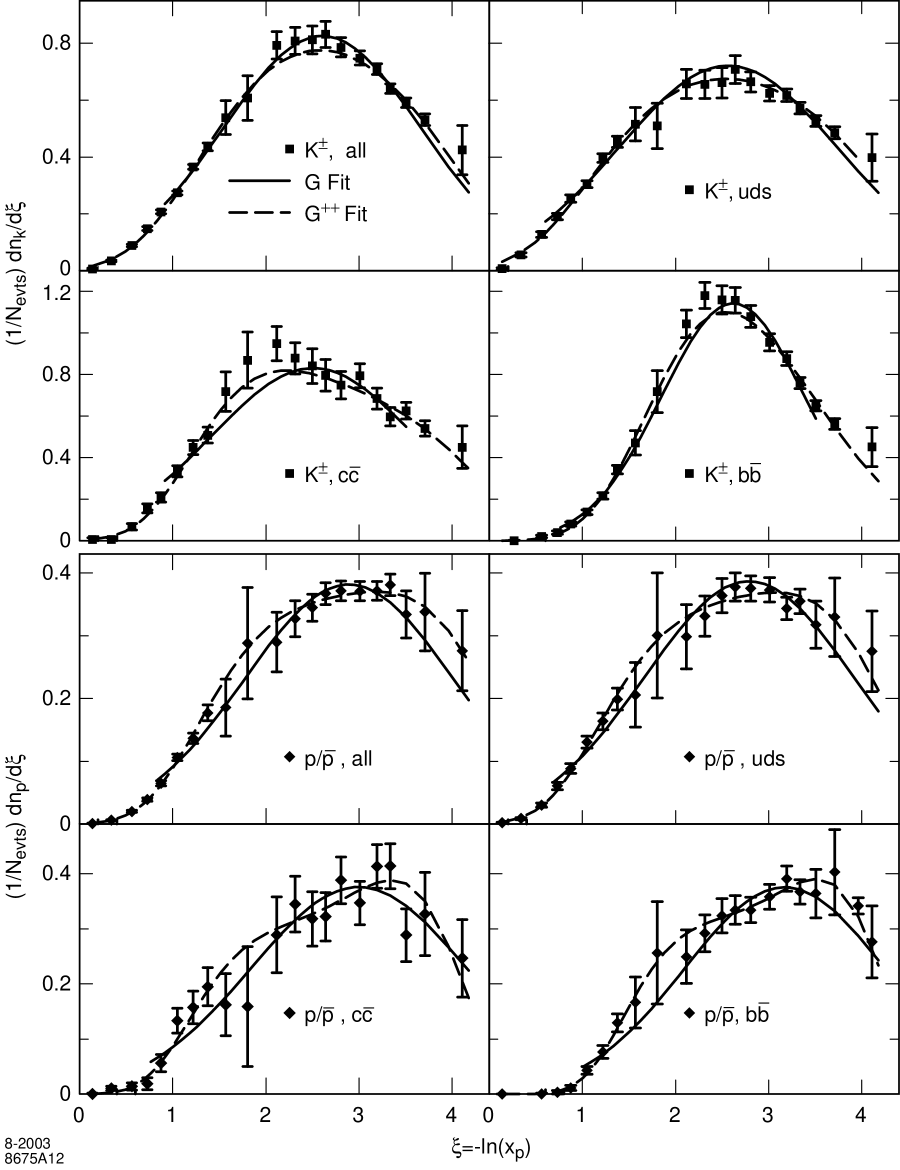
We tested the predictions of QCD in the Modified Leading Logarithm Approximation (MLLA), combined with the ansatz of Local Parton-Hadron Duality (LPHD), by fitting Gaussian and distorted Gaussian functions to our measured distributions. Examples of such fits are shown in figs. 10 and 11. In each case, we first fitted a simple Gaussian to each set of points within a region of at least 0.5 units in size centered on the approximate peak position. We chose the largest such symmetric range for which the confidence level of the of the fit exceeded 0.01, and then added points on one side (in all cases at lower values) as long as the confidence level remained above 0.01. We found that the Gaussian function could describe the data over a symmetric range of at least 0.8–1.6 units about the peak position, consistent with one prediction of MLLA QCD; the fit could be extended toward lower by as much as 1.7 additional units, although it must be noted that our errors on the kaon and proton spectra are rather large in this range. The largest fittable ranges are given in table 10 and the corresponding fitted functions are shown on figs. 10 and 11.
We next introduced a skewness term into the function (G+) and repeated the above procedure. We found that the symmetric range could be extended in only some cases, and by at most 0.6 units (see table 10). In all-flavor and light-flavor events there was always an increase in the fittable range on either the low or high end, and the fitted skewness values were small. In - and -flavor events, however, there were some cases in which no increase in the fittable range could be obtained, and others in which the range could be increased but the skewness value increased rapidly.
The addition of a kurtosis term (G++) had similar results (see table 10); the fittable range was increased greatly, in many cases to the entire measured range, however both the skewness and kurtosis values became large for - and -flavor events. The resulting functions are shown on figs. 10–11 over the entire range; the large distortions are evident in the - and -flavor events for kaons and protons. The MLLA prediction that a Gaussian with small distortion terms should describe the data over a range substantially larger than one unit about the peak position holds for the light flavors, but does not hold for heavy flavors; this might be expected since the calculation assumes massless partons.
The peak of the distribution is predicted to decrease exponentially with increasing particle mass. Following convention, we took the mean of the fitted Gaussian over a range of one unit about the peak as an estimate of , and, in addition to statistical and experimental systematic errors, we considered a variation of the fit range. A fit was performed to each set of contiguous points with a smallest (largest) value between 0.75 and 1.25 units below (above) the peak position. Half the difference between the highest and lowest of the fitted means was taken as an estimate of the systematic uncertainty due to the fit range. The resulting values of are listed in table 10, where a considerable flavor dependence is seen.
| Peak position | |||||||
|---|---|---|---|---|---|---|---|
| Max. fit range | |||||||
| * | stat. | syst. | fit | ||||
| All | 1.62–4.74 | 1.88–5.21 | 0.92–5.21 | 3.752 | 0.004 | 0.008 | 0.010 |
| : | 1.40–4.85 | 1.55–5.21 | 0.64–5.21 | 3.787 | 0.008 | 0.027 | 0.014 |
| 1.30–4.60 | 1.47–5.21 | 0.87–5.21 | 3.726 | 0.014 | 0.090 | 0.039 | |
| 1.81–5.21 | 1.81–5.21 | 0.00–5.21 | 3.684 | 0.008 | 0.005 | 0.001 | |
| All | 0.92–4.18 | 0.49–4.18 | 0.34–4.18 | 2.549 | 0.018 | 0.042 | 0.062 |
| : | 0.55–4.25 | 0.24–4.25 | 0.24–4.25 | 2.592 | 0.032 | 0.091 | 0.021 |
| 0.87–3.61 | 0.00–4.25 | 0.00–4.25 | 2.412 | 0.030 | 0.018 | 0.012 | |
| 0.72–3.61 | 0.00–4.25 | 0.00–4.25 | 2.587 | 0.014 | 0.017 | 0.004 | |
| All | 0.84–4.18 | 0.76–4.18 | 0.14–4.18 | 3.084 | 0.101 | 0.056 | 0.031 |
| p: | 0.64–4.25 | 0.42–4.25 | 0.00–4.25 | 2.859 | 0.076 | 0.028 | 0.026 |
| 0.72–4.25 | 0.72–4.25 | 0.00–4.25 | 3.079 | 0.113 | 0.023 | 0.068 | |
| 0.97–4.25 | 0.97–4.25 | 0.00–4.25 | 3.513 | 0.100 | 0.254 | 0.011 | |
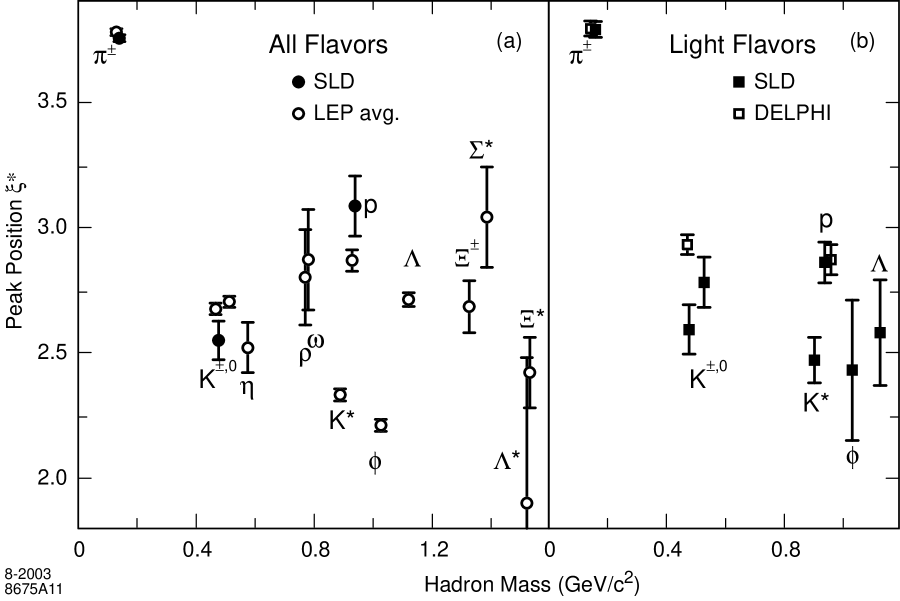
The values in all-flavor and light-flavor events are shown in fig. 12 along with previous results [7, 12, 27, 28]. As observed previously, the values for the measured hadron species in all-flavor events do not fall on a single trajectory as a function of mass, although roughly parallel trajectories can be postulated for mesons and baryons. For light flavors, the value for pions is quite similar to that for all flavors, and those for the other mesons (baryons) tend to be higher (lower), as would be expected if the MLLA prediction is correct for primary hadrons, but the observed distributions are distorted by secondary particles. However it is still not possible to draw a single trajectory through all the light-flavor points and this apparent deficiency in the the theory remains; it is possible that the exclusion of additional non-primary hadrons might remove it.
Our previous results [12] were used in conjunction with data from other experiments to test the perturbative QCD calculations of the dependence of the rates at high- [5]. The results presented here can be used to make a slightly more precise test; however more precise data at lower and/or higher are needed to confront these calculations in a more meaningful way.
8 Total Production Rates
We have integrated our differential production rates over their respective measurement ranges, taking into account the bin-to-bin correlations in the systematic errors. These integrated rates per event are listed in tables 2–5 and 6–8; the errors are dominated by overall normalization uncertainties corresponding to the uncertainty in our track reconstruction efficiency. In order to quote total rates, we must extrapolate into the unmeasured regions, for inclusive charged particles and pions, and for kaons and protons. As can be seen in figs. 5–8, and 10–11, this is a non-trivial effect, and none of the models or functions provides an ideal estimate of the accepted fraction. However, a set of four estimates derived from the three models and the function might be considered to cover a reasonable range of possibilities. For the - and -flavor events, we used in addition the generator used for our detector simulation [26], a version of JETSET tuned to the world’s data on and hadron production and decay.
| Coverage | Yield/Event | Difference | |||||
|---|---|---|---|---|---|---|---|
| All | 0.925 | 0.007 | 17.007 | 0.209 | |||
| : | 0.923 | 0.008 | 16.579 | 0.304 | 0.375 | 0.587 | |
| 0.931 | 0.013 | 16.954 | 0.556 | 1.557 | 0.232 | ||
| 0.929 | 0.007 | 18.136 | 0.330 | 1.182 | 0.498 | ||
| All | 0.941 | 0.010 | 2.203 | 0.071 | |||
| : | 0.934 | 0.007 | 2.000 | 0.068 | 0.427 | 0.074 | |
| 0.937 | 0.005 | 2.427 | 0.100 | 0.510 | 0.037 | ||
| 0.947 | 0.006 | 2.510 | 0.086 | 0.083 | 0.075 | ||
| All | 0.933 | 0.003 | 1.054 | 0.035 | |||
| p: | 0.921 | 0.010 | 1.094 | 0.043 | 0.060 | 0.074 | |
| 0.899 | 0.038 | 1.034 | 0.077 | 0.091 | 0.034 | ||
| 0.906 | 0.020 | 1.004 | 0.046 | 0.031 | 0.074 | ||
| 0.927 | 0.007 | 20.048 | 0.316 | 1.048 | 0.718 | ||
| All Chg.: | 0.940 | 0.015 | 21.096 | 0.653 | 3.050 | 0.311 | |
| 0.933 | 0.010 | 23.098 | 0.378 | 2.002 | 0.643 | ||
From the pions and protons generated using each of the models, we calculated the fraction that were generated in the range of our measurement, as the predictions, when normalized to the data, provided reasonable descriptions of the shape. For the charged kaons (figs. 5–8), all models predict spectra that are too soft; we therefore scaled the predictions along the axis until the best agreement with the data was found. This procedure changed the acceptance correction by a few percent for - and -flavor events, and by as much as 12% for the HERWIG model in light-flavor events. The fitted function was integrated to obtain another estimate of the accepted fraction in those cases where it gave an acceptable over the entire measured range. Otherwise, it was used to calculate a fraction above the lower bound given in table 10, and the data below that bound were added to obtain an overall fraction.
For each hadron species and flavor category these four or five estimates of the fraction were found to be similar, with a typical rms value of about 1% relative. We took their average as our central value of the fraction in each case, and took their rms as the uncertainty due to the extrapolation procedure. These values along with the corrected total rates are listed in table 11; also shown are differences between the three flavor categories, for which some of the uncertainties cancel. The results were found to be consistent with previous measurements; the precision is similar for all-flavor events, and substantially improved for light- and -flavors; ours are the only measurements for -flavor events.
Roughly 10% more pions are produced in -flavor events than in - or light-flavor events; roughly 20% more kaons are produced in both - and -flavor events than in light-flavor events; roughly 10% fewer protons are produced in - than in light-flavor events. The total charged multiplicities and differences between flavors are consistent with previous, dedicated measurements [9, 10]; they have comparable precision with different systematic error sources.
9 Leading Particle Effects
We extended these studies to look for differences between particle and antiparticle production in light quark (as opposed to antiquark) jets, in order to address the question of whether e.g. a primary -initiated jet contains more hadrons that contain a valence -quark (e.g. , , p) than hadrons that do not (e.g. , , ). To this end we used the light quark- and antiquark-tagged hemispheres described in section 3.
We measured the differential production rates per light quark jet
| (2) | |||||
| (3) |
where: and represent light-flavor quark and antiquark jets respectively; is the total number of events in the sample; represents , or p, and the corresponding antihadron. Then, for example, is the number of hadrons of species in light quark jets. This formulation assumes CP symmetry, i.e. , which was found to be satisfied in the data in all cases.
The charged hadron analysis was repeated on the sample of positively charged tracks in the quark-tagged jets and negatively charged tracks in the antiquark-tagged jets, yielding measured values of , , and in the tagged samples. The same procedure applied to the remaining tracks yielded , , and .
The decays of the leading heavy hadrons in simulated heavy flavor background events give rise to differences between hadron and antihadron production in the quark-tagged sample over the entire range, including an effect in high-momentum pions of opposite sign to that seen in the light-flavor data (below). It is essential to understand and/or suppress this contribution; our simulation has been tuned to the available data on charmed and bottom hadron decays, and our light-flavor tag reduces this background to 9% and 2% events. At this level the simulated contribution to any difference is well below the other uncertainties. The simulated contribution to each rate was applied as a correction, yielding differential production rates per light-quark-tagged jet. For each hadron species, differential production rates in light quark jets were then extracted by correcting for the light-tag bias (see sec. 6) and unfolding for the effective quark (vs. antiquark) purity. This purity depends on polar angle, and hence on the acceptance of the CRID as well as the event selection discussed in section 3; its average value was estimated from the simulation to be 0.72 for the selected track sample.
| (%) | (%) | ||||||||||||
|---|---|---|---|---|---|---|---|---|---|---|---|---|---|
| 0.0066 | 243.9 | 4.0 | 237.5 | 4.0 | –1.3 | 1.5 | 0.1150 | 12.25 | 0.30 | 11.99 | 0.30 | –1.1 | 2.2 |
| 0.0088 | 236.7 | 3.6 | 235.5 | 3.5 | –0.3 | 1.3 | 0.1311 | 9.454 | 0.188 | 9.663 | 0.189 | 1.1 | 1.8 |
| 0.0110 | 210.5 | 3.1 | 215.3 | 3.2 | 1.1 | 1.3 | 0.1530 | 7.231 | 0.163 | 7.386 | 0.164 | 1.1 | 2.0 |
| 0.0131 | 194.5 | 2.9 | 189.4 | 2.8 | –1.3 | 1.3 | 0.1750 | 5.594 | 0.141 | 5.433 | 0.139 | –1.5 | 2.3 |
| 0.0153 | 168.1 | 2.6 | 166.4 | 2.6 | –0.5 | 1.4 | 0.1970 | 4.330 | 0.123 | 4.360 | 0.122 | 0.4 | 2.6 |
| 0.0191 | 137.8 | 1.5 | 142.8 | 1.6 | 1.8 | 1.0 | 0.2189 | 3.302 | 0.108 | 3.503 | 0.108 | 3.0 | 2.9 |
| 0.0246 | 108.1 | 1.4 | 109.5 | 1.4 | 0.7 | 1.1 | 0.2410 | 2.619 | 0.092 | 2.721 | 0.093 | 1.9 | 3.1 |
| 0.0301 | 84.99 | 1.18 | 88.51 | 1.19 | 2.0 | 1.2 | 0.2629 | 2.059 | 0.082 | 2.142 | 0.083 | 2.0 | 3.6 |
| 0.0356 | 68.97 | 1.06 | 71.82 | 1.07 | 2.0 | 1.3 | 0.2850 | 1.623 | 0.074 | 1.844 | 0.075 | 6.4 | 3.9 |
| 0.0411 | 57.26 | 0.96 | 59.36 | 0.97 | 1.8 | 1.5 | 0.3070 | 1.294 | 0.065 | 1.378 | 0.065 | 3.2 | 4.4 |
| 0.0466 | 49.27 | 0.91 | 49.63 | 0.91 | 0.4 | 1.6 | 0.3337 | 0.974 | 0.048 | 1.161 | 0.049 | 8.8 | 4.1 |
| 0.0521 | 43.81 | 0.86 | 42.11 | 0.86 | –2.0 | 1.8 | 0.3665 | 0.721 | 0.042 | 0.908 | 0.044 | 11.5 | 4.8 |
| 0.0576 | 37.47 | 0.79 | 36.45 | 0.78 | –1.4 | 1.9 | 0.3996 | 0.523 | 0.036 | 0.637 | 0.037 | 9.9 | 5.7 |
| 0.0631 | 32.00 | 0.72 | 32.79 | 0.72 | 1.2 | 2.0 | 0.4326 | 0.424 | 0.032 | 0.451 | 0.032 | 3.1 | 6.7 |
| 0.0685 | 28.67 | 0.68 | 28.02 | 0.67 | –1.1 | 2.1 | 0.4653 | 0.278 | 0.028 | 0.375 | 0.030 | 15.0 | 8.1 |
| 0.0740 | 24.88 | 0.63 | 26.16 | 0.63 | 2.5 | 2.2 | 0.5034 | 0.221 | 0.021 | 0.222 | 0.022 | 0.2 | 8.8 |
| 0.0795 | 21.33 | 0.59 | 24.09 | 0.60 | 6.1 | 2.4 | 0.5464 | 0.107 | 0.018 | 0.192 | 0.020 | 28. | 11. |
| 0.0850 | 20.51 | 0.56 | 20.15 | 0.56 | –0.9 | 2.5 | 0.6085 | 0.066 | 0.011 | 0.112 | 0.012 | 26. | 12. |
| 0.0931 | 17.82 | 0.37 | 17.17 | 0.36 | –1.8 | 1.9 | 0.7046 | 0.020 | 0.007 | 0.054 | 0.009 | 45. | 20. |
| 0.1041 | 14.52 | 0.33 | 14.61 | 0.33 | 0.3 | 2.0 | 0.8342 | 0.011 | 0.004 | 0.006 | 0.004 | –27. | 40. |
| (%) | (%) | |||||||||||
|---|---|---|---|---|---|---|---|---|---|---|---|---|
| 0.0153 | 13.69 | 1.39 | 12.89 | 1.39 | –3.0 | 9.4 | 8.09 | 1.19 | 6.67 | 1.18 | 10. | 14. |
| 0.0191 | 9.23 | 0.45 | 10.10 | 0.45 | 4.5 | 4.1 | 8.98 | 0.62 | 8.82 | 0.62 | 0.9 | 5.9 |
| 0.0246 | 10.10 | 0.44 | 9.73 | 0.44 | –1.9 | 4.0 | 7.42 | 0.72 | 6.41 | 0.72 | 7.4 | 9.3 |
| 0.0301 | 8.67 | 0.40 | 8.87 | 0.40 | 1.1 | 4.1 | 5.81 | 0.42 | 5.05 | 0.42 | 7.0 | 6.6 |
| 0.0356 | 8.55 | 0.38 | 7.80 | 0.38 | –4.6 | 4.2 | 5.52 | 0.34 | 5.19 | 0.34 | 3.1 | 5.6 |
| 0.0411 | 7.91 | 0.38 | 8.08 | 0.38 | 1.1 | 4.3 | 4.40 | 0.29 | 4.18 | 0.28 | 2.6 | 6.0 |
| 0.0466 | 7.81 | 0.40 | 7.37 | 0.40 | 2.9 | 4.7 | 3.74 | 0.26 | 3.40 | 0.26 | 4.8 | 6.6 |
| 0.0521 | 5.27 | 0.40 | 7.04 | 0.41 | 14.3 | 5.9 | 4.11 | 0.27 | 3.74 | 0.27 | 4.7 | 6.3 |
| 0.0576 | 5.46 | 0.37 | 5.59 | 0.38 | 1.2 | 6.2 | 3.48 | 0.25 | 3.32 | 0.25 | 2.4 | 6.6 |
| 0.0631 | 4.91 | 0.35 | 5.69 | 0.35 | 7.4 | 6.0 | 3.01 | 0.23 | 3.01 | 0.24 | –0.1 | 7.7 |
| 0.0685 | 5.24 | 0.34 | 4.96 | 0.34 | –2.9 | 6.0 | 2.87 | 0.23 | 2.47 | 0.23 | 7.6 | 7.7 |
| 0.0740 | 4.65 | 0.33 | 5.14 | 0.34 | 5.1 | 6.2 | 2.58 | 0.23 | 2.58 | 0.22 | 0.1 | 7.9 |
| 0.0795 | 4.09 | 0.32 | 4.31 | 0.33 | 2.6 | 7.0 | 2.34 | 0.22 | 1.94 | 0.21 | 9.2 | 9.1 |
| 0.0850 | 4.31 | 0.32 | 3.84 | 0.33 | –5.9 | 7.3 | 1.87 | 0.22 | 2.50 | 0.23 | –15. | 10. |
| 0.0931 | 3.13 | 0.22 | 3.89 | 0.23 | 10.9 | 5.8 | 1.94 | 0.16 | 1.87 | 0.16 | 2.1 | 7.5 |
| 0.1041 | 3.07 | 0.22 | 3.28 | 0.23 | 3.3 | 6.4 | 1.43 | 0.16 | 1.62 | 0.16 | –6.1 | 9.5 |
| 0.1150 | 3.00 | 0.24 | 3.05 | 0.25 | 0.8 | 7.3 | 1.45 | 0.18 | 1.33 | 0.17 | 4. | 11. |
| 0.1311 | 2.02 | 0.18 | 2.91 | 0.19 | 17.9 | 6.8 | 1.30 | 0.15 | 0.96 | 0.14 | 15. | 12. |
| 0.1530 | 1.50 | 0.21 | 1.77 | 0.22 | 8. | 12. | 0.88 | 0.19 | 1.07 | 0.20 | –10. | 18. |
| 0.1750 | 1.09 | 0.28 | 1.77 | 0.30 | 23. | 19. | 1.00 | 0.27 | 0.82 | 0.28 | 10. | 28. |
| 0.1970 | 0.997 | 0.104 | 1.528 | 0.111 | 21.0 | 6.9 | 0.501 | 0.087 | 0.417 | 0.087 | 9. | 18. |
| 0.2189 | 0.856 | 0.078 | 1.593 | 0.086 | 30.1 | 5.9 | 0.612 | 0.064 | 0.374 | 0.063 | 24. | 13. |
| 0.2410 | 0.784 | 0.061 | 1.180 | 0.067 | 20.1 | 5.9 | 0.469 | 0.050 | 0.384 | 0.050 | 10. | 11. |
| 0.2629 | 0.571 | 0.054 | 1.105 | 0.060 | 31.9 | 6.2 | 0.475 | 0.045 | 0.275 | 0.043 | 27. | 11. |
| 0.2850 | 0.508 | 0.049 | 0.959 | 0.055 | 30.7 | 6.4 | 0.460 | 0.040 | 0.191 | 0.038 | 41. | 11. |
| 0.3070 | 0.366 | 0.043 | 0.824 | 0.049 | 38.4 | 7.0 | 0.321 | 0.033 | 0.174 | 0.032 | 30. | 12. |
| 0.3337 | 0.320 | 0.033 | 0.711 | 0.038 | 27.9 | 6.2 | 0.298 | 0.025 | 0.147 | 0.024 | 34. | 10. |
| 0.3665 | 0.249 | 0.029 | 0.529 | 0.033 | 35.9 | 7.1 | 0.198 | 0.020 | 0.123 | 0.020 | 23. | 11. |
| 0.3996 | 0.194 | 0.027 | 0.503 | 0.031 | 44.4 | 7.4 | 0.163 | 0.017 | 0.095 | 0.017 | 26. | 12. |
| 0.4326 | 0.167 | 0.024 | 0.372 | 0.027 | 37.9 | 8.5 | 0.114 | 0.015 | 0.083 | 0.014 | 16. | 13. |
| 0.4653 | 0.132 | 0.022 | 0.294 | 0.025 | 38.1 | 9.9 | 0.105 | 0.013 | 0.036 | 0.012 | 49. | 16. |
| 0.5034 | 0.089 | 0.018 | 0.267 | 0.021 | 50.0 | 9.5 | 0.085 | 0.010 | 0.022 | 0.009 | 59. | 15. |
| 0.5464 | 0.050 | 0.016 | 0.208 | 0.019 | 61. | 12. | 0.057 | 0.008 | 0.011 | 0.007 | 67. | 20. |
| 0.6085 | 0.063 | 0.011 | 0.118 | 0.012 | 30. | 11. | 0.024 | 0.004 | 0.009 | 0.004 | 48. | 21. |
| 0.7046 | 0.022 | 0.008 | 0.056 | 0.009 | 43. | 20. | 0.006 | 0.002 | 0.009 | 0.002 | –18. | 29. |
| 0.8342 | 0.005 | 0.005 | 0.006 | 0.005 | 9. | 83. | 0.000 | 0.001 | 0.003 | 0.001 | –164 | 144 |
The measured differential production rates per light quark jet are listed in tables 12–13 and shown in fig. 13; as for the flavor dependent results (sec. 6), the errors given are the sum in quadrature of the statistical error and those systematic errors arising from the tagging and correction procedures. The latter include variation of: the event tagging efficiencies and biases as described in section 6; the electroweak parameters , , and by the errors on their respective world average values; the effective quark purity by 0.01; the sum of and rates in - and -flavor events by a smooth parametrization of the errors in tables 6–8; and their difference by 20% of itself to cover the uncertainty in the electron beam polarization and statistical error on the simulated purities. The systematic errors are small compared with the statistical errors, and are typically dominated by the uncertainty on the effective quark purity.
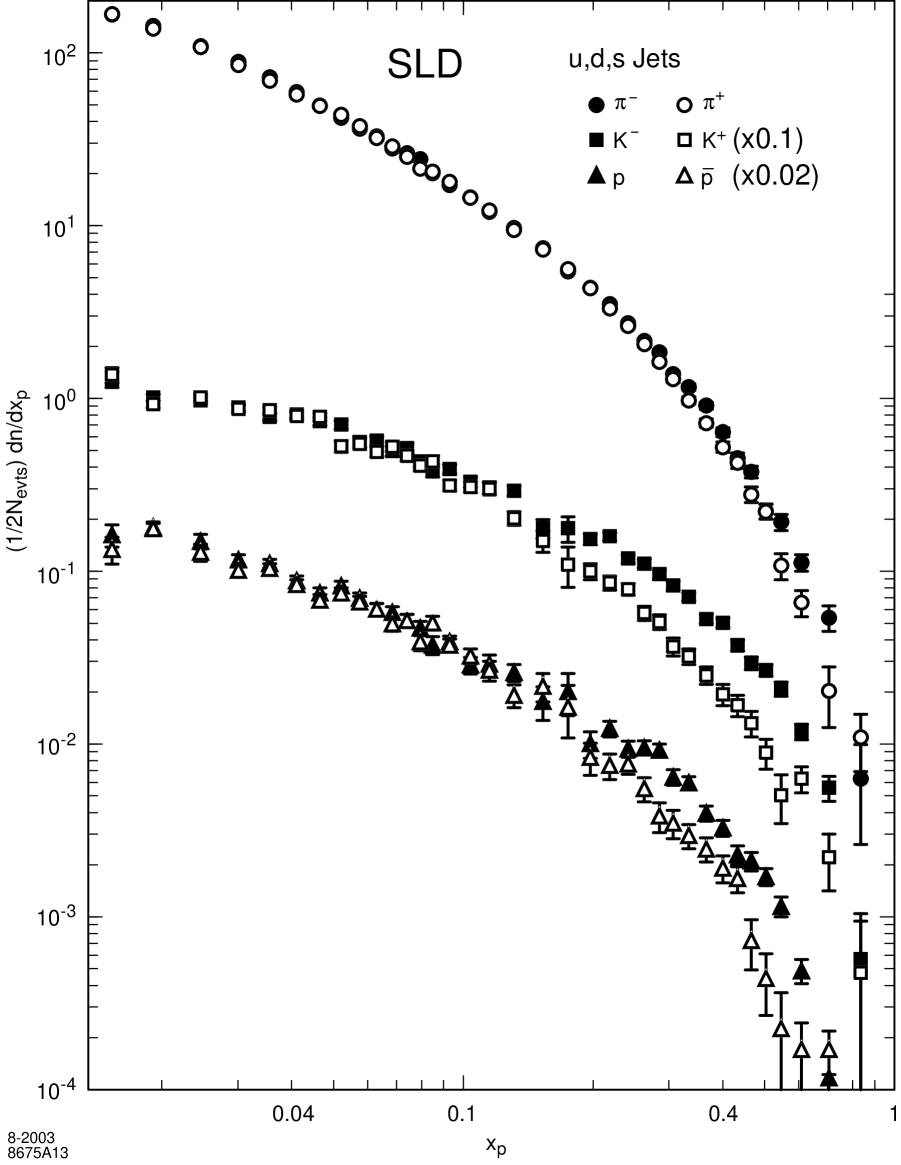
In all cases the hadron and antihadron rates are consistent at low . For kaons (protons), significant differences appear for above about 0.15 (0.2) units and grow with increasing . For pions, differences are smaller, but significant for above about 0.3, also appearing to grow with . It is convenient to show these results in the form of the difference between hadron and antihadron production normalized by the sum:
| (4) |
The common systematic errors cancel explicitly in this variable, which is shown for the hadrons , p in fig. 14 and listed in tables 12–13. A value of zero corresponds to equal production of hadron and antihadron, whereas a value of (–)1 corresponds to complete dominance of (anti)particle production in light quark jets.
The results for the protons afford the most straightforward interpretation. Since baryons contain valence quarks and not antiquarks, the positive values of for are clear evidence for the production of leading protons. The data are consistent with a steady increase with to a plateau of for , although the errors on the highest points are quite large. For the data are consistent, within common systematic errors, with equal production of baryons and antibaryons, however it must be noted that the contribution from non-leading hadrons is very high in this region and we cannot exclude that some leading baryons are produced at low .
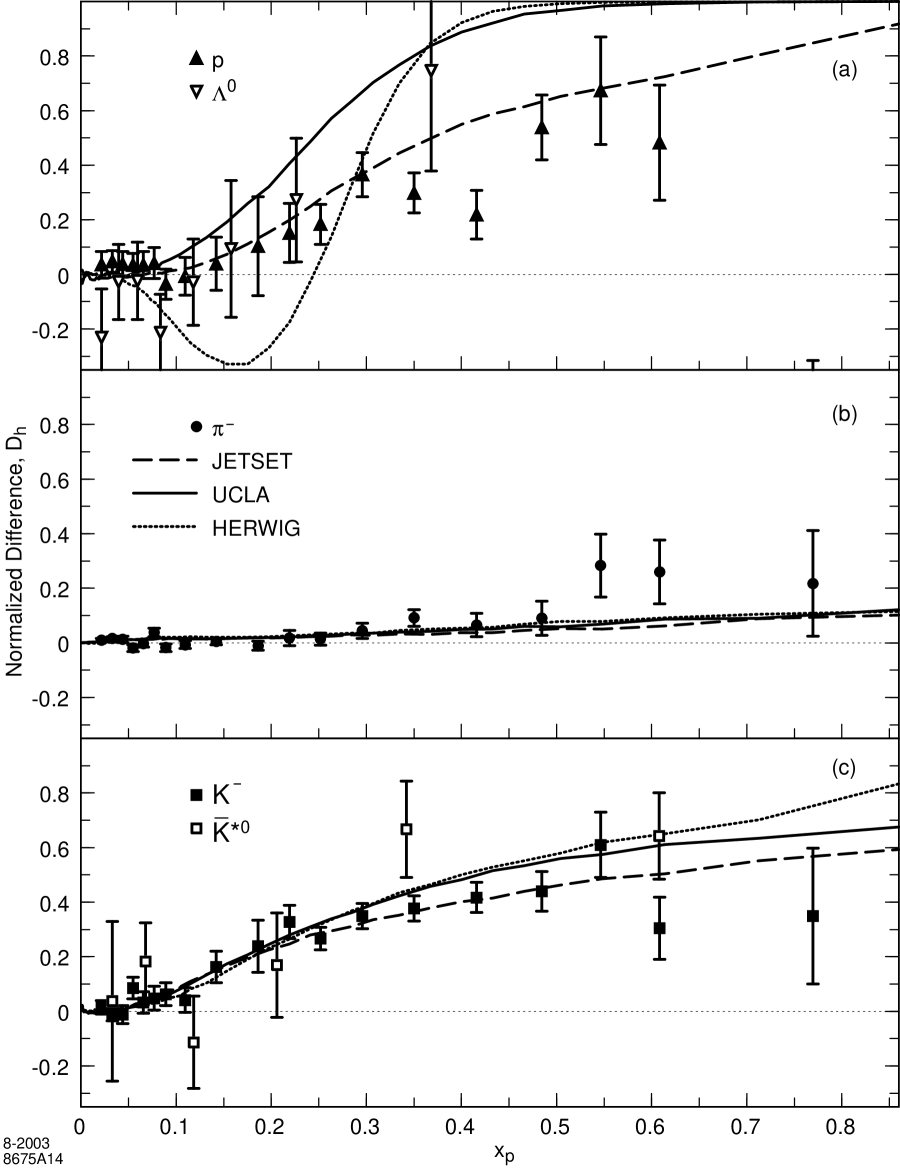
The interpretation of our results for mesons is more complicated, since a meson contains one valence quark along with one valence antiquark. In SM decays all primary down-type quarks are produced equally and with the same forward-backward asymmetry, so that if a leading neutral hadron such as () were produced equally in and jets then we would measure to be zero. We previously measured [12] a significantly positive value (see fig. 14) at high , indicating both that there is leading production and that more leading are produced in jets than in jets. This is an expected consequence of strangeness suppression in the hadronization process. That is, it is expected to be less likely for an pair to pop out of the vacuum and the to pair up with an initial than it is for a pair to pop out and the to pair up with the initial .
In the case of charged mesons such as (), there is a nonzero dilution of leading particle effects because of the different branching ratios and forward-backward asymmetries of up- and down-type quarks. Assuming SM couplings to the , equal production of leading in -jets and in -jets, and no contribution from -jets, we calculate a dilution factor for this analysis of 0.27. That is, we would expect to observe .
Our measured are significantly positive at high , indicating leading pion production. The data give no information on the relative contributions of the three light flavors, but are consistent with 0.27 at all , and hence with the notion that leading pion effects in and jets are of similar strength to those of leading baryons in all light quark jets. Our measured are consistently positive for , and well above both 0.27 and at high . This indicates both production of leading charged kaons and greater production of leading in -jets than in -jets.
The predictions of the three models are also shown in fig. 14. For protons, the HERWIG prediction drops below zero for , then rises rapidly to unity at higher ; this structure is inconsistent with our data. The UCLA prediction also rises to unity at high , becoming inconsistent with the data for 0.25. The JETSET prediction is consistent with the data. For the mesons, all models predict positive values of and even at very low ; they are all consistent with our data in that region, but we are not able to resolve the difference from zero. At high , all three predictions for lie roughly 2 below the data, and the measured favor the JETSET prediction slightly over those of HERWIG and UCLA.
10 Summary and Conclusions
We have improved our measurements of the production of the charged hadron species , and p/, as well as that of inclusive stable charged particles, in hadronic decays, taking advantage of the sample of 400,000 decays recorded with the upgraded vertex detector to reduce both the statistical and systematic errors substantially. The SLD Cherenkov Ring Imaging Detector enabled the clean and efficient identification of charged tracks over a wide momentum range, yielding precise measurements of their total and differential production rates. Our measurements in flavor-inclusive hadronic decays are consistent with, complementary to, and in some regions more precise than previous measurements. Deficiencies in popular hadronization models have been confirmed.
The precision of the vertex detector allowed us to isolate very high-purity light-, - and -tagged event samples, and to compare production characteristics of the hadron species in light-, - and -flavor events. Significant differences between flavors were found, consistent with expectations based on the known properties of and hadron production and decay. The known problems with hadronization models were all present in the light-flavor events, confirming that they are indeed in the hadronization itself and not just artifacts of heavy hadron modelling. Additional problems with the models were observed in - and -flavor events.
The shape of the distribution near its peak for each hadron species in events of each flavor is consistent with the Gaussian form predicted by MLLA QCDLPHD. For - and -flavor events, however, the Gaussian form cannot accommodate the data over a wider range without the addition of very large distortion terms. In light-flavor events, the Gaussian with small additional distortion terms is able to describe the data over a wider range. The peak positions for each hadron species in light-flavor events are more consistent with a monotonic dependence on hadron mass than those in flavor-inclusive events. Our data are thus consistent with the predictions of MLLA QCD for the light flavors, and indicate that the presence of heavy hadrons distorts the observed spectra.
Using the large forward-backward asymmetry induced by the polarized SLC electron beam to separate light quark from light antiquark hemispheres, we have compared hadron and antihadron production in light quark jets. A large excess of proton over antiproton production at high is direct evidence for the production of leading baryons, i.e. baryons that carry the quantum numbers of the quark that initiated the jet. A similarly large excess of over production indicates not only leading kaon production but also that leading kaons are produced more often from initial quarks than from initial quarks. A smaller excess of over production was also observed. This is expected if leading pions account for a large fraction of high momentum pion production but with equal rates from initial and jets: and events then contribute to the observed difference with opposite signs, but since down-type quarks are produced more often and with a higher electroweak asymmetry than up-type quarks, a net positive difference is observed. These data provide unique and stringent tests of hadronization models. All models tested were able to reproduce the pion and kaon data, though the latter favor the JETSET model over the other two; JETSET is also consistent with the proton data, but the other two models predict values much higher than the data for 0.3.
Acknowledgements
We thank the personnel of the SLAC accelerator department and the technical staffs of our collaborating institutions for their outstanding efforts on our behalf.
References
- [1] See e.g. R.K. Ellis, D.A. Ross, A.E. Terrano, Nucl. Phys. B178 (1981) 421.
- [2] S. Moretti, Phys. Lett. B420 (1998) 367.
- [3] T.I. Azimov, Y.L. Dokshitzer, V.A. Khoze and S.I. Troyan, Z. Phys. C27 (1985) 65.
- [4] G. Marchesini and B.R. Webber, Nucl. Phys. B238 (1984) 1.
- [5] See e.g. B.A. Kniehl, G. Kramer and B. Pötter, Nucl. Phys. B582 (2000) 514.
- [6] D.H. Saxon, High Energy Electron-Positron Physics, Eds. A. Ali and P. Söding, World Scientific (1988), p. 539.
- [7] A. Böhrer, Phys. Rep. 291 (1997) 107.
- [8] Particle Data Group, K. Hagiwara, et al., Phys. Rev. D66 (2002) 010001.
-
[9]
SLD Collab., K. Abe, et al., Phys. Lett. B386 (1996) 475;
DELPHI Collab., P. Abreu, et al., Phys. Lett. B347 (1995) 447;
SLD Collab., K. Abe et al., Phys. Rev. Lett. 72 (1994) 3145. - [10] OPAL Collab., K. Akerstaff et al., E. Phys. J C7 (1999) 369.
- [11] SLD Collab., K. Abe et al., Phys. Rev. Lett. 78 (1997) 3442.
- [12] SLD Collab., K. Abe et al., Phys. Rev. D59 (1999) 52001.
- [13] OPAL Collab., G. Abbiandi et al., Eur. Phys. J. C16 (2000) 407.
- [14] G. Marchesini et al., Comp. Phys. Comm. 67 (1992) 465.
- [15] T. Sjöstrand, Comp. Phys. Comm. 82 (1994) 74.
- [16] S. Chun and C. Buchanan, Phys. Rep. 292 (1998) 239.
- [17] SLD Design Report, SLAC-Report 273 (1984).
- [18] M.D. Hildreth et al., Nucl. Inst. Meth. A367 (1995) 111.
- [19] C. J. S. Damerell et al., Nucl. Inst. Meth. A400 (1997) 287.
- [20] K. Abe et al., Nucl. Inst. Meth. A343 (1994) 74.
- [21] D. Axen et al., Nucl. Inst. Meth. A238 (1993) 472.
-
[22]
S. Brandt et al., Phys. Lett. 12 (1964) 57;
E. Farhi, Phys. Rev. Lett. 39 (1977) 1587. - [23] SLD Collab., K. Abe et al., Phys. Rev. Lett. 73 (1994) 25.
- [24] H.J. Kang, Ph. D. Thesis, Rutgers University, SLAC-R-590 (2002).
- [25] D.J. Jackson, Nucl. Inst. Meth. A388 (1997) 247.
- [26] SLD Collaboration, K. Abe et al., Phys. Rev. Lett. 79 (1997) 590.
- [27] ALEPH Collab., R. Barate et al., Phys. Rept. 294 (1998) 1.
- [28] DELPHI Collab., P. Abreu et al., E. Phys. J C5 (1998) 585.
- [29] SLD Collab., K. Abe et al., Phys. Rev. Lett. 86 (2001) 1162.
- [30] K. Abe et al., Nucl. Inst. and Meth. A371 (1996) 195.
- [31] T.J. Pavel, Ph.D. Thesis, Stanford University, January 1997; SLAC-Report-495.
- [32] OPAL Collab., P.D. Acton et al., Z. Phys. C63 (1994) 181.
- [33] See SLD Collab., K. Abe, et al., Phys. Rev. D65 (2002) 092006, and references therein.
∗∗List of Authors
Koya Abe,(25) Kenji Abe,(15) T. Abe,(22) I. Adam,(22) H. Akimoto,(22) D. Aston,(22) K.G. Baird,(11) C. Baltay,(31) H.R. Band,(30) T.L. Barklow,(22) J.M. Bauer,(12) G. Bellodi,(17) R. Berger,(22) G. Blaylock,(11) J.R. Bogart,(22) G.R. Bower,(22) J.E. Brau,(16) M. Breidenbach,(22) W.M. Bugg,(24) D. Burke,(22) T.H. Burnett,(29) P.N. Burrows,(19) A. Calcaterra,(8) R. Cassell,(22) A. Chou,(22) H.O. Cohn,(24) J.A. Coller,(4) M.R. Convery,(22) V. Cook,(29) R.F. Cowan,(13) G. Crawford,(22) C.J.S. Damerell,(21) M. Daoudi,(22) S. Dasu,(30) N. de Groot,(2) R. de Sangro,(8) D.N. Dong,(13) M. Doser,(22) R. Dubois,(22) I. Erofeeva,(14) V. Eschenburg,(12) E. Etzion,(30) S. Fahey,(5) D. Falciai,(8) J.P. Fernandez,(27) K. Flood,(11) R. Frey,(16) E.L. Hart,(24) K. Hasuko,(25) S.S. Hertzbach,(11) M.E. Huffer,(22) X. Huynh,(22) M. Iwasaki,(16) D.J. Jackson,(21) P. Jacques,(20) J.A. Jaros,(22) Z.Y. Jiang,(22) A.S. Johnson,(22) J.R. Johnson,(30) R. Kajikawa,(15) M. Kalelkar,(20) H.J. Kang,(20) R.R. Kofler,(11) R.S. Kroeger,(12) M. Langston,(16) D.W.G. Leith,(22) V. Lia,(13) C. Lin,(11) G. Mancinelli,(20) S. Manly,(31) G. Mantovani,(18) T.W. Markiewicz,(22) T. Maruyama,(22) A.K. McKemey,(3) R. Messner,(22) K.C. Moffeit,(22) T.B. Moore,(31) M. Morii,(22) D. Muller,(22) V. Murzin,(14) S. Narita,(25) U. Nauenberg,(5) H. Neal,(31) G. Nesom,(17) N. Oishi,(15) D. Onoprienko,(24) L.S. Osborne,(13) R.S. Panvini,(28) C.H. Park,(23) I. Peruzzi,(8) M. Piccolo,(8) L. Piemontese,(7) R.J. Plano,(20) R. Prepost,(30) C.Y. Prescott,(22) B.N. Ratcliff,(22) J. Reidy,(12) P.L. Reinertsen,(27) L.S. Rochester,(22) P.C. Rowson,(22) J.J. Russell,(22) O.H. Saxton,(22) T. Schalk,(27) B.A. Schumm,(27) J. Schwiening,(22) V.V. Serbo,(22) G. Shapiro,(10) N.B. Sinev,(16) J.A. Snyder,(31) H. Staengle,(6) A. Stahl,(22) P. Stamer,(20) H. Steiner,(10) D. Su,(22) F. Suekane,(25) A. Sugiyama,(15) A. Suzuki,(15) M. Swartz,(9) F.E. Taylor,(13) J. Thom,(22) E. Torrence,(13) T. Usher,(22) J. Va’vra,(22) R. Verdier,(13) D.L. Wagner,(5) A.P. Waite,(22) S. Walston,(16) A.W. Weidemann,(24) E.R. Weiss,(29) J.S. Whitaker,(4) S.H. Williams,(22) S. Willocq,(11) R.J. Wilson,(6) W.J. Wisniewski,(22) J.L. Wittlin,(11) M. Woods,(22) T.R. Wright,(30) R.K. Yamamoto,(13) J. Yashima,(25) S.J. Yellin,(26) C.C. Young,(22) H. Yuta.(1)
(1)Aomori University, Aomori, 030 Japan, (2)University of Bristol, Bristol, United Kingdom, (3)Brunel University, Uxbridge, Middlesex, UB8 3PH United Kingdom, (4)Boston University, Boston, Massachusetts 02215, (5)University of Colorado, Boulder, Colorado 80309, (6)Colorado State University, Ft. Collins, Colorado 80523, (7)INFN Sezione di Ferrara and Universita di Ferrara, I-44100 Ferrara, Italy, (8)INFN Laboratori Nazionali di Frascati, I-00044 Frascati, Italy, (9)Johns Hopkins University, Baltimore, Maryland 21218-2686, (10)Lawrence Berkeley Laboratory, University of California, Berkeley, California 94720, (11)University of Massachusetts, Amherst, Massachusetts 01003, (12)University of Mississippi, University, Mississippi 38677, (13)Massachusetts Institute of Technology, Cambridge, Massachusetts 02139, (14)Institute of Nuclear Physics, Moscow State University, 119899 Moscow, Russia, (15)Nagoya University, Chikusa-ku, Nagoya, 464 Japan, (16)University of Oregon, Eugene, Oregon 97403, (17)Oxford University, Oxford, OX1 3RH, United Kingdom, (18)INFN Sezione di Perugia and Universita di Perugia, I-06100 Perugia, Italy, (19)Queen Mary, University of London, London, E1 4NS United Kingdom, (20)Rutgers University, Piscataway, New Jersey 08855, (21)Rutherford Appleton Laboratory, Chilton, Didcot, Oxon OX11 0QX United Kingdom, (22)Stanford Linear Accelerator Center, Stanford University, Stanford, California 94309, (23)Soongsil University, Seoul, Korea 156-743, (24)University of Tennessee, Knoxville, Tennessee 37996, (25)Tohoku University, Sendai, 980 Japan, (26)University of California at Santa Barbara, Santa Barbara, California 93106, (27)University of California at Santa Cruz, Santa Cruz, California 95064, (28)Vanderbilt University, Nashville,Tennessee 37235, (29)University of Washington, Seattle, Washington 98105, (30)University of Wisconsin, Madison,Wisconsin 53706, (31)Yale University, New Haven, Connecticut 06511.