Permanent address ]C.P.P. Marseille/C.N.R.S., France
Search for the Rare Decay
A. Alavi-Harati
University of Wisconsin, Madison, Wisconsin 53706
T. Alexopoulos
University of Wisconsin, Madison, Wisconsin 53706
M. Arenton
The Department of Physics and Institute of Nuclear and
Particle Physics, University of Virginia,
Charlottesville, Virginia 22901
R.F. Barbosa
Universidade de Sao Paolo, Sao Paolo, Brazil 05315-970
A.R. Barker
University of Colorado, Boulder, Colorado 80309
M. Barrio
The Enrico Fermi Institute, The University of Chicago,
Chicago, Illinois 60637
L. Bellantoni
Fermi National Accelerator Laboratory,
Batavia, Illinois 60510
A. Bellavance
Rice University, Houston, Texas 77005
E. Blucher
The Enrico Fermi Institute, The University of Chicago,
Chicago, Illinois 60637
G.J. Bock
Fermi National Accelerator Laboratory,
Batavia, Illinois 60510
C. Bown
The Enrico Fermi Institute, The University of Chicago,
Chicago, Illinois 60637
S. Bright
The Enrico Fermi Institute, The University of Chicago,
Chicago, Illinois 60637
E. Cheu
University of Arizona, Tucson, Arizona 85721
R. Coleman
Fermi National Accelerator Laboratory,
Batavia, Illinois 60510
M.D. Corcoran†Rice University, Houston, Texas 77005
B. Cox
The Department of Physics and Institute of Nuclear and
Particle Physics, University of Virginia,
Charlottesville, Virginia 22901
A.R. Erwin
University of Wisconsin, Madison, Wisconsin 53706
C.O. Escobar
Universidade Estadual de Campinas, Campinas,
Brazil 13083-970
R. Ford
Fermi National Accelerator Laboratory,
Batavia, Illinois 60510
A. Glazov
The Enrico Fermi Institute, The University of Chicago,
Chicago, Illinois 60637
A. Golossanov
The Department of Physics and Institute of Nuclear and
Particle Physics, University of Virginia,
Charlottesville, Virginia 22901
P. Gouffon
Universidade de Sao Paolo, Sao Paolo, Brazil 05315-970
J. Graham
The Enrico Fermi Institute, The University of Chicago,
Chicago, Illinois 60637
J. Hamm
University of Arizona, Tucson, Arizona 85721
K. Hanagaki
Osaka University, Toyonaka, Osaka 560-0043 Japan
Y.B. Hsiung
Fermi National Accelerator Laboratory,
Batavia, Illinois 60510
H. Huang
University of Colorado, Boulder, Colorado 80309
V. Jejer
The Department of Physics and Institute of Nuclear and
Particle Physics, University of Virginia,
Charlottesville, Virginia 22901
D.A. Jensen
Fermi National Accelerator Laboratory,
Batavia, Illinois 60510
R. Kessler
The Enrico Fermi Institute, The University of Chicago,
Chicago, Illinois 60637
H.G.E. Kobrak
University of California at San Diego, La Jolla,
California 92093
K. Kotera
Osaka University, Toyonaka, Osaka 560-0043 Japan
J. LaDue
University of Colorado, Boulder, Colorado 80309
N. Lai
The Enrico Fermi Institute, The University of Chicago,
Chicago, Illinois 60637
A. Ledovskoy
The Department of Physics and Institute of Nuclear and
Particle Physics, University of Virginia,
Charlottesville, Virginia 22901
P.L. McBride
Fermi National Accelerator Laboratory,
Batavia, Illinois 60510
E. Monnier
[
The Enrico Fermi Institute, The University of Chicago,
Chicago, Illinois 60637
K.S. Nelson
The Department of Physics and Institute of Nuclear and
Particle Physics, University of Virginia,
Charlottesville, Virginia 22901
H. Nguyen
Fermi National Accelerator Laboratory,
Batavia, Illinois 60510
H. Ping
University of Wisconsin, Madison, Wisconsin 53706
V. Prasad
The Enrico Fermi Institute, The University of Chicago,
Chicago, Illinois 60637
X.R. Qi
Fermi National Accelerator Laboratory,
Batavia, Illinois 60510
B. Quinn
The Enrico Fermi Institute, The University of Chicago,
Chicago, Illinois 60637
E.J. Ramberg
Fermi National Accelerator Laboratory,
Batavia, Illinois 60510
R.E. Ray
Fermi National Accelerator Laboratory,
Batavia, Illinois 60510
M. Ronquest
The Department of Physics and Institute of Nuclear and
Particle Physics, University of Virginia,
Charlottesville, Virginia 22901
E. Santos
Universidade de Sao Paolo, Sao Paolo, Brazil 05315-970
K. Senyo
Osaka University, Toyonaka, Osaka 560-0043 Japan
P. Shanahan
Fermi National Accelerator Laboratory,
Batavia, Illinois 60510
J. Shields
The Department of Physics and Institute of Nuclear and
Particle Physics, University of Virginia,
Charlottesville, Virginia 22901
W. Slater
University of California at Los Angeles, Los Angeles,
California 90095
D.E. Smith
The Department of Physics and Institute of Nuclear and
Particle Physics, University of Virginia,
Charlottesville, Virginia 22901
N. Solomey
The Enrico Fermi Institute, The University of Chicago,
Chicago, Illinois 60637
E.C. Swallow
The Enrico Fermi Institute, The University of Chicago,
Chicago, Illinois 60637
Elmhurst College, Elmhurst, Illinois 60126
S.A. Taegar
University of Arizona, Tucson, Arizona 85721
R.J. Tesarek
Fermi National Accelerator Laboratory,
Batavia, Illinois 60510
P.A. Toale
University of Colorado, Boulder, Colorado 80309
R. Tschirhart
Fermi National Accelerator Laboratory,
Batavia, Illinois 60510
C. Velissaris
University of Wisconsin, Madison, Wisconsin 53706
Y.W. Wah
The Enrico Fermi Institute, The University of Chicago,
Chicago, Illinois 60637
J. Wang
University of Arizona, Tucson, Arizona 85721
H.B. White
Fermi National Accelerator Laboratory,
Batavia, Illinois 60510
J. Whitmore
Fermi National Accelerator Laboratory,
Batavia, Illinois 60510
M. Wilking
University of Colorado, Boulder, Colorado 80309
B. Winstein
The Enrico Fermi Institute, The University of Chicago,
Chicago, Illinois 60637
R. Winston
The Enrico Fermi Institute, The University of Chicago,
Chicago, Illinois 60637
E.T. Worcester
The Enrico Fermi Institute, The University of Chicago,
Chicago, Illinois 60637
T. Yamanaka
Osaka University, Toyonaka, Osaka 560-0043 Japan
R.F. Zukanovich
Universidade de Sao Paolo, Sao Paolo, Brazil 05315-970
Abstract
The KTeV/E799 experiment at Fermilab has searched for the
rare kaon decay . This mode is
expected to have a significant CP violating component. The measurement of its
branching ratio could support the Standard Model or could indicate the
existence of new physics. This Letter reports new results from the
1999-2000 data set.
One event is observed with an expected background at
0.99 0.35 events. We set a limit on the branching ratio of
3.5 at the 90% confidence level.
Combining with the previous result based on the dataset taken
in 1997 yields the final KTeV result:
BR() 2.8 at 90% C.L.
pacs:
13.20.Eb, 11.30.Er, 14.40.Aq
The decay has long been studied in the context
of Standard Model CP violation (CPV) and has more recently been of interest
in certain new physics scenarios.
In the Standard Model, there are direct and indirect CPV contributions to
the amplitude, plus an interference term leo1 ; old2 ; deip98 .
The indirect component is known from the measurement na48talk of
BR() and appears to dominate.
The direct component has been estimated to be about 3 to 6 ,
and the two CPV contributions together give
BR( in the range
8 to 45 . There is also a CP conserving amplitude
through states which can be determined
from measurements of elliott ,leo2 .
In recent work, Buchalla, D’Ambrosio, and Isidori newbuchalla
argue that the CP-conserving contribution is negligible. They
predict a Standard Model branching ratio
,
dominated by CPV, with a 40% contribution from direct CPV, through
the interference term.
Observation of at rates substantially higher than
Standard Model expectations
would signal new physics. In a large class of SUSY models,
a branching ratio enhancement of up to five times the Standard Model
expectation is considered likely old4 , but values as high as
10-10 are not entirely ruled out. The existing experimental
limit us has been used to constrain squark masses Guido
and SUSY contributions Messina to the charge asymmetry in
. The implications of a specific
model with extra dimensions for
and related processes have been investigated in extradimensions .
The existing experimental upper limit on BR() of
5.1 at the 90% confidence level (CL) is based on the 1997
KTeV dataset. In this Letter we present an improved limit based on data
collected during 1999-2000.
At KTeV, 800 GeV/c protons from the Tevatron were directed onto a
BeO target
to create two parallel beams. The beams entered a 65m long vacuum tank,
which defines the fiducial volume for accepted decays.
Charged particles were detected by two pairs of drift chambers
separated by an analysis magnet providing a transverse momentum
kick of 0.150 GeV/c. Photon vetoes positioned around the
vacuum decay region and
the spectrometer vetoed particles escaping the drift chambers.
The KTeV detector is further described in detector .
Powerful discrimination against charged pions, which could fake electrons, was
provided by a set of transition radiation detectors (TRDs) behind the
drift chambers. Each
of the eight planes was composed of a polypropylene felt radiator paired with a
double-plane multiwire proportional chamber containing an 80%-20% admixture
of Xenon and CO2. TRD cuts resulted in a pion rejection factor of
about 50:1, as measured in a sample of decays.
These cuts were over 94% efficient for electrons. A more detailed
description of the TRD may be found in greg_thesis .
Downstream of the TRDs were the trigger hodoscopes.
The trigger required hits in the hodoscope planes and the spectrometer
consistent with the passage of two oppositely charged particles.
The trigger hodoscopes were followed by the CsI electromagnetic
calorimeter calorimeter , which had an energy resolution
.
Electrons were identified by requiring the
ratio of the energy measured in the calorimeter (E) to the momentum as
measured in the spectrometer (p) to be consistent with one; this cut
rejected about 99.5% of charged pions.
A detailed package of Monte Carlo simulation routines was used to study
detector geometry and performance, as
well as various trigger and analysis selection criteria.
The programs were also used to simulate background events and tailor cuts
to optimize the signal to background ratio.
The final state consists of two photons, which come from the
decay, and two electrons.
candidates exhibit the following signature:
two tracks of opposite charge originating from a common vertex, and
depositing all of their
energy in the calorimeter; and two other
clusters in the calorimeter, which, when taken as photons originating from
the vertex, have a mass consistent with the mass.
events,
where indicates the pion Dalitz decay , are
used to measure the flux and normalize the acceptance calculation.
This mode has a signature similar to , with the addition of a photon.
Recorded and events satisfied the following
trigger requirements. There must have been at least two separate
track candidates in each drift chamber plane. There must not have
been hadronic showers in the calorimeter, and the event must have
deposited little energy in the photon vetoes. There must have been a
minimum number of clusters in the calorimeter with energy greater than
1 GeV, as determined by the hardware cluster counting
system colin_bown . For , this number was four
clusters and for it was five.
In the offline event reconstruction and analysis, events are
required to satisfy further selection criteria.
The charged tracks must point to calorimeter clusters.
To identify these tracks as electrons, the ratio of the energy of the
matched cluster as measured in the CsI (E) to track momentum as measured by
the drift chambers (p) must lie in the range 0.95 1.05. The track
positions must have sufficient clearance from the CsI edges. The decay
vertex ()
has to be within the vacuum decay volume: 96 m 158 m.
The recontructed kaon
momentum is required to be between 20.3 and 216 GeV/c.
Tracks are required to be well separated (greater than 1 cm apart at the first
drift chamber) and the opening angle between the two tracks
has to be larger than 2.25 mrad
in the lab frame.
Further selection cuts for the sample included
requirements on the invariant masses of the , ,
and combinations, and on the momentum transverse
to the flight direction,
. A well-reconstructed kaon should have a close to zero.
Using the calculated acceptance and
known branching ratio for decays, the total number
of decays in the data sample is
(349.0 2.8stat 21.6syst 11.8BR)
109.
Several backgrounds with the final state
exist and can mimic the signal.
The first source of background is where both charged
pions shower in the calorimeter and appear to be electrons.
To remove this background, the mass of the event, under the
hypothesis that the tracks were pions, is required to exceed 520 MeV/c2.
The second source of background is and
with one or two Dalitz decays of a
and with one or more photons undetected.
To ensure that all decay products are observed,
1000 (MeV/c)2 is required.
Additional background events of this type are removed by requiring that
the invariant mass of the two electrons, , exceed 140 MeV/c2.
However, there are some backgrounds involving two decays in which
only one electron and one positron are reconstructed with a high mass.
These events might also include coincident accidental activity.
These background events are rejected by requiring that be less than
362.7 MeV/c2.
The third source of background is
where the pion fakes an electron by showering in the calorimeter,
and photons are radiated by the electron or are accidentals.
This background is rejected by examining the
response of the TRDs for both tracks.
After these cuts are applied, the single largest remaining
background is the radiative Dalitz decay
with invariant mass of the two photons, ,
consistent with the mass.
These events come from both internal and external
bremsstrahlung; both contributions were studied in kleegg .
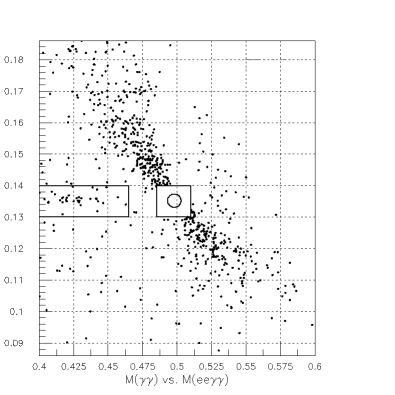
In Figure 1, is plotted against the invariant
mass of the four-particle system, .
The is determined under the assumption that the photons came from the
charged vertex, while is calculated using the “neutral vertex”,
found by applying the mass constraint to the
photon energies and positions in the calorimeter.
Better resolution is achieved for the signal
Monte Carlo using the neutral vertex, but this procedure gives the
incorrect mass
for the background, resulting in the diagonal swath in Figure 1.
Figure 1:
(charged vertex) vs. (neutral vertex) for the data
after all cuts have been applied except for the phase space cuts.
The regions appearing in the figure
are discussed in the text, and signal events in the center box have
not been plotted. Masses are in GeV/c2.
There are several distinctive regions in the vs. plane.
In order to minimize human bias in the determination of the selection criteria,
a blind analysis was performed. The
box was the region covered up until cuts were finalized, and
spans 130 140 MeV/c2 and
485 510 MeV/c2. The ellipse in the box is the signal
region, which spans 2 in the signal
Monte Carlo and distributions. In the direction,
the ellipse is 5.02 MeV/c2 wide, and in the direction it is
2.32 MeV/c2 wide.
The rectangular “strip” to the left of the box is dominated by
backgrounds from and decays with accidental s.
Missing particles in these decays cause the reconstructed
mass to be low. Because these backgrounds accumulated in the strip,
this region is not considered in the background estimation described below.
In the background estimation,
the data in Figure 1, outside the
strip and box regions, is fit to the sum of planar parts and
the sample:
() = A0 + A +
A +
Ag g()
where
g() is the distribution in the
vs. plane. The parameters were the parameters from the
fit. The non- background was well-modeled with
first-order terms. The estimated background in the signal ellipse is
38.11 1.67 events, with 0.27 0.03 event contribution from
non backgrounds.
In order to reduce this background, phase space cuts greenlee
are applied to the data. The location of these cuts is optimized by
minimizing the expected 90% C.L. branching ratio limit of ,
using the Feldman and Cousins feldman methodology. The expected
branching ratio limit is computed by randomly generating a large ensemble
of virtual experiments in which the known background sources are the only
contributions to the observed number of events. The effect of the
cuts on signal efficiency is also accounted for.
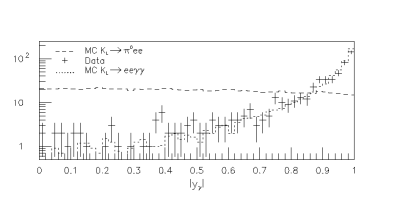
The phase space variables with the best discrimination against
background are and .
The variable
is the cosine of the angle between the decay axis and
the sum of the momenta of the two electrons, calculated in the center of
mass of the photon pair. In the signal mode,
is nearly
uniformly distributed because the pion has spin zero, but in , the
distribution is peaked at one. The variable is the minimum angle
between any photon and any electron in the kaon rest frame.
It provides good separation because in , a radiated photon
typically has a small angle with respect to the electron from which it
originated, while in , is nearly flat.
Distributions for and
in Monte Carlo
and data and Monte Carlo appear in Figure 2.
Figure 2:
(top) and (bottom)
distributions for MC and data and MC.
events come from inside the swath but outside the box.
MC are from inside the box, and the normalization is arbitrary.
The optimized phase space cut values are
and . These cuts reduce the
expected background from 38.11 1.67 events to 0.99
0.35
with a signal loss of 27%. The signal acceptance, assuming uniform
three-body phase space, is (2.749 0.013)%,
giving a single event sensitivity of 1.04 .
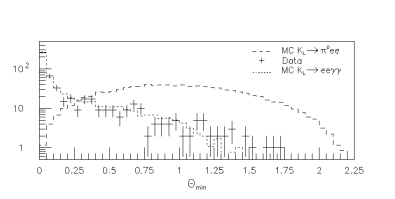
Figure 3:
vs. in GeV/c2 for the data after all cuts have been applied.
The box is open and one event appears within the signal ellipse, with a
background of 0.99 0.35 events
When the box in Fig. 1 was opened (Fig. 3), one event was observed in
the signal ellipse. Taking the background level into account, we determine
BR() 3.50 . Combining this with the previous
result yields the final KTeV result: BR() 2.8
at 90% C.L.
If instead of a uniform three-body phase space distribution for the signal
mode, we assume a vector interaction model for the direct CPV part of the
decay and allow for form factors as in us , we find for the combined 1997
and 1999 data samples an upper limit of BR()
3.4 .
If the decay is saturated by the direct
CPV component, we constrain the Wolfenstein CKM parameter
3.3. Although other measurements yield a more
stringent constraint on , it is important to make
a variety of measurements
in both the kaon system and the B system to determine if the CKM parameters
are consistent.
We gratefully acknowledge the support and effort of the Fermilab
staff and the technical staffs of the participating institutions for
their vital contributions. This work was supported in part by the U.S.
Department of Energy, The National Science Foundation and The Ministry of
Education and Science of Japan.
In addition, A.R.B. and E.B.
acknowledge support from the NYI program of the NSF; A.R.B. and E.B. from
the Alfred P. Sloan Foundation; E.B. from the OJI program of the DOE;
K.H. from the Japan Society for the Promotion of
Science; and R.F.B. from the Fundação de Amparo à
Pesquisa do Estado de São Paolo.
References
† To whom correspondence should be addressed.
(1)
J. F. Donoghue, B. R. Holstein, and G. Valencia, Phys. Rev.
D35, 2769 (1987) and citations therein.
(2)
J. F. Donoghue and F. Gabbiani, Phys. Rev. D51, 2187 (1995).
(3)
G. D’Ambrosio, G. Ecker, G. Isidori, and J. Portoles, J. High
Energy Physics, 08, 004 (1998).
(4)
M. Patel for the NA48/1 collaboration, “First Observation of the
Decay ”, CERN seminar, 10 June 2003.
(5)
A. Lai et. al, Phys. Lett. B536, 229 (2002).
Alavi-Harati et. al, Phys. Rev. Lett., 83 917 (1999).
(6)
F. Gabbiani and G. Valencia, Phys. Rev. D66, 074006 (2002).
(7)
G. Buchalla, G. D’Ambrosio, and G. Isidori, hep-ph/0308008 (2003).
(8)
A. J. Buras, G. Colangelo, G. Isidori, A. Romanino, and L. Silvestrini,
Nucl. Phys. B566, 3 (2000).
(9)
A. Alavi-Harati et al., Phys. Rev. Lett., 86, 397 (2001);
P. L. Mikelsons, Ph.D. Thesis, University of Colorado at Boulder, 1999.
(10)
D. Becirevic, V. Lubicz, G. Martinelli and F. Mescia, Phys. Lett.
B501, 98 (2002); G. D’Ambrosio and D.N. Gao, Jour. High Energy Phys.
B207, 068 (2002).
(11)
A. Messina, Phys. Lett. B538, 130 (2002).
(12)
A. J. Buras, M. Spranger, and A. Weiler, Nul. Phys. B660 225 (2003);
A. J. Buras, A. Poschenreider, M. Spranger and A. Weiler, hep-ph/0306158.
(13)
A. Alavi-Harati et al., Phys. Rev. D67, 012005 (2003).
(14)
G. E. Graham, Ph.D. Thesis, University of Chicago, 1999.
(15)
A. J. Roodman, “The KTeV Pure CsI Calorimeter”, Proceedings of the VII
International Conference on Calorimetry, World Scientific (1998).
(16)
C. Bown et al., Nucl. Inst. and Meth. A369, 248 (1996).
(17)
A. Alavi-Harati et al., Phys. Rev. D64, 012003 (2001).
(18)
H. B. Greenlee, Phys. Rev. D42, 3724 (1990).
(19)
G. J. Feldman and R. D. Cousins, Phys. Rev. D57, 3873 (1998).