UCHEP-03-01
Rare hadronic decays: probing deeper into the Standard Model
Abstract
We present recent results from the Belle experiment on rare hadronic meson decays. The results are based on a 78 fb-1 data sample and consist of branching fractions, asymmetries, and polarization amplitudes. The decays studied include two-body pseudoscalar-pseudoscalar final states (, and ); pseudoscalar-vector final states (, and ); and vector-vector final states ( and ).
1 Introduction
Rare hadronic decays are useful for probing physics beyond the Standard Model. Their amplitudes usually contain internal loops, which are sensitive to mass scales that cannot be accessed directly. Here we present recent measurements of such decays by the Belle experiment at KEK. This experiment runs at the KEKB asymmetric collider, which has a center-of-mass (CM) energy near the resonance. The results are from 78 fb-1 of data, which corresponds to pairs produced.
The Belle detector consists of a three-layer silicon vertex detector, a 50-layer central drift chamber (CDC) for charged-particle tracking, an array of silica aerogel threshold C̆herenkov counters (ACC), time-of-flight scintillation counters (TOF), a CsI(Tl) electromagnetic calorimeter (ECL), and a superconducting solenoid providing a 1.5 T magnetic field. An iron flux-return located outside the coil is instrumented with resistive plate chambers to identify muons and ’s. For details of the detector, see Ref. Abashian et al. (Belle Collaboration).
Charged tracks are identified as kaons or pions by the number of photoelectrons detected in the ACC, the specific ionization energy loss in the CDC, and, if slow enough, their time-of-flight. This information is used to calculate kaon and pion relative likelihoods and . Tracks are identified as pions or kaons based on the likelihood ratios . The efficiency for kaons is typically 84% with a pion misidentification rate of 5%; the efficiency for pions is typically 91% with a kaon misidentification rate of 10%.
For most final states there is substantial background from continuum events (). We distinguish this background from decays by first combining five modified Fox-Wolfram moments into a Fisher discriminant. This is then combined with a likelihood function for , the polar angle of the meson flight direction, and the resulting likelihood function is used to form a likelihood ratio . A mode-dependent cut on is made to significantly reduce background events. Typical cut values reject % of background with a signal efficiency of 40–70%.
The analyses presented here proceed in three steps: (a) selecting the final state of interest using to identify tracks as pions or kaons; (b) using to reject continuum background; and (c) selecting decays by cutting on the variables and , where denotes the beam energy and and denote the reconstructed momentum and energy of the candidate meson, all evaluated in the CM frame. For correctly-identified decays, and . Throughout this paper, charge-conjugate modes are included unless stated otherwise. When two errors are listed for a measurement, the first one is statistical and the second one systematic.
2 decays
These decays proceed via tree and loop diagrams, and the final states include both charged and neutral kaons and pions. Neutral kaons are identified via , and neutral pions are identified via (where the photons produce clusters in the ECL). The distributions after all selection cuts and a cut GeV/ are shown in Fig. 1. The event yields are obtained by fitting these distributions for signal, background, and other charmless decay background. Possible reflections due to misidentification are included where applicable. All fit parameters other than the normalizations are fixed: most are determined from Monte Carlo (MC) simulation, while others are determined directly from the data, usually from events in a lower sideband. The resulting event yields are listed in Table 1. The statistical significance of signals is calculated as , where is the likelihood obtained assuming no signal events and is the (maximum) likelihood obtained with signal events. For cases where no significant signal is observed, we quote a 90% C.L. upper limit using a Feldman-Cousins frequentist approach Feldman and Cousins (1998). The corresponding branching fractions are also listed in Table 1 and show the theoretically-expected hierarchy: .


| Mode | (90% C.L. limit) | |||
| 8.5 | 35.2 | |||
| 4.5 | 16.1 | |||
| 1.9 | 7.8 | |||
| 24.1 | 37.9 | |||
| 10.8 | 18.3 | |||
| 16.4 | 10.0 | |||
| 5.8 | 6.8 | |||
| 20.1 | ||||
| 1.6 | 5.9 | |||
| 1.3 | 2.9 |
The branching fractions can be used to constrain the magnitudes of the CKM phases and Abbaneo et al. (hep-ph/0304132 (2003). For such constraints, ratios of partial widths are most useful because of their reduced hadronic uncertainties. We thus use the results in Table 1 and the lifetime ratio Hagiwara et al. (PDG) to calculate the partial width ratios listed in Table 2. The fact that implies that the penguin contribution to is significant.
| Ratio | Measured Value |
|---|---|
| @ 90% C.L. | |
For the flavor-specific decays , , and , the distributions are fitted separately for and candidates to measure the asymmetry , where represents or ( or ). The results are listed in Table 3; no significant asymmetries are observed.
| Mode | 90% C.L. Interval | |||
|---|---|---|---|---|
3 decays
The decay , where represents a decaying to a eigenstate, proceeds via and transitions as shown in Fig. 2. Interference between the amplitudes gives rise to direct violation, and measuring allows one to constrain the CKM phase . The observables are Quinn and Sanda (2000):
| (1) |
where for and the ratios and are:
In these expressions, and are -even and -odd eigenstates, respectively, of the neutral meson; is the ratio of the and amplitudes shown in Fig. 2; and is their strong phase difference. The ratio is expected to be only 0.1 due to a CKM suppression factor and a color suppression factor. The ratio has been previously measured by Belle ( Abe et al. (Belle Collaboration)) and CLEO ( Bornheim et al. (CLEO Collaboration)). The results are in agreement with naive factorization: . Here we present new results for , , and ; these values can be inserted into Eq. (1) to determine the three unknowns , , and .

For this analysis mesons are reconstructed as ; mesons () as and ; and mesons () as , , , , and . The short-lived mesons are reconstructed as follows: with GeV/; with GeV/; with GeV/; and with GeV/. The resulting candidates are required to have masses within of , where is the measured mass resolution ( MeV/). The and candidates are combined to form candidates by selecting combinations with GeV/ and GeV. The event yields are obtained from fits to the distributions. The results for , , and are listed in Table 4; all asymmetries are consistent with zero. The factor can be calculated via ; the result is , which is only from zero. Since, in Eq. (1), and are always multiplied by a factor of , the value of obtained precludes setting a stringent constraint upon with the current statistics. The situation should improve with more data.
| Mode | 90% C.L. Interval | |
|---|---|---|
4 decays
The decays and also proceed via tree and loop diagrams. Theoretical calculations based on QCD factorization Ali et al. (1998); Chen et al. (1999); Du et al. (2002); Lu and Yang (2002) predict . A previous Belle measurement Lu et al. (Belle Collaboration) based on 29 fb-1 of data did not agree with this prediction, and we update that result here.
Candidate events are selected by first selecting decays. The is reconstructed from pairs having ( MeV/); each must also satisfy MeV. We then require MeV/ (), and the is paired with a , , , or to form candidates. Those candidates satisfying GeV/ and GeV are subjected to an unbinned maximum likelihood (ML) fit using and as the independent variables. The event yields resulting from the fit and the corresponding branching fractions are listed in Table 5. We note that the central value for is still greater than that for , in contrast with the theoretical prediction.
The main background is due to continuum events. To reduce this we cut on both and the helicity angle , which is defined as the angle between the flight direction and the vector perpendicular to the decay plane, in the rest frame. The cut chosen is . To confirm that signal candidates contain real decays, we relax the cut and repeat the fits for different bins. The resulting event yields are plotted in Fig. 3 and display a sharp peak at with negligible nonresonant background underneath.
| Mode | (90% C.L. limit) | ||
|---|---|---|---|
| 7.8 | |||
| 3.2 | |||
| 6.0 | |||
Since the final states are self-tagging, we divide these samples into and decays and search for a asymmetry. The quantity measured is . The event yields are determined from a two-dimensional binned fit in the - plane. The results are listed in Table 6. While is consistent with zero, is above zero, and a symmetric 90% C.L. interval excludes .
| Mode | 90% C.L. Interval | |||
|---|---|---|---|---|
5 decays and polarization
The decays and proceed only via loop diagrams () and thus are especially sensitive to new physics. Because both the and are spin-1, is a mixture of -even and -odd states; the individual components can be determined by measuring the polarization.
As a first step, decays are identified by requiring pairs of oppositely-charged tracks having and MeV/. decays are reconstructed via , , and ; the resulting two-body mass is required to be within 70 MeV/ of . () decays are selected by pairing a candidate with a () candidate and requiring that they be within the signal region () GeV/ and GeV. The window is slightly larger for decays due to shower leakage.
The dominant background is due to continuum events. There is also 5–9% contamination of decays from nonresonant , and 2–12% contamination from . The uncertainty in the instrinsic width of the is included in the systematic error.
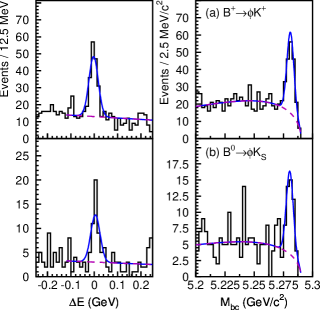
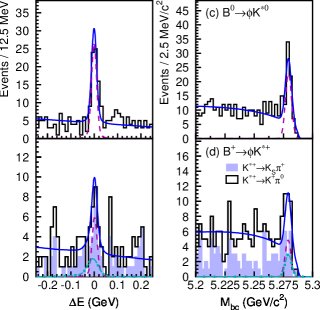
The signal yields are obtained via an unbinned ML fit with and as the independent variables. The results and corresponding branching fractions are listed in Table 7. The projections of the fits are shown in Fig. 4. For the modes, there is an additional systematic error due to uncertainty in the polarization and the corresponding uncertainty in the daughter detection efficiency.
| Mode | 90% C.L. Interval | |||
|---|---|---|---|---|
For the self-tagging modes we measure , where is or ( or ). The results are also listed in Table 7 and in all cases are consistent with zero.
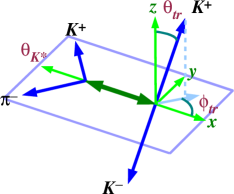
The polarization of the in decays is measured using the transversity basis Dunietz et al. (1991). In this basis the is at rest. The - plane is defined by the daughters, with the axis along the direction of the (see Fig. 5). The angle is that between the direction and the daughter. The angles and are the polar and azimuthal angles, respectively, of the daughter of the . The decay distribution is given by Abe et al. (2001):
| (2) | |||||
where , , and are the complex amplitudes of the three helicity states, and for decays. The amplitude denotes the longitudinal polarization of the final state, and () denotes the transverse polarization along the axis. Note that . The value of () is the -odd (-even) fraction of the decay.
The complex amplitudes , , and are determined via an unbinned ML fit to the candidates within the - signal region; the probability density function for signal is given by Eq. (2). By convention, the value of Arg() is set to zero and is calculated from the normalization constraint. The results of the fit are: , , Arg() , and Arg() . The projections of the fit are shown in Fig. 5. The systematic errors include the (slow) pion detection efficiency (3–6%) and background from higher states (6–9%). The value of obtained indicates that both -odd and -even components of are sizable.
6 decays
The decay proceeds via loop and tree diagrams and contains two vector mesons in the final state. Angular correlations among the decay products () can be used to search for - and -violating effects. In the final state, both ’s are either longitudinally or transversely polarized; the corresponding amplitudes are denoted and , respectively.
In this analysis, states are reconstructed by combining three charged pions with one neutral pion. The charged pions are required to have GeV/. Candidate ’s are reconstructed from pairs having MeV/; each must also satisfy MeV in the barrel (endcap) region. Candidate mesons are identified via or pairs having GeV/. candidates are identified by requiring GeV/ and GeV. The amplitude gives rise to asymmetric decays, i.e., one pion has high momentum and the other has low momentum. The amplitude gives rise to symmetric decays. Thus, the state has a lower reconstruction efficiency and a resolution 15% broader than that for .
There are large backgrounds due to continuum events. To reduce these we cut on both and the thrust angle , which is the angle between the thrust axis of tracks originating from the candidate and that of the remaining tracks in the event. The cut chosen is . The overall rejection of continuum events is 99.5%, with a signal efficiency of 28%. There is also a small level of background from processes and rarer decays such as and ; these tend to be displaced in .
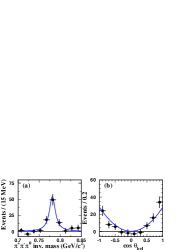
The resulting and distributions are shown in Fig. 6. The event yields are determined by fitting in . The fit yields events with a statistical significance ( ) of 5.3. Fitting the distributions for different bins gives the event yields plotted in Fig. 7. These distributions agree well with MC expectations and show little nonresonant background beneath the peaks.


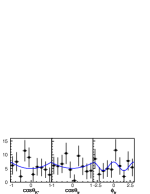
The relative strengths of and are determined by studying distributions of the helicity angle , which is the angle between the flight direction in the rest frame and the flight direction in the rest frame. The signal yields determined from fits for different bins are plotted in Fig. 8 for both the and . We perform simultaneous binned fits to these distributions using MC expectations for the and helicity states. The fit yields the fraction of final states that are longitudinally polarized:
This result shows that the state dominates, which is consistent with theoretical expectations Aleksan et al. (1995). The systematic error includes uncertainties in signal yield extraction and the polarization dependence of the detection efficiency. Based on this polarization ratio and the MC-determined reconstruction efficiencies of the two helicity states, we calculate .


We separate the candidate events into and subsamples and fit these subsamples individually. The resulting event yields are and , respectively. The asymmetry is , which is consistent with zero.
7 Summary
With 78 fb-1 of data the Belle experiment has:
-
•
updated the branching fractions and asymmetries for , , and decays;
-
•
measured the asymmetries in decays, where represents a decaying to a or eigenstate, and investigated the possibility of using the measured asymmetries to constrain the CKM phase ;
-
•
updated the branching fractions and asymmetries for and decays;
-
•
measured the branching fractions for and decays and, for the latter, measured the polarization amplitudes , , and in the transversity basis;
-
•
measured the branching fraction for and the helicity amplitudes and . This is the first reported observation of this decay.
Most results are consistent with theoretical expectations, although some channels show interesting and possibly important discrepancies at the level. We look forward to investigating these further (and refining all of these measurements) with more data.
References
- Abashian et al. (Belle Collaboration) Abashian et al. (Belle Collaboration), A., Nucl. Instr. Meth. A, 479, 117 (2002).
- Feldman and Cousins (1998) Feldman, G. J., and Cousins, R. D., Phys. Rev. D, 57, 3873 (1998).
- Abbaneo et al. (hep-ph/0304132 (2003) Abbaneo et al., D., “The CKM Matrix and The Unitarity Triangle,” in Proceedings of the First Workshop on the CKM Unitarity Triangle, 13-16 Feb. 2002, edited by M. Battaglia, A. J. Buras, P. Gambino, and A. Stocchi, CERN, hep-ph/0304132 (2003), pp. 291–308.
- Hagiwara et al. (PDG) Hagiwara et al. (PDG), K., Phys. Rev. D, 66, 010001 (2002).
- Abe et al. (Belle Collaboration) Abe et al. (Belle Collaboration), K., Phys. Rev. D, 68, 012001 (2003).
- Quinn and Sanda (2000) Quinn, H., and Sanda, A. I., Eur. Phys. J., C15, 626 (2000).
- Abe et al. (Belle Collaboration) Abe et al. (Belle Collaboration), K., Phys. Rev. Lett., 87, 111801 (2001).
- Bornheim et al. (CLEO Collaboration) Bornheim et al. (CLEO Collaboration), A., Tech. Rep. CLNS 03/1816, hep-ex/0302026 (2003).
- Ali et al. (1998) Ali, A., Kramer, G., and Lu, C. D., Phys. Rev. D, 58, 094009 (1998).
- Chen et al. (1999) Chen, Y. H., Cheng, H. Y., Tseng, B., and Yang, K. C., Phys. Rev. D, 60, 094014 (1999).
- Du et al. (2002) Du, D. S., Gong, H. J., Sun, J. F., and Zhu, G. H., Phys. Rev. D, 65, 094025 (2002).
- Lu and Yang (2002) Lu, C. D., and Yang, M. Z., Eur. Phys. J., C23, 275 (2002).
- Lu et al. (Belle Collaboration) Lu et al. (Belle Collaboration), R. S., Phys. Rev. Lett., 89, 191801 (2002).
- Dunietz et al. (1991) Dunietz et al., I., Phys. Rev. D, 43, 2193 (1991).
- Abe et al. (2001) Abe, K., Satpathy, M., and Yamamoto, H., Tech. Rep. UH-511-982-01, hep-ex/0103002 (2001).
- Aleksan et al. (1995) Aleksan et al., R., Phys. Lett. B, 356, 95 (1995).