Chapter 1 Muon Energy Reconstruction in ANTARES and its Application to the Diffuse Neutrino Flux
Abstract
The European collaboration ANTARES aims to operate a large neutrino telescope in the Mediterranean Sea, 2400 m deep, 40 km from Toulon (France). Muon neutrinos are detected through the muon produced in charged current interactions in the medium surrounding the detector. The Cherenkov light emitted by the muon is registered by a 3D photomultiplier array. Muon energy can be inferred using 3 different methods based on the knowledge of the features of muon energy losses. They result in an energy resolution of a factor above 1 TeV. The ANTARES sensitivity to diffuse neutrino flux models is obtained from an energy cut, rejecting most of the atmospheric neutrino background which has a softer spectrum. Fake upgoing events from downgoing atmospheric muons are rejected using dedicated variables. After 1 year of data taking, the ANTARES sensitivity is for a 10 string detector and an diffuse flux spectrum.
1. Introduction
The ANTARES detector will consist of 12 identical strings, each string supporting 30 storeys each of which are equipped with 3 downward looking optical modules [1]. Each optical module is a pressure resistant glass sphere containing a 10 inch photomultiplier (PMT). The arrival times and amplitudes of the muon Cherenkov light hits on PMT allows the reconstruction of the track with a very good precision (angular resolution of 0.2o at high energy) and a reasonable estimation of the energy. In section 2, the three energy estimators developed in ANTARES are described. In section 3, the ANTARES sensitivity to cosmic diffuse neutrino fluxes are obtained after rejection of the atmospheric neutrino and muon background.
2. Muon energy estimators
The 3 energy estimators are based on the increase of emitted light due to muon catastrophic energy losses above 1 TeV. The first method is purely empirical. The second is based on muon energy loss. The third uses a neural network approach. Results are shown for a 10 string detector.
2.1. Minimum ionising muon comparison method
This empirical method compares the recorded amplitude on each PMT, , to the theoretical amplitude that a minimum ionising muon (MIM) would have given, [3]. A hit classification is determined depending on the value of the ratio for each hit i: if () the hit is classsified as a “low (high) energy”. A variable called , where s stands for “low” or “high”, is defined for both classes:
| (1) |
where i runs over all the “low” (“high”) energy hits and N is the total number of hits in the event. The relation between and the true Monte Carlo muon energy, , is parametrised by a parabola. If () then the () value is used. This method gives an energy resolution of a factor of 3 on the energy (see Fig. 1).
2.2. Energy from an estimation of the muon dE/dx
The method [4] is based on the muon energy estimation from the dE/dx evolution with respect to its energy. A dE/dx estimator, , is constructed using the total hit amplitude in the event, , the detector response R and the muon path length, , in the detector sensitive volume:
| (2) |
The sensitive volume is defined as the instrumented volume to which 2.5 are added, being the effective attenuation length in the water as measured at the ANTARES site.
The detector response R is defined as :
| (3) |
where is the number of PMTs in the detector; is the PMT angular efficiency; is the number of photons reaching the PMT after a distance r in water. The ratio is a direct estimation of the total amount of energy which has been lost by the muon in this volume. The relation between and the true muon energy is fitted by a third order polynomial. This method is valid only when muons have a path length in the sensitive volume and is relatively insensitive to the detector geometry. The achieved energy resolution is a factor 2 on the muon energy above 10 TeV (see Fig. 1).
2.3. Neural network approach
This method essentially uses as input the amplitude of hit and time difference with respect to a pure minimum ionising muon. Catastrophic muon energy losses lead to greater amplitudes and broader time distributions. The only output variable is the muon estimated energy. Actually, the NN was trained only with events 1 TeV. Works is in progress for lower energies.
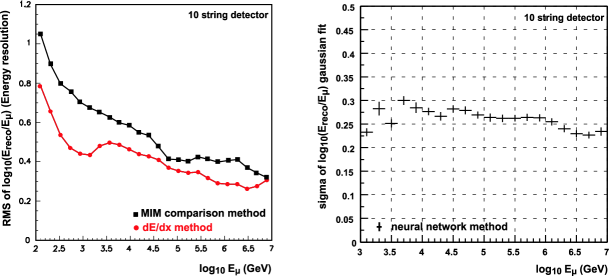
First results show that between 100 GeV and 1 TeV the accuracy is around a factor of 3. Above 10 TeV, the performances are comparable to those presented in 2.2 (around a factor 2 on , see Fig. 1).
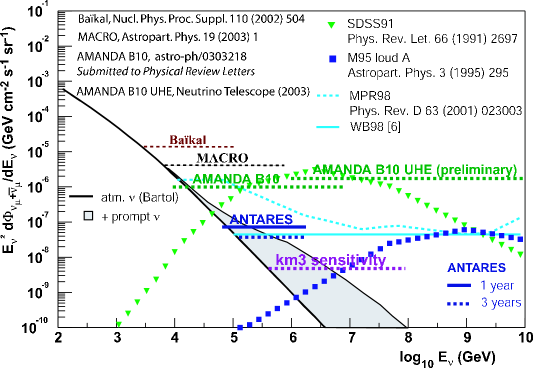
3. ANTARES sensitivity to a diffuse high energy cosmic neutrino flux
The ANTARES sensitivity to a diffuse cosmic neutrino flux superimposed on top of the atmospheric neutrino background can be evaluated using the 3 energy estimators. For brevity, only the results of the estimator described in Sec. 2.2 are presented. A typical cosmic differential neutrino spectrum with energy dependence has first been considered [5]. The atmospheric neutrino spectrum () is softer and is rejected using an energy cut, which also rejects those atmospheric muon background events surviving dedicated muon rejection cuts. These cuts are essentially independent of the assumed spectral shape. The ANTARES sensitivity, with a 10 string detector, is found to be after 1 year of data taking ( after 3 years) with an optimal muon energy threshold at 50 TeV (126 TeV). The uncertainties are determined from various predictions of the atmospheric prompt neutrino flux [2] (see Fig. 2). Using the same “experimental” conditions (10 string detector, 1 year of acquisition), the sensitivity to a model like SDSS91 (M95 loud A) is 20 times better (67 times worse) than the model flux with an optimal energy threshold at 125 TeV (210 TeV) (see Fig. 2) [4].
4. Conclusion
Three different energy estimators have been developed in the ANTARES collaboration. They reach an energy resolution of a factor between 2 and 3 on and allows a limit of to be set for 1 year’s data with an spectrum and a 10 string detector.
1. E. Aslanides et al. 1999, ANTARES proposal astro-ph/9907432
2. C.G.S. Costa 2001, Astropart. Phys. 16(193)
3. A. Oppelt 2001, PhD thesis, Université de la Méditerranée
4. A. Romeyer 2003, PhD thesis, Université Paris VII
5. E. Waxman and J. Bahcall 1999, Phys. Rev. D 59(0203002)