DESY 03-115
August 2003
Measurement of production in deep
inelastic
scattering at HERA
Abstract
Inclusive production of (2010) mesons in deep inelastic scattering has been measured with the ZEUS detector at HERA using an integrated luminosity of 81.9 pb-1. The decay channel with and corresponding antiparticle decay were used to identify mesons. Differential cross sections with GeV2 and in the kinematic region GeV and are compared to different QCD calculations incorporating different parameterisations of the parton densities in the proton. The data show sensitivity to the gluon distribution in the proton and are reasonably well described by next-to-leading-order QCD with the ZEUS NLO QCD fit used as the input parton density in the proton. The observed cross section is extrapolated to the full kinematic region in and in order to determine the open-charm contribution, , to the proton structure function, . Since, at low , the uncertainties of the data are comparable to those from the QCD fit, the measured differential cross sections in and should be used in future fits to constrain the gluon density.
Post reading
The ZEUS Collaboration
S. Chekanov,
M. Derrick,
D. Krakauer,
J.H. Loizides1,
S. Magill,
B. Musgrave,
J. Repond,
R. Yoshida
Argonne National Laboratory, Argonne, Illinois 60439-4815, USA n
M.C.K. Mattingly
Andrews University, Berrien Springs, Michigan 49104-0380, USA
P. Antonioli,
G. Bari,
M. Basile,
L. Bellagamba,
D. Boscherini,
A. Bruni,
G. Bruni,
G. Cara Romeo,
L. Cifarelli,
F. Cindolo,
A. Contin,
M. Corradi,
S. De Pasquale,
P. Giusti,
G. Iacobucci,
A. Margotti,
A. Montanari,
R. Nania,
F. Palmonari,
A. Pesci,
G. Sartorelli,
A. Zichichi
University and INFN Bologna, Bologna, Italy e
G. Aghuzumtsyan,
D. Bartsch,
I. Brock,
S. Goers,
H. Hartmann,
E. Hilger,
P. Irrgang,
H.-P. Jakob,
A. Kappes2,
U.F. Katz2,
O. Kind,
U. Meyer,
E. Paul3,
J. Rautenberg,
R. Renner,
A. Stifutkin,
J. Tandler,
K.C. Voss,
M. Wang,
A. Weber4
Physikalisches Institut der Universität Bonn,
Bonn, Germany b
D.S. Bailey5,
N.H. Brook5,
J.E. Cole,
B. Foster,
G.P. Heath,
H.F. Heath,
S. Robins,
E. Rodrigues6,
J. Scott,
R.J. Tapper,
M. Wing
H.H. Wills Physics Laboratory, University of Bristol,
Bristol, United Kingdom m
M. Capua,
A. Mastroberardino,
M. Schioppa,
G. Susinno
Calabria University,
Physics Department and INFN, Cosenza, Italy e
J.Y. Kim,
Y.K. Kim,
J.H. Lee,
I.T. Lim,
M.Y. Pac7
Chonnam National University, Kwangju, Korea g
A. Caldwell8,
M. Helbich,
X. Liu,
B. Mellado,
Y. Ning,
S. Paganis,
Z. Ren,
W.B. Schmidke,
F. Sciulli
Nevis Laboratories, Columbia University, Irvington on Hudson,
New York 10027 o
J. Chwastowski,
A. Eskreys,
J. Figiel,
K. Olkiewicz,
P. Stopa,
L. Zawiejski
Institute of Nuclear Physics, Cracow, Poland i
L. Adamczyk,
T. Bołd,
I. Grabowska-Bołd9,
D. Kisielewska,
A.M. Kowal,
M. Kowal,
T. Kowalski,
M. Przybycień,
L. Suszycki,
D. Szuba,
J. Szuba10
Faculty of Physics and Nuclear Techniques,
AGH-University of Science and Technology, Cracow, Poland p
A. Kotański11,
W. Słomiński12
Department of Physics, Jagellonian University, Cracow, Poland
V. Adler,
L.A.T. Bauerdick13,
U. Behrens,
I. Bloch,
K. Borras,
V. Chiochia,
D. Dannheim,
G. Drews,
J. Fourletova,
U. Fricke,
A. Geiser,
P. Göttlicher14,
O. Gutsche,
T. Haas,
W. Hain,
G.F. Hartner,
S. Hillert,
B. Kahle,
U. Kötz,
H. Kowalski15,
G. Kramberger,
H. Labes,
D. Lelas,
B. Löhr,
R. Mankel,
I.-A. Melzer-Pellmann,
C.N. Nguyen,
D. Notz,
A.E. Nuncio-Quiroz,
M.C. Petrucci16,
A. Polini,
A. Raval,
L. Rurua,
U. Schneekloth,
U. Stoesslein,
G. Wolf,
C. Youngman,
W. Zeuner
Deutsches Elektronen-Synchrotron DESY, Hamburg, Germany
S. Schlenstedt
DESY Zeuthen, Zeuthen, Germany
G. Barbagli,
E. Gallo,
C. Genta,
P. G. Pelfer
University and INFN, Florence, Italy e
A. Bamberger,
A. Benen,
N. Coppola
Fakultät für Physik der Universität Freiburg i.Br.,
Freiburg i.Br., Germany b
M. Bell, P.J. Bussey,
A.T. Doyle,
J. Hamilton,
S. Hanlon,
S.W. Lee,
A. Lupi,
D.H. Saxon,
I.O. Skillicorn
Department of Physics and Astronomy, University of Glasgow,
Glasgow, United Kingdom m
I. Gialas
Department of Engineering in Management and Finance, Univ. of
Aegean, Greece
B. Bodmann,
T. Carli,
U. Holm,
K. Klimek,
N. Krumnack,
E. Lohrmann,
M. Milite,
H. Salehi,
P. Schleper,
S. Stonjek17,
K. Wick,
A. Ziegler,
Ar. Ziegler
Hamburg University, Institute of Exp. Physics, Hamburg,
Germany b
C. Collins-Tooth,
C. Foudas,
R. Gonçalo6,
K.R. Long,
A.D. Tapper
Imperial College London, High Energy Nuclear Physics Group,
London, United Kingdom m
P. Cloth,
D. Filges
Forschungszentrum Jülich, Institut für Kernphysik,
Jülich, Germany
K. Nagano,
K. Tokushuku18,
S. Yamada,
Y. Yamazaki
M. Kataoka19
Institute of Particle and Nuclear Studies, KEK,
Tsukuba, Japan f
A.N. Barakbaev,
E.G. Boos,
N.S. Pokrovskiy,
B.O. Zhautykov
Institute of Physics and Technology of Ministry of Education and
Science of Kazakhstan, Almaty, Kazakhstan
H. Lim,
D. Son
Kyungpook National University, Taegu, Korea g
K. Piotrzkowski
Institut de Physique Nucléaire, Université Catholique de
Louvain, Louvain-la-Neuve, Belgium
F. Barreiro,
C. Glasman20,
O. González,
L. Labarga,
J. del Peso,
E. Tassi,
J. Terrón,
M. Vázquez
Departamento de Física Teórica, Universidad Autónoma
de Madrid, Madrid, Spain l
M. Barbi, F. Corriveau,
S. Gliga,
J. Lainesse,
S. Padhi,
D.G. Stairs,
R. Walsh
Department of Physics, McGill University,
Montréal, Québec, Canada H3A 2T8 a
T. Tsurugai
Meiji Gakuin University, Faculty of General Education,
Yokohama, Japan f
A. Antonov,
P. Danilov,
B.A. Dolgoshein,
D. Gladkov,
V. Sosnovtsev,
S. Suchkov
Moscow Engineering Physics Institute, Moscow, Russia j
R.K. Dementiev,
P.F. Ermolov,
Yu.A. Golubkov21,
I.I. Katkov,
L.A. Khein,
I.A. Korzhavina,
V.A. Kuzmin,
B.B. Levchenko22,
O.Yu. Lukina,
A.S. Proskuryakov,
L.M. Shcheglova,
N.N. Vlasov23,
S.A. Zotkin
Moscow State University, Institute of Nuclear Physics,
Moscow, Russia k
N. Coppola,
S. Grijpink,
E. Koffeman,
P. Kooijman,
E. Maddox,
A. Pellegrino,
S. Schagen,
H. Tiecke,
J.J. Velthuis,
L. Wiggers,
E. de Wolf
NIKHEF and University of Amsterdam, Amsterdam, Netherlands h
N. Brümmer,
B. Bylsma,
L.S. Durkin,
T.Y. Ling
Physics Department, Ohio State University,
Columbus, Ohio 43210 n
A.M. Cooper-Sarkar,
A. Cottrell,
R.C.E. Devenish,
J. Ferrando,
G. Grzelak,
C. Gwenlan,
S. Patel,
M.R. Sutton,
R. Walczak
Department of Physics, University of Oxford,
Oxford United Kingdom m
A. Bertolin, R. Brugnera,
R. Carlin,
F. Dal Corso,
S. Dusini,
A. Garfagnini,
S. Limentani,
A. Longhin,
A. Parenti,
M. Posocco,
L. Stanco,
M. Turcato
Dipartimento di Fisica dell’ Università and INFN,
Padova, Italy e
E.A. Heaphy,
F. Metlica,
B.Y. Oh,
J.J. Whitmore24
Department of Physics, Pennsylvania State University,
University Park, Pennsylvania 16802 o
Y. Iga
Polytechnic University, Sagamihara, Japan f
G. D’Agostini,
G. Marini,
A. Nigro
Dipartimento di Fisica, Università ’La Sapienza’ and INFN,
Rome, Italy
C. Cormack25,
J.C. Hart,
N.A. McCubbin
Rutherford Appleton Laboratory, Chilton, Didcot, Oxon,
United Kingdom m
C. Heusch
University of California, Santa Cruz, California 95064, USA n
I.H. Park
Department of Physics, Ewha Womans University, Seoul, Korea
N. Pavel
Fachbereich Physik der Universität-Gesamthochschule
Siegen, Germany
H. Abramowicz,
A. Gabareen,
S. Kananov,
A. Kreisel,
A. Levy
Raymond and Beverly Sackler Faculty of Exact Sciences,
School of Physics, Tel-Aviv University,
Tel-Aviv, Israel d
M. Kuze
Department of Physics, Tokyo Institute of Technology,
Tokyo, Japan f
T. Abe,
T. Fusayasu,
S. Kagawa,
T. Kohno,
T. Tawara,
T. Yamashita
Department of Physics, University of Tokyo,
Tokyo, Japan f
R. Hamatsu,
T. Hirose3,
M. Inuzuka,
H. Kaji,
S. Kitamura26,
K. Matsuzawa,
T. Nishimura
Tokyo Metropolitan University, Department of Physics,
Tokyo, Japan f
M. Arneodo27,
M.I. Ferrero,
V. Monaco,
M. Ruspa,
R. Sacchi,
A. Solano
Università di Torino, Dipartimento di Fisica Sperimentale
and INFN, Torino, Italy e
T. Koop,
G.M. Levman,
J.F. Martin,
A. Mirea
Department of Physics, University of Toronto, Toronto, Ontario,
Canada M5S 1A7 a
J.M. Butterworth28,
R. Hall-Wilton,
T.W. Jones,
M.S. Lightwood,
C. Targett-Adams
Physics and Astronomy Department, University College London,
London, United Kingdom m
J. Ciborowski29,
R. Ciesielski30,
P. Łużniak31,
R.J. Nowak,
J.M. Pawlak,
J. Sztuk32,
T. Tymieniecka33,
A. Ukleja33,
J. Ukleja34,
A.F. Żarnecki
Warsaw University, Institute of Experimental Physics,
Warsaw, Poland q
M. Adamus,
P. Plucinski
Institute for Nuclear Studies, Warsaw, Poland q
Y. Eisenberg,
L.K. Gladilin35,
D. Hochman,
U. Karshon
M. Riveline
Department of Particle Physics, Weizmann Institute, Rehovot,
Israel c
D. Kçira,
S. Lammers,
L. Li,
D.D. Reeder,
M. Rosin,
A.A. Savin,
W.H. Smith
Department of Physics, University of Wisconsin, Madison,
Wisconsin 53706, USA n
A. Deshpande,
S. Dhawan,
P.B. Straub
Department of Physics, Yale University, New Haven, Connecticut
06520-8121, USA n
S. Bhadra,
C.D. Catterall,
S. Fourletov,
G. Hartner,
S. Menary,
M. Soares,
J. Standage
Department of Physics, York University, Ontario, Canada M3J
1P3 a
1 also affiliated with University College London, London, UK
2 on leave of absence at University of
Erlangen-Nürnberg, Germany
3 retired
4 self-employed
5 PPARC Advanced fellow
6 supported by the Portuguese Foundation for Science and
Technology (FCT)
7 now at Dongshin University, Naju, Korea
8 now at Max-Planck-Institut für Physik,
München,Germany
9 partly supported by Polish Ministry of Scientific
Research and Information Technology, grant no. 2P03B 122 25
10 partly supp. by the Israel Sci. Found. and Min. of Sci.,
and Polish Min. of Scient. Res. and Inform. Techn., grant no.2P03B12625
11 supported by the Polish State Committee for Scientific
Research, grant no. 2 P03B 09322
12 member of Dept. of Computer Science
13 now at Fermilab, Batavia, IL, USA
14 now at DESY group FEB
15 on leave of absence at Columbia Univ., Nevis Labs., N.Y., US
A
16 now at INFN Perugia, Perugia, Italy
17 now at Univ. of Oxford, Oxford/UK
18 also at University of Tokyo, Tokyo, Japan
19 also at Nara Women’s University, Nara, Japan
20 Ramón y Cajal Fellow
21 now at HERA-B
22 partly supported by the Russian Foundation for Basic
Research, grant 02-02-81023
23 now at University of Freiburg, Germany
24 on leave of absence at The National Science Foundation,
Arlington, VA, USA
25 now at Univ. of London, Queen Mary College, London, UK
26 present address: Tokyo Metropolitan University of
Health Sciences, Tokyo 116-8551, Japan
27 also at Università del Piemonte Orientale, Novara, Italy
28 also at University of Hamburg, Alexander von Humboldt
Fellow
29 also at Łódź University, Poland
30 supported by the Polish State Committee for
Scientific Research, grant no. 2 P03B 07222
31 Łódź University, Poland
32 Łódź University, Poland, supported by the
KBN grant 2P03B12925
33 supported by German Federal Ministry for Education and
Research (BMBF), POL 01/043
34 supported by the KBN grant 2P03B12725
35 on leave from MSU, partly supported by
University of Wisconsin via the U.S.-Israel BSF
| a | supported by the Natural Sciences and Engineering Research Council of Canada (NSERC) |
|---|---|
| b | supported by the German Federal Ministry for Education and Research (BMBF), under contract numbers HZ1GUA 2, HZ1GUB 0, HZ1PDA 5, HZ1VFA 5 |
| c | supported by the MINERVA Gesellschaft für Forschung GmbH, the Israel Science Foundation, the U.S.-Israel Binational Science Foundation and the Benozyio Center for High Energy Physics |
| d | supported by the German-Israeli Foundation and the Israel Science Foundation |
| e | supported by the Italian National Institute for Nuclear Physics (INFN) |
| f | supported by the Japanese Ministry of Education, Culture, Sports, Science and Technology (MEXT) and its grants for Scientific Research |
| g | supported by the Korean Ministry of Education and Korea Science and Engineering Foundation |
| h | supported by the Netherlands Foundation for Research on Matter (FOM) |
| i | supported by the Polish State Committee for Scientific Research, grant no. 620/E-77/SPB/DESY/P-03/DZ 117/2003-2005 |
| j | partially supported by the German Federal Ministry for Education and Research (BMBF) |
| k | partly supported by the Russian Ministry of Industry, Science and Technology through its grant for Scientific Research on High Energy Physics |
| l | supported by the Spanish Ministry of Education and Science through funds provided by CICYT |
| m | supported by the Particle Physics and Astronomy Research Council, UK |
| n | supported by the US Department of Energy |
| o | supported by the US National Science Foundation |
| p | supported by the Polish State Committee for Scientific Research, grant no. 112/E-356/SPUB/DESY/P-03/DZ 116/2003-2005,2 P03B 13922 |
| q | supported by the Polish State Committee for Scientific Research, grant no. 115/E-343/SPUB-M/DESY/P-03/DZ 121/2001-2002, 2 P03B 07022 |
1 Introduction
Charm quarks are produced copiously in deep inelastic scattering (DIS) at HERA. At sufficiently high photon virtualities, , the production of charm quarks constitutes up to of the total cross section [1, 2]. Previous measurements of cross sections [1, 2, 3, 4] indicate that the production of charm quarks in DIS in the range GeV2 is consistent with calculations in Quantum Chromodynamics (QCD) in which charm is produced through the boson-gluon-fusion (BGF) mechanism. This implies that the charm cross section is directly sensitive to the gluon density in the proton.
In this paper, measurements of the cross section are presented with improved precision and in a kinematic region extending to higher than the previous ZEUS results [1]. Single differential cross sections have been measured as a function of and the Bjorken scaling variable, . Cross sections have also been measured in two ranges as a function of transverse momentum, , and pseudorapidity, , of the meson. The cross sections are compared to the predictions of leading-logarithmic Monte Carlo (MC) simulations and to a next-to-leading-order (NLO) QCD calculation using various parton density functions (PDFs) in the proton. In particular, the data are compared to calculations using the recent ZEUS NLO QCD fit [5], in which the parton densities in the proton are parameterised by performing fits to inclusive DIS measurements from ZEUS and fixed-target experiments. The cross-section measurements are used to extract the charm contribution, , to the proton structure function, .
2 Experimental set-up
The analysis was performed with data taken from 1998 to 2000, when HERA collided electrons or positrons with energy 27.5 GeV with protons of energy 920 GeV. The results are based on and samples corresponding to integrated luminosities of pb-1 and pb-1, respectively.111Hereafter, both electrons and positrons are referred to as electrons, unless explicitly stated otherwise.
A detailed description of the ZEUS detector can be found elsewhere [6]. A brief outline of the components that are most relevant for this analysis is given below.
Charged particles are tracked in the central tracking detector (CTD) [7, *npps:b32:181, *nim:a338:254], which operates in a magnetic field of provided by a thin superconducting solenoid. The CTD consists of 72 cylindrical drift chamber layers, organised in nine superlayers covering the polar-angle222The ZEUS coordinate system is a right-handed Cartesian system, with the axis pointing in the proton beam direction, referred to as the “forward direction”, and the axis pointing left towards the centre of HERA. The coordinate origin is at the nominal interaction point. region . The transverse-momentum resolution for full-length tracks is , with in GeV.
The high-resolution uranium–scintillator calorimeter (CAL) [10, *nim:a309:101, *nim:a321:356, *nim:a336:23] consists of three parts: the forward (FCAL), the barrel (BCAL) and the rear (RCAL) calorimeters. Each part is subdivided transversely into towers and longitudinally into one electromagnetic section (EMC) and either one (in RCAL) or two (in BCAL and FCAL) hadronic sections (HAC). The smallest subdivision of the calorimeter is called a cell. The CAL energy resolutions, as measured under test-beam conditions, are for electrons and for hadrons, with in GeV.
Presamplers (PRES) [14, *magill:bpre] are mounted in front of FCAL, BCAL and RCAL. They consist of scintillator tiles which detect particles originating from showers in the material between the interaction point and the calorimeter. This information was used to correct the energy of the scattered electron. The position of electrons scattered close to the electron beam direction is determined by a scintillator strip detector (SRTD) [16]. The SRTD signals resolve single minimum-ionising particles and provide a transverse position resolution of 3 mm.
The luminosity was measured from the rate of the bremsstrahlung process , where the photon was measured in a lead–scintillator calorimeter [17, *zfp:c63:391, *acpp:b32:2025] placed in the HERA tunnel at .
A three-level trigger system was used to select events online [6, 20]. At the third level, events with both a reconstructed candidate and a scattered-electron candidate were kept for further analysis. The efficiency of the online reconstruction, determined relative to an inclusive DIS trigger, was generally above .
3 Theoretical predictions
A variety of models to describe charm production in DIS have been constructed, based on many theoretical ideas. A comparison of the data with these models is complicated by the need to produce predictions for the limited range of acceptance of the detector in and . The calculation used in this paper to compare with the measured cross sections is based on NLO QCD as described in Section 3.1. Monte Carlo models also provide calculations in the measured kinematic region; those used are discussed in Section 3.2. Predictions of other models are briefly discussed in Section 3.3. Most of these models only predict the total cross sections and cannot therefore be directly compared with the current data.
3.1 NLO QCD calculations
The NLO predictions for cross sections were obtained using the HVQDIS program [21] based on the so-called fixed-flavour-number scheme (FFNS). In this scheme, only light quarks () are included in the initial-state proton as partons whose distributions obey the DGLAP equations[22, *sovjnp:20:94, *np:b126:298, *jetp:46:641], and the is produced via the BGF mechanism [26, *pl:b353:535] with NLO corrections [28, *np:b392:229]. The presence of the two large scales, and , can spoil the convergence of the perturbative series because the neglected terms of orders higher than contain log factors which can become large. Therefore, the results of HVQDIS are expected to be most accurate at and to become less reliable when .
The following inputs have been used to obtain the predictions for production at NLO using the program HVQDIS. The recent ZEUS NLO QCD global fit [5] to structure-function data was used as the parameterisation of the proton PDFs. This fit was repeated [30] in the FFNS, in which the PDF has three active quark flavours in the proton, and is set to 0.363 GeV. In this fit, the mass of the charm quark was set to 1.35 GeV; the same mass was therefore used in the HVQDIS calculation of the predictions. The renormalisation and factorisation scales were set to for charm production both in the fit and in the HVQDIS calculation. The charm fragmentation to a is carried out using the Peterson function [31]. The hadronisation fraction, , taken from combined measurements, was set to 0.235 [32] and the Peterson parameter, , was set to 0.035[33]. The production cross section for charmonium states at HERA is larger than in high-energy collisions. The effect of production on the hadronisation fraction was estimated from data [34, 35] to be about and was neglected.
As an alternative to the Peterson fragmentation function, corrections were applied to the partons in the NLO calculation using the Aroma MC program [36] (see Section 3.2) which uses the Lund string fragmentation [37], modified for heavy quarks according to Bowler [38, *np:b70:93], and leading-logarithmic parton showers. This correction was applied on a bin-by-bin basis to the NLO calculation for each cross section measured, according to the formula where . The shapes of the differential cross sections calculated at the parton level of the Aroma model agreed reasonably well with those calculated from the HVQDIS program. The effect of the choice of hadronisation scheme is discussed in Sections 9 and 10.
To estimate the contribution of beauty production, the NLO calculation and hadronisation from the MC were combined, using where . The ZEUS NLO QCD fit was used as the proton PDF, so that the mass used in this fit, GeV, was also used in the HVQDIS program and was set to . The hadronisation fraction, , was set to 0.173 [40].
An alternate way to describe charm production in QCD is the variable-flavour-number scheme (VFNS)[41, 42]. In these calculations, an attempt is made to treat the heavy quarks correctly for all . Therefore, at low , charm is produced dynamically through the BGF process as in the FFNS, whereas, at higher , heavy-quark parton densities are introduced. The transition between the two extremes is treated in different ways by different authors [41, 42]. The ZEUS NLO QCD fit has been performed in this scheme using the formalism of Roberts and Thorne [43, 44]. Predictions from such calculations are, however, only available for the total charm cross section; no calculation of production in the measured kinematic range is available.
3.2 Monte Carlo models of charm production
The MC programs Aroma and Cascade [45] were also compared with the measured differential cross sections. In the Aroma MC program, charm is produced via the BGF process. Higher-order QCD effects are simulated in the leading-logarithmic approximation with initial- and final-state radiation obeying DGLAP evolution. The mass of the charm quark was set to 1.5 GeV and the proton PDF chosen was CTEQ5F3 [46]. The Cascade MC model takes a different approach to the generation of the hard sub-process, in which heavy-quark production is simulated in the framework of the semi-hard or -factorisation approach [47, *prep:189:267, *sovjnp:53:657, *sovjnp:54:867, *pl:b242:97, *np:b360:3, *np:b386:215, 54]. The matrix element used in Cascade is the off-shell LO BGF process [54, 55]. The Cascade initial-state radiation is based on CCFM evolution [56, *pl:b234:339, *np:b336:18, *np:b445:49], which includes terms in the perturbative expansion in addition to the terms used in DGLAP evolution. To simulate final-state radiation, Cascade uses Pythia 5.7 [60]. The cross section is calculated by convoluting the off-shell BGF matrix element with the unintegrated gluon density of the proton obtained from the CCFM fit to the HERA data [61] with GeV. For both Aroma and Cascade, the Lund string model is used for the fragmentation into hadrons, and was set to 0.235.
3.3 Other predictions of charm production
The extraction of performed in this paper (see Section 10) is model dependent and comparisons of to the predictions of models other than that used to produce it are not in general valid. Thus, only the FFNS model, which was used to extract , was compared to the data.
Several models of charm production [62, *pl:b470:243, *pl:b550:160, *pr:d59:014017, *yf:63:1682, *yf:63:1682, *pr:d62:074013, *yf:66:801, *yf:60:1680] were compared in the and range of the measurements in this paper. As most only predict total cross sections, the comparison was performed for . All models show similar trends, with differences typically less than . Since the differences are smaller than the current precision of the cross-section measurements, these models are not considered further.
4 Kinematic reconstruction and event selection
The kinematic variables , and the fraction of the electron energy transferred to the proton in its rest frame, , can be reconstructed using a variety of methods, whose accuracy depends on the variable of interest and its range:
-
•
for the electron method (specified with the subscript ), the measured energy and angle of the scattered lepton are used;
-
•
the double angle (DA) method [70, *hoeger] relies on the angles of the scattered lepton and the hadronic energy flow;
-
•
the Jacquet-Blondel (JB) method [72] is based entirely on measurements of the hadronic system;
-
•
the -method [73] uses both the scattered-lepton energy and measurements of the hadronic system.
The reconstruction of and was performed using the -method, since it has better resolution at low than the DA method. At high , the -method and the DA method are similar, and both have better resolution than the electron method.
-
•
the scattered electron was identified using a neural-network procedure [75, *nim:a391:360]. Its energy, , was required to be larger than 10 GeV;
-
•
;
-
•
;
-
•
GeV, where and is the energy of the calorimeter cell . The sum runs over all cells;
-
•
a primary vertex position determined from the tracks fitted to the vertex in the range cm;
-
•
the impact point (, ) of the scattered lepton on the RCAL must lie outside the region 26 14 cm2 centred on .
The angle of the scattered lepton was determined using either its impact position on the CAL inner face or a reconstructed track in the CTD. The SRTD information was used, when available. The energy of the scattered lepton was corrected using the PRES, with additional corrections for non-uniformity due to geometric effects caused by cell and module boundaries. The quantity was calculated from a combination of CAL clusters and tracks measured in the CTD. The contribution to from the scattered lepton was evaluated separately after all corrections were applied as described above.
The selected kinematic region was GeV2 and .
5 Selection of candidates
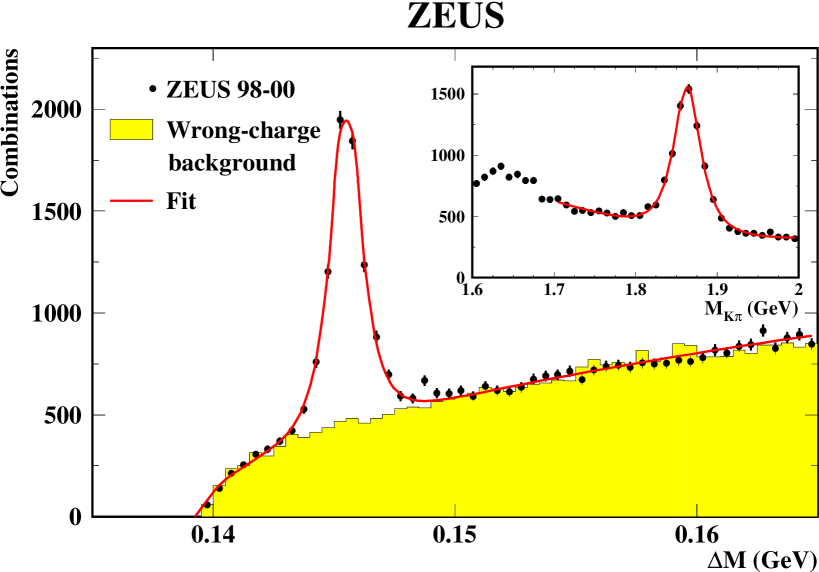
The mesons were identified using the decay channel with the subsequent decay and the corresponding antiparticle decay, where refers to a low-momentum (“slow”) pion accompanying the .
Charged tracks measured by the CTD and assigned to the primary event vertex were selected. The transverse momentum was required to be greater than 0.12 GeV. Each track was required to reach at least the third superlayer of the CTD. These restrictions ensured that the track acceptance and momentum resolution were high. Tracks in the CTD with opposite charges and transverse momenta were combined in pairs to form candidates. The tracks were alternately assigned the masses of a kaon and a pion and the invariant mass of the pair, , was found. Each additional track, with charge opposite to that of the kaon track, was assigned the pion mass and combined with the -meson candidate to form a candidate.
The signal regions for the reconstructed masses, and , were GeV and GeV, respectively. To allow the background to be determined, candidates with wrong-sign combinations, in which both tracks forming the candidates have the same charge and the third track has the opposite charge, were also retained. The same kinematic restrictions were applied as for those candidates with correct-charge combinations.
The kinematic region for candidates was GeV and . Figure 1 shows the distribution for the candidates together with the background from the wrong-charge combinations. The fit to the distribution has the form
where , are free parameters and is the pion mass. The “modified” Gaussian was used to fit the mass peak since it gave a better value than the conventional Gaussian form for a MC sample of mesons. The fit gives a peak at (stat.) MeV compared with the PDG value of MeV [77]. The measured peak position differs from the PDG value. However, it was not corrected for detector effects and the systematic uncertainty was not determined. The fitted width of MeV is consistent with the experimental resolution. Consistent results were also found for the and data separately. For the range GeV, a clear signal of candidates is also shown in Figure 1.
The number of candidates determined in the two signal regions and after subtracting the background estimated from the wrong-charge sample was . The normalisation factor of the wrong-charge sample was determined as the ratio of events with correct-charge combinations to wrong-charge combinations in the region MeV. This factor is compatible with unity for both and data. The normalisation factors were determined for each bin in order to calculate the differential cross sections using the background-subtraction method.
6 Acceptance corrections
The acceptances were calculated using the Rapgap 2.08 [78] and Herwig 6.1 [79, *cpc:67:465] MC models. The Rapgap MC model was interfaced with Heracles 4.6.1 [81] in order to incorporate first-order electroweak corrections. The generated events were then passed through a full simulation of the detector, separately for and running, using Geant 3.13 [82] and processed and selected with the same programs as used for the data.
The MC models were used to produce charm by the BGF process only. The GRV94-LO [83] PDF for the proton was used, and the charm-quark mass was set to 1.5 GeV. The Herwig MC contains leading-logarithmic parton showers whereas for Rapgap MC, the colour-dipole model [84] as implemented in Ariadne 4.03 [84] was used to simulate QCD radiation. Charm fragmentation is implemented using either the Lund string fragmentation (Rapgap) or a cluster fragmentation [85] model (Herwig).
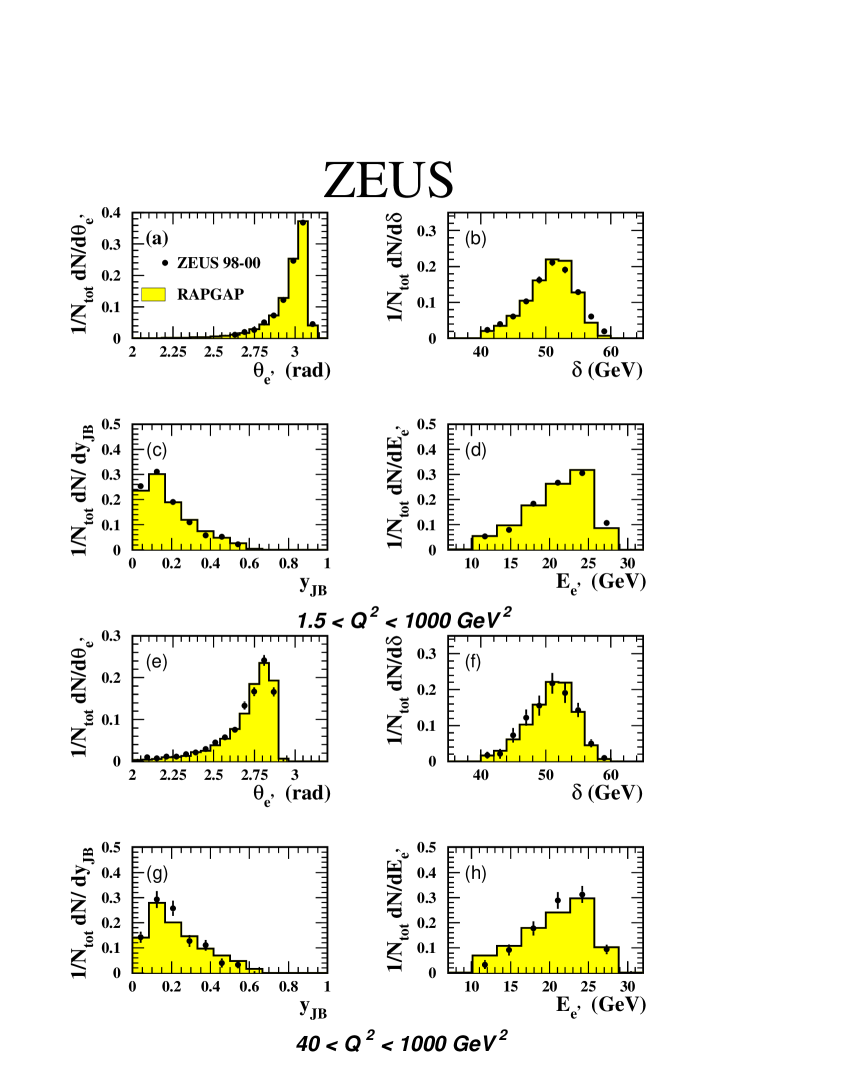
Figure 2 shows distributions of DIS variables for events (after background subtraction) for data compared to detector-level Rapgap predictions. The distributions, which are normalised to unit area, are shown separately for two intervals: GeV2 and GeV2. The Rapgap predictions are in good agreement with the data distributions for both the scattered-lepton and hadronic variables. The description is similarly good for the two ranges. This good description gives confidence in the use of the Rapgap MC to correct the data for detector effects. The Herwig MC gives a similarly good representation of the data (not shown) and is used to estimate the systematic uncertainty, arising from the model in the correction procedure, as described in Section 8.
The cross sections for a given observable were determined using
where is the number of events in a bin of size , is the acceptance (which takes into account migrations, efficiencies and QED radiative effects for that bin) and is the integrated luminosity. The product, , of the appropriate branching ratios for the and was set to [77].
7 rates in and interactions
The production rate, , in the data set is systematically higher than that in the data set. This difference increases with ; for example, the ratio of the rates, , is equal to for GeV2, while for GeV2 it is (only statistical errors are given). Such a difference in production cross sections is not expected from known physics processes.
A detailed study was performed to understand whether any instrumental effects could account for the difference between the two data sets. No such effect was seen in inclusive DIS where the ratio of to rates is consistent with unity. The rate for the wrong-charge background under the mass peak in data agreed well with the wrong-charge rate in data. For example, for GeV2, where the largest difference exists, the ratio of the rates for wrong-charge track combinations in and data is . For both and interactions, the number of mesons was consistent with the number of for the entire range studied. Different reconstruction methods, cuts, background-subtraction methods and the time dependence of the difference were also investigated. None of these checks gave an indication of the source of the observed difference between the rates in and for GeV2. The cross sections were measured separately for and data and are discussed in Section 9. The difference in observed rate is assumed to be a statistical fluctuation and the two sets of data were combined for the final results.
8 Experimental and theoretical uncertainties
8.1 Experimental uncertainties
The systematic uncertainties of the measured cross sections were determined by changing the selection cuts or the analysis procedure in turn and repeating the extraction of the cross sections [86]. The following systematic studies have been carried out (the resulting uncertainty on the total cross section is given in parentheses):
-
event reconstruction and selection (). The following systematic checks were performed for this category:
-
–
the cut on was changed to ;
-
–
the cut on was changed to ;
-
–
the cut on was changed to GeV;
-
–
the cut on the was changed to cm;
-
–
the cut on was changed to GeV;
-
–
the cut on the position of the scattered lepton in the RCAL was increased by 1 cm;
-
–
the electron method was used, except for cases when the scattered-lepton track was reconstructed by the CTD. In the latter case, the method, which has the best resolution at high , was used;
-
–
the energy of the scattered electron was raised and lowered by in the MC only, to account for the uncertainty in the CAL energy scale;
-
–
the energy of the hadronic system was raised and lowered by in the MC only, to account for the uncertainty in the hadronic CAL energy scale;
-
–
the reconstructed SRTD hit position was shifted by mm to account for the uncertainty in the SRTD-RCAL alignment.
-
–
-
uncertainties related to the reconstruction (). The following systematic checks were performed for this category:
-
–
tracks were required to have , in addition to the requirement on the number of superlayers;
-
–
the cut on the minimum transverse momentum for the and candidates was raised and lowered by 0.1 GeV;
-
–
the cut on the minimum transverse momentum for the was raised and lowered by 0.02 GeV;
-
–
the signal region for the was widened and narrowed symmetrically around the centre by 0.01 GeV;
-
–
the signal region for the was widened symmetrically around the centre by 0.003 GeV.
-
–
-
the acceptance was determined using Herwig instead of Rapgap ();
-
the uncertainty in the luminosity measurement (2.2%).
The cross section obtained using the fit was in good agreement with that obtained by subtracting the background using the wrong-charge candidates. These estimations were also made in each bin in which the differential cross sections were measured. The overall systematic uncertainty was determined by adding the above uncertainties in quadrature. The normalisation uncertainties due to the luminosity-measurement error, and those due to the and decay branching ratios of 2.5% [77], were not included in the systematic uncertainties for the differential cross sections.
8.2 Theoretical uncertainties
The NLO QCD predictions for production are affected by the systematic uncertainties listed below. Typical values for the systematic uncertainty are quoted for the total cross section:
-
•
the proton PDF. The CTEQ5F3 and GRV98-HO [87] PDFs were used to check the sensitivity of the predictions to different parameterisations of the gluon density in the proton. The appropriate masses used in the fit to determine the PDF were also used in HVQDIS, i.e. 1.3 GeV for CTEQ5F3 and 1.4 GeV for GRV98-HO. The change in the cross section was using CTEQ5F3 and using GRV98-HO;
-
•
the mass of the charm quark . The charm mass was changed consistently in the PDF fit and in HVQDIS by GeV. The largest effect was at low ;
-
•
the renormalisation and factorisation scale, . The scale was changed by a factor of 0.5 and 2; another scale, 2, was also used [21]. The maximum of and 2 as a function of was taken as the scale to estimate the upward uncertainty;
-
•
the ZEUS PDF uncertainties propagated from the experimental uncertainties of the fitted data (). The change in the cross section was independent of the kinematic region;
-
•
uncertainty in the fragmentation . The parameter in the Peterson fragmentation function was changed by .
The first source of systematic uncertainty is shown separately in the figures. The last four were added in quadrature and displayed as a band in the figures. An additional normalisation uncertainty of [32] on the hadronisation fraction is not shown.
9 Cross-section measurements
9.1 Visible cross sections
The overall acceptance after applying the selection criteria described in Sections 4 and 5 for GeV2, , GeV and calculated with Rapgap is , both for and data. The total cross sections in the same region are:
where the final uncertainty arises from the uncertainty on the branching ratios for the and . The cross section for data is consistent with the previously published result [1] obtained at a proton beam energy of 820 GeV. According to HVQDIS, a increase in the cross section is expected when the proton energy increases from 820 to 920 GeV.
The cross section obtained from the combined sample is:
The prediction from the HVQDIS program is 8.41 nb, in good agreement with the data. The uncertainty in the HVQDIS prediction arises from the sources discussed in Section 8.2 (excluding that from using a different proton PDF) and is about 2.5 times the size of the uncertainty in the measurement. A contribution to the total cross sections arises from mesons produced in events. The cross section arising from production was estimated, as described in Section 3, to be nb for GeV2. The measured differential cross sections include a component from beauty production. Therefore, all NLO predictions include a contribution calculated in each bin. For the extraction of , the predicted value of production was subtracted from the data.
9.2 Differential cross-section measurements
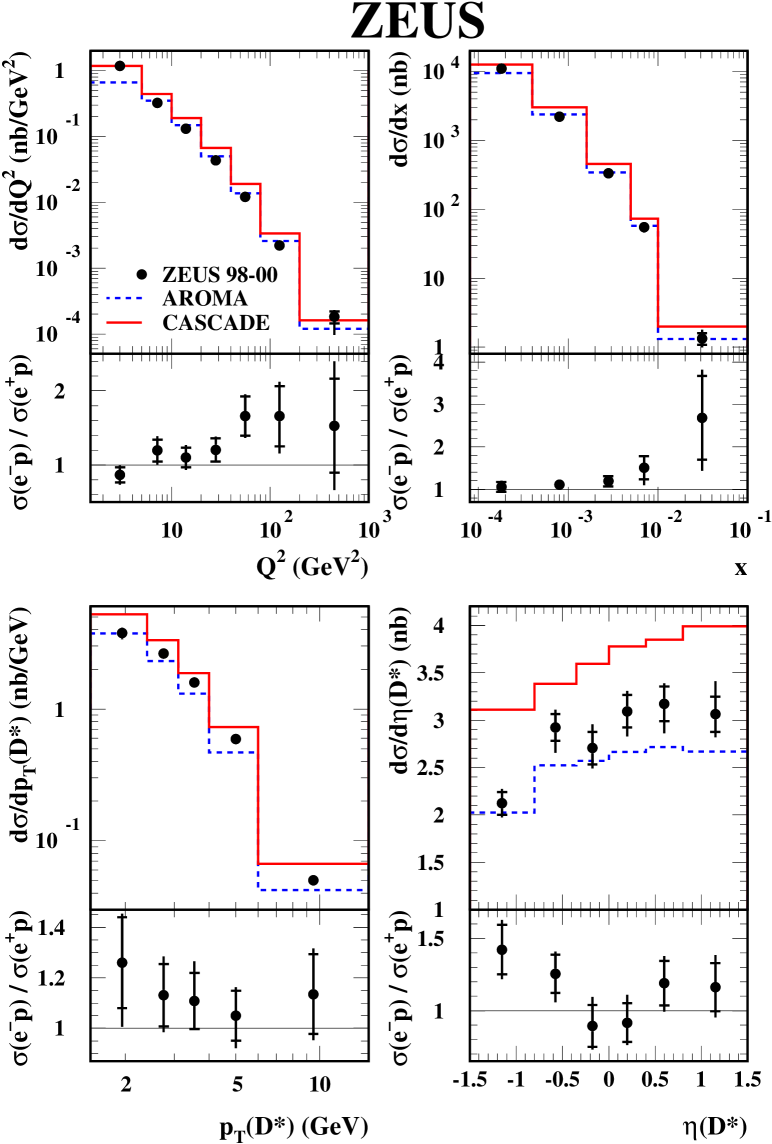
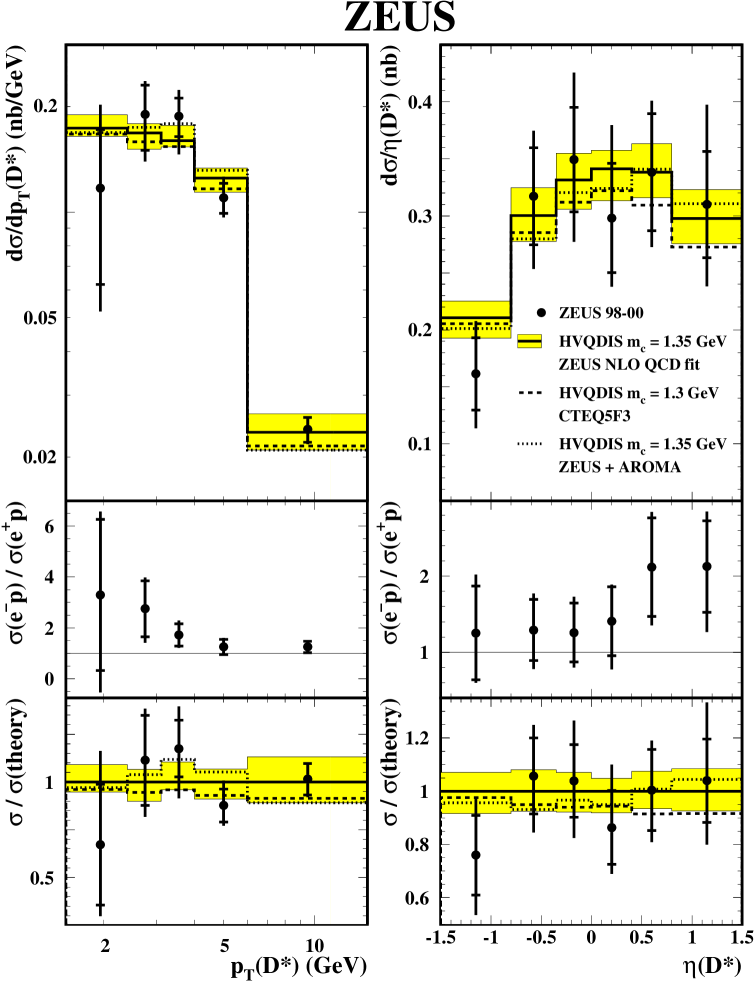
The differential cross sections as a function of , , and for the combined and data samples are shown in Fig. 3 and given in Table 1. The cross sections in and both fall by about four orders of magnitude in the measured region. The cross-section falls by two orders of magnitude with increasing . The cross-section rises with increasing . The ratio of the and cross sections, also shown in Fig. 3 and given in Table 1, tends to increase with increasing and . Neither the NLO calculations nor the MCs based on LO matrix elements and parton showers depend on the charge of the lepton in interactions.
The data in Fig. 3 are compared with predictions from the MC generators Aroma and Cascade. The prediction from Aroma is generally below the data, particularly at low and medium to high . In contrast, the prediction from Cascade agrees at low , but generally lies above the data. Both MC predictions describe the shapes of the cross-sections and reasonably well. The uncertainties in these MC predictions are difficult to estimate and may be large.
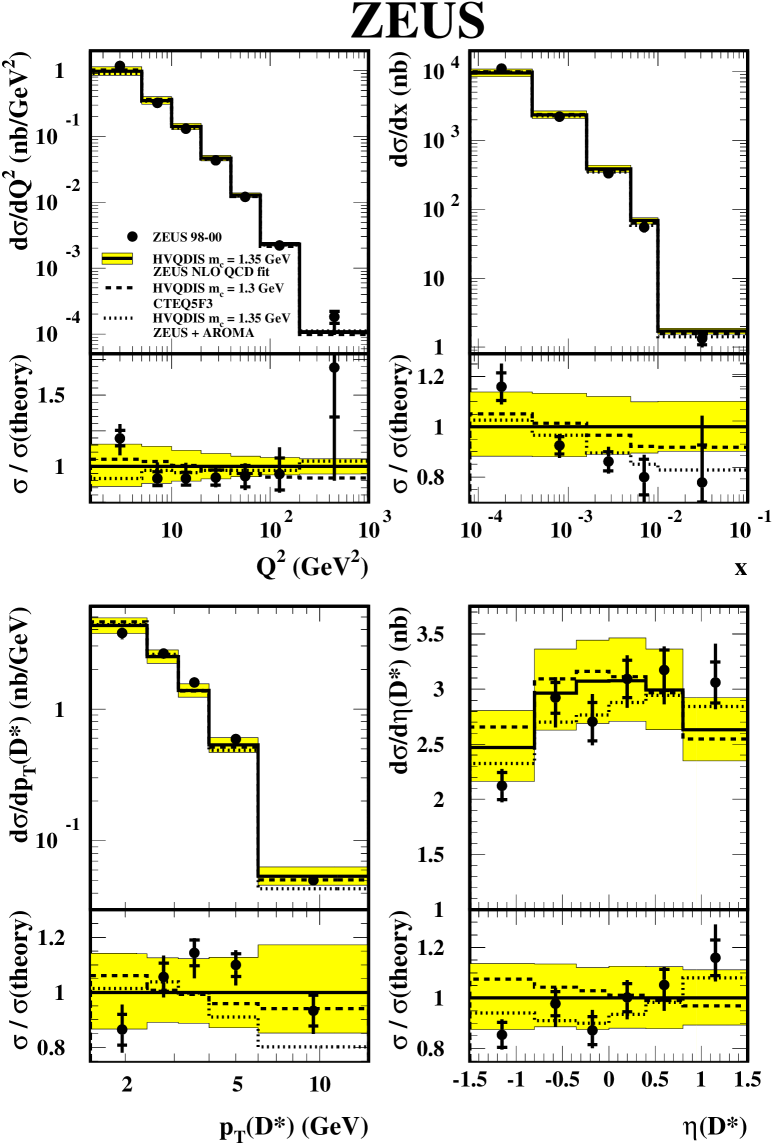
In Fig. 4, the same data are compared with the NLO calculation implemented in the HVQDIS program. The predictions used the default parameter settings as discussed in Section 3, with the uncertainties described in Section 8.2. Predictions using an alternate PDF, CTEQ5F3, and an alternate hadronisation scheme, from Aroma, are also shown. The differences between the predictions, which are comparable to the uncertainties in the data, demonstrate the sensitivity of this measurement to the gluon distribution in the proton. The ratio of data to theory is displayed for each variable. For the cross sections as a function of and , the NLO predictions give a reasonable description of the data over four orders of magnitude in the cross section. For , the description of the data is similar over the whole range in , even though HVQDIS is expected to be most accurate when . The NLO calculation does, however, exhibit a somewhat different shape, particularly for , where the NLO is below the data at low and above the data at high . The predictions using CTEQ5F3 instead of the ZEUS NLO fit, or using Aroma for the hadronisation instead of the Peterson function, give better agreement with the data for the cross-section .
The cross sections as a function of and are also reasonably well described by the NLO calculation. The prediction using the ZEUS NLO QCD fit gives a better description than that using CTEQ5F3 (and also better than the prediction using GRV98-HO, not shown), especially for the cross-section . A better description of is also achieved [88] by using Aroma for the hadronisation, although, in this case, is not so well described. It should be noted that previous publications [1, 2] revealed discrepancies in the forward direction. This region can now be reasonably well described by a recent fit to the proton PDF as shown in Fig. 4(d). The data presented here are practically independent of the data used in the ZEUS NLO PDF fit to inclusive DIS data. Further refinement of NLO QCD fits and even the use of these data in future fits may achieve a better description.
Cross sections as a function of and were also measured for GeV2. The combined and data samples are given in Table 2 and shown in Fig. 5 compared with the HVQDIS predictions. Although the HVQDIS calculation is not thought to be applicable at high , the data are well described. The high- region is also where the difference in and data is most pronounced; the ratios of the cross sections are given in Table 2.
10 Extraction of
The open-charm contribution, , to the proton structure-function can be defined in terms of the inclusive double-differential cross section in and by
| (1) |
In this paper, the cross section is obtained by measuring the production cross section and employing the hadronisation fraction to derive the total charm cross section. Since only a limited kinematic region is accessible for the measurement of mesons, a prescription for extrapolating to the full kinematic phase space is needed.
Since the structure function varies only slowly, it is assumed to be constant within a given and bin. Thus, the measured in a bin is given by
| (2) |
where are the cross sections in bin in the measured region of and . The value of was calculated from the NLO coefficient functions [5]. The functional form of was used to quote the results for at convenient values of and close to the centre-of-gravity of the bin. In this calculation, the same parton densities, charm mass ( 1.35 GeV), and factorisation and renormalisation scales () have been used as for the HVQDIS calculation of the differential cross sections. The hadronisation was performed using the Peterson fragmentation function.
The beauty contribution was subtracted from the data using the theoretical prediction as described in Section 3. At low and high , this fraction is small but it increases with increasing and decreasing . For the lower point at highest , the contribution from beauty production is about of that due to charm production. The contribution to the total cross section from calculated using the ZEUS NLO fit is, on average, and at most and is taken into account in the extraction of . The size of the contribution from is similar to that in other PDFs.
Cross sections in the measured region and in the and kinematic bins of Table 3 were extrapolated to the full and phase space using HVQDIS. These bins correspond to the and values given in Table 4, where the measurements are given. Typical extrapolation factors are between 4.7 at low and 1.5 at high , as in Table 4. The following uncertainties of the extrapolation were evaluated:
-
•
using the Aroma fragmentation correction instead of the Peterson fragmentation yielded changes of typically less than and not more than 20%. Although these values are not very significant compared to the uncertainties in the data, the two corrections do produce a noticeable change in the shape of the cross section as a function of . The most significant effects are in the highest bins for a given ;
-
•
changing the charm mass by GeV consistently in the HVQDIS calculation and in the calculation of leads to differences in the extrapolation of at low ; the value decreases rapidly to higher ;
-
•
using the upper and lower predictions given by the uncertainty in the ZEUS NLO PDF fit, propagated from the experimental uncertainties of the fitted data, to perform the extraction of gives similar values to the central measurement, with deviations typically less than ;
-
•
changing the contribution of beauty events subtracted from the data by gave an uncertainty of typically and up to at low and high .
These uncertainties were added in quadrature with the experimental systematic uncertainties when displayed in the figures and are given separately in Table 4. Extrapolating the cross sections to the full phase space using the CTEQ5F3 proton PDF yielded differences compared to the ZEUS NLO QCD fit of less than for GeV2 and less than for GeV2.
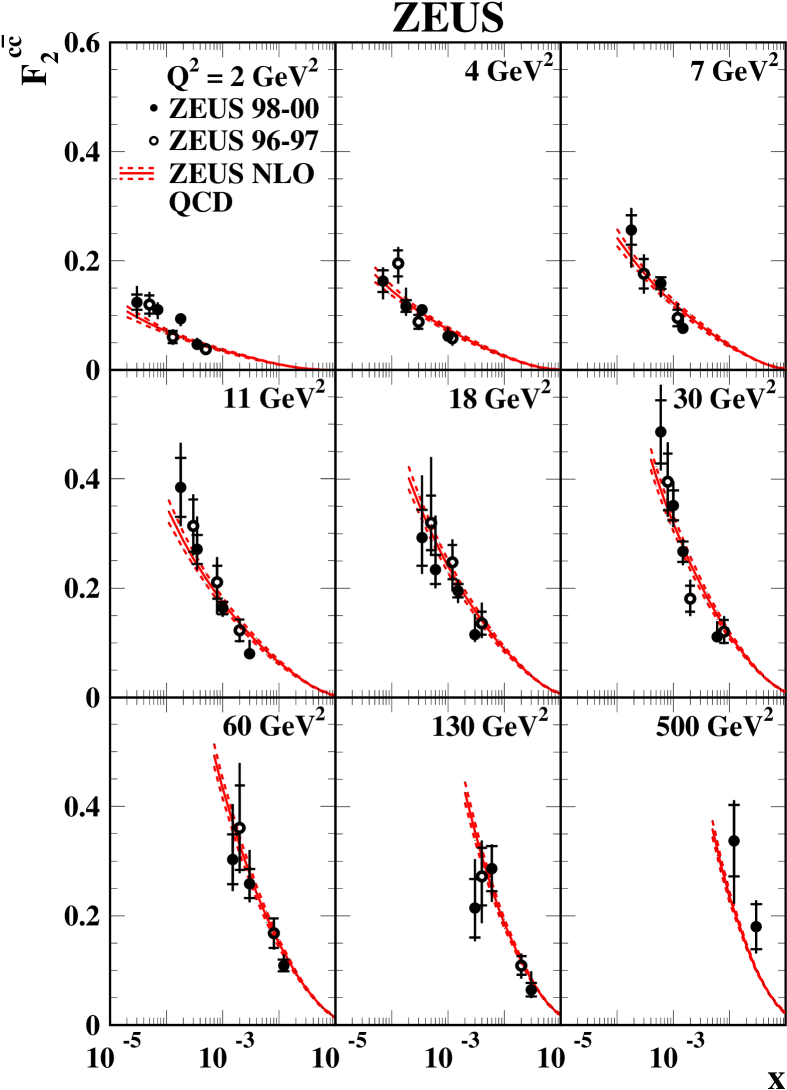
The data are compared in Fig. 6 with the previous measurement [1] and with the ZEUS NLO QCD fit. The two sets of data are consistent333The first three points of the previous data were measured at GeV2 and not at 2 GeV2, so they have been shifted to 2 GeV2 using the ZEUS NLO QCD fit. All other points were measured at the same values.. The prediction describes the data well for all and except for the lowest , where some difference is observed. The uncertainty on the theoretical prediction is that from the PDF fit propagated from the experimental uncertainties of the fitted data. At the lowest , the uncertainty in the data is comparable to the PDF uncertainty shown. This implies that the double-differential cross sections given in Table 3 could be used as an additional constraint on the gluon density in the proton.
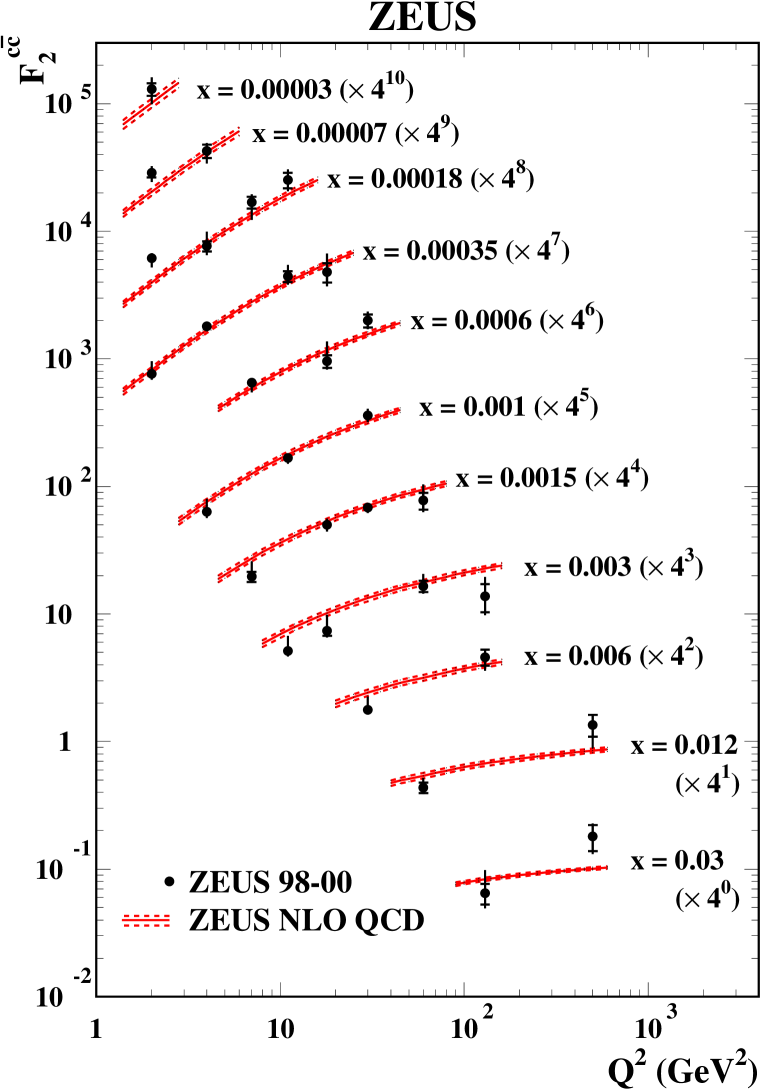
The values of are presented as a function of at fixed values of and compared with the ZEUS NLO QCD fit in Fig. 7. The data rise with increasing , with the rise becoming steeper at lower , demonstrating the property of scaling violation in charm production. The data are well described by the prediction.
11 Conclusions
The production of mesons has been measured in deep inelastic scattering at HERA in the kinematic region GeV2, , GeV and . The data extend the previous analysis to higher and have increased precision.
Predictions from the Aroma MC underestimate, and those from the Cascade MC overestimate, the measured cross sections. Predictions from NLO QCD are in reasonable agreement with the measured cross sections, which show sensitivity to the choice of PDF and hence the gluon distribution in the proton. The ZEUS NLO PDF, which was fit to recent inclusive DIS data, gives the best description of the data. In particular, this is seen in the cross-section .
The double-differential cross section in and has been measured and used to extract the open-charm contribution to , by using the NLO QCD calculation to extrapolate outside the measured and region. Since, at low , the uncertainties of the data are comparable to those from the PDF fit, the measured differential cross sections in and should be used in future fits to constrain the gluon density.
Acknowledgments
The strong support and encouragement of the DESY Directorate have been invaluable, and we are much indebted to the HERA machine group for their inventiveness and diligent efforts. The design, construction and installation of the ZEUS detector have been made possible by the ingenuity and dedicated efforts of many people from inside DESY and from the home institutes who are not listed as authors. Their contributions are acknowledged with great appreciation. We thank J. Collins, B. Harris, G. Ingelman and R. Thorne for useful discussions. We also thank A. Donnachie, P.V. Landshoff, K. Golec-Biernat, A.V. Kiselev, V.A. Petrov, A.V. Berezhnoy and A.K. Likhoded for providing us with their predictions.
10
References
- [1] ZEUS Collab., J. Breitweg et al., Eur. Phys. J. C 12, 35 (2000)
- [2] H1 Collab., C. Adloff et al., Phys. Lett. B 528, 199 (2002)
- [3] ZEUS Collab., J. Breitweg et al., Phys. Lett. B 407, 402 (1997)
- [4] H1 Collab., C. Adloff et al., Nucl. Phys. B 545, 21 (1999)
- [5] ZEUS Collab., S. Chekanov et al., Phys. Rev. D 67, 012007 (2003)
- [6] ZEUS Collab., U. Holm (ed.), The ZEUS Detector. Status Report (unpublished), DESY (1993), available on http://www-zeus.desy.de/bluebook/bluebook.html
- [7] N. Harnew et al., Nucl. Instr. and Meth. A 279, 290 (1989)
- [8] B. Foster et al., Nucl. Phys. Proc. Suppl. B 32, 181 (1993)
- [9] B. Foster et al., Nucl. Instr. and Meth. A 338, 254 (1994)
- [10] M. Derrick et al., Nucl. Instr. and Meth. A 309, 77 (1991)
- [11] A. Andresen et al., Nucl. Instr. and Meth. A 309, 101 (1991)
- [12] A. Caldwell et al., Nucl. Instr. and Meth. A 321, 356 (1992)
- [13] A. Bernstein et al., Nucl. Instr. and Meth. A 336, 23 (1993)
- [14] A. Bamberger et al., Nucl. Instr. and Meth. A 382, 419 (1996)
- [15] S. Magill and S. Chekanov, Proceedings of the IX Int. Conference on Calorimetry, B. Aubert et al. (eds.), p. 625. Frascati Physics Series 21, Annecy, France (2001)
- [16] A. Bamberger et al., Nucl. Instr. and Meth. A 401, 63 (1997)
- [17] J. Andruszków et al., Preprint DESY-92-066, DESY, 1992
- [18] ZEUS Collab., M. Derrick et al., Z. Phys. C 63, 391 (1994)
- [19] J. Andruszków et al., Acta Phys. Pol. B 32, 2025 (2001)
- [20] W.H. Smith, K. Tokushuku and L.W. Wiggers, Proc. Computing in High-Energy Physics (CHEP), C. Verkerk and W. Wojcik (eds.), p. 222. Annecy, France, CERN (1992). Also in preprint DESY 92-150B
- [21] B.W. Harris and J. Smith, Phys. Rev. D 57, 2806 (1998)
- [22] V.N. Gribov and L.N. Lipatov, Sov. J. Nucl. Phys. 15, 438 (1972)
- [23] L.N. Lipatov, Sov. J. Nucl. Phys. 20, 94 (1975)
- [24] G. Altarelli and G. Parisi, Nucl. Phys. B 126, 298 (1977)
- [25] Yu.L. Dokshitzer, Sov. Phys. JETP 46, 641 (1977)
- [26] B.W. Harris and J. Smith, Nucl. Phys. B 452, 109 (1995)
- [27] B.W. Harris and J. Smith, Phys. Lett. B 353, 535 (1995). Erratum, Phys. Lett. B 359, (1995) 423
- [28] E. Laenen et al., Nucl. Phys. B 392, 162 (1993)
- [29] E. Laenen et al., Nucl. Phys. B 392, 229 (1993)
- [30] Public access to ZEUS 2002 PDFs, available on http://www-pnp.physics.ox.ac.uk/cooper/zeus2002.html
- [31] C. Peterson et al., Phys. Rev. D 27, 105 (1983)
- [32] L. Gladilin, Preprint hep-ex/9912064 (1999)
- [33] P. Nason and C. Oleari, Nucl. Phys. B 565, 245 (2000)
- [34] H1 Collab., C. Adloff et al., Eur. Phys. J. C 25, 41 (2002)
- [35] ZEUS Collab., J. Breitweg et al., Eur. Phys. J. C 6, 603 (1999)
- [36] G. Ingelman and J. Rathsman, Comp. Phys. Comm. 101, 135 (1997)
- [37] B. Andersson et al., Phys. Rep. 97, 31 (1983)
- [38] M.G. Bowler, Z. Phys. C 11, 169 (1981)
- [39] X. Artru and G. Mennessier, Nucl. Phys. B 70, 93 (1974)
- [40] K. Ackerstaff et al., Eur. Phys. J. C 1, 439 (1998)
- [41] H.L. Lai and W.K. Tung, Z. Phys. C 74, 463 (1997)
- [42] A. Chuvakin et al., Eur. Phys. J. C 18, 547 (2001)
- [43] R.S. Thorne, J. Phys. G 25, 1307 (1999)
- [44] R.G. Roberts and R.S. Thorne, Eur. Phys. J. C 19, 339 (2001)
- [45] H. Jung and G.P. Salam, Eur. Phys. J. C 19 (2001)
- [46] CTEQ Collab., H.L. Lai et al., Eur. Phys. J. C 12, 375 (2000)
- [47] L.V. Gribov, E.M. Levin and M.G. Ryskin, Phys. Rep. 100, 1 (1983)
- [48] E.M. Levin and M.G. Ryskin, Phys. Rep. 189, 267 (1990)
- [49] E.M. Levin et al., Sov. J. Nucl. Phys. 53, 657 (1991)
- [50] E.M. Levin et al., Sov. J. Nucl. Phys. 54, 867 (1991)
- [51] S. Catani, M. Ciafaloni and F. Hautmann, Phys. Lett. B 242, 97 (1990)
- [52] J.C. Collins and R.K. Ellis, Nucl. Phys. B 360, 3 (1991)
- [53] G. Marchesini and R.K. Webber, Nucl. Phys. B 386, 215 (1992)
- [54] S. Catani, M. Ciafaloni and F. Hautmann, Nucl. Phys. B 366, 135 (1991)
- [55] S.P. Baranov et al., Eur. Phys. J. C 24, 425 (2002)
- [56] M. Ciafaloni, Nucl. Phys. B 296, 49 (1988)
- [57] S. Catani, F. Fiorani and G. Marchesini, Phys. Lett. B 234, 339 (1990)
- [58] S. Catani, F. Fiorani and G. Marchesini, Nucl. Phys. B 336, 18 (1990)
- [59] G. Marchesini, Nucl. Phys. B 445, 49 (1995)
- [60] T. Sjöstrand, Comp. Phys. Comm. 82, 74 (1994)
- [61] H1 Collab., S. Aid et al., Nucl. Phys. B 470, 3 (1996)
- [62] A. Donnachie and P.V. Landshoff, Phys. Lett. B 437, 408 (1998)
- [63] A. Donnachie and P.V. Landshoff, Phys. Lett. B 470, 243 (1999)
- [64] A. Donnachie and P.V. Landshoff, Phys. Lett. B 550, 160 (2002)
- [65] K. Golec-Biernat and M. Wüsthoff, Phys. Rev. D 59, 014017 (1999)
- [66] A.V. Berezhnoy, V.V. Kiselev and A.K. Likhoded, Phys. Atom. Nucl. 63, 1595 (2000)
- [67] A.V. Berezhnoy, V.V. Kiselev and A.K. Likhoded, Phys. Rev. D 62, 074013 (2000)
- [68] A.V. Berezhnoy and A.K. Likhoded, Phys. Atom. Nucl. 66, 769 (2003)
- [69] A.V. Kiselev and V.A. Petrov, Phys. Atom. Nucl. 60, 1533 (1997)
- [70] S. Bentvelsen, J. Engelen and P. Kooijman, Proc. Workshop on Physics at HERA, W. Buchmüller and G. Ingelman (eds.), Vol. 1, p. 23. Hamburg, Germany, DESY (1992)
- [71] K.C. Höger. (1992). Ibid. p. 43
- [72] F. Jacquet and A. Blondel, Proceedings of the Study for an Facility for Europe, U. Amaldi (ed.), p. 391. Hamburg, Germany (1979). Also in preprint DESY 79/48
- [73] U. Bassler and G. Bernardi, Nucl. Instr. and Meth. A 361, 197 (1995)
- [74] ZEUS Collab., S. Chekanov et al., Eur. Phys. J. C 21, 443 (2001)
- [75] H. Abramowicz, A. Caldwell and R. Sinkus, Nucl. Instr. and Meth. A 365, 508 (1995)
- [76] R. Sinkus and T. Voss, Nucl. Instr. and Meth. A 391, 360 (1997)
- [77] K. Hagiwara et al., Phys. Rev. D 66, 010001 (2002)
- [78] H. Jung, Comp. Phys. Comm. 86, 147 (1995)
- [79] G. Marchesini et al., Preprint Cavendish-HEP-99/17 (hep-ph/9912396), 1999
- [80] G. Marchesini et al., Comp. Phys. Comm. 67, 465 (1992)
- [81] A. Kwiatkowski, H. Spiesberger and H.-J. Möhring, Comp. Phys. Comm. 69, 155 (1992)
- [82] R. Brun et al., geant3, Technical Report CERN-DD/EE/84-1, CERN, 1987
- [83] M. Glück, E. Reya and A. Vogt, Z. Phys. C 67, 433 (1995)
- [84] L. Lönnblad, Comp. Phys. Comm. 71, 15 (1992)
- [85] B.R. Webber, Nucl. Phys. B 238, 492 (1984)
- [86] S.D. Robins, Ph.D. Thesis, University of Bristol, 2003. (unpublished)
- [87] M. Glück, E. Reya and A. Vogt, Eur. Phys. J. C 5, 461 (1998)
- [88] I. Redondo, Ph.D. Thesis, Universidad Autónoma de Madrid, Report DESY-THESIS-2001-037, 2001
| bin () | ||||
|---|---|---|---|---|
| (nb/) | ||||
| 1.5, 5 | ||||
| 5, 10 | ||||
| 10, 20 | ||||
| 20, 40 | ||||
| 40, 80 | ||||
| 80, 200 | ||||
| 200, 1000 | ||||
| bin | ||||
| (nb) | ||||
| 0.00008, 0.0004 | ||||
| 0.0004, 0.0016 | ||||
| 0.0016, 0.005 | ||||
| 0.005, 0.01 | ||||
| 0.01, 0.1 | ||||
| bin ( GeV) | ||||
| (nb/ GeV) | ||||
| 1.5, 2.4 | ||||
| 2.4, 3.1 | ||||
| 3.1, 4.0 | ||||
| 4.0, 6.0 | ||||
| 6.0, 15 | ||||
| bin | ||||
| (nb) | ||||
| 0.0 | ||||
| 0.0, 0.4 | ||||
| 0.4, 0.8 | ||||
| 0.8, 1.5 |
| bin ( GeV) | ||||
|---|---|---|---|---|
| (nb/ GeV) | ||||
| bin | ||||
| (nb) | ||||
| 0.0 | ||||
| 0.0, 0.4 | ||||
| 0.4, 0.8 | ||||
| 0.8, 1.5 |
| bin | bin | (nb) | (nb) | |||
|---|---|---|---|---|---|---|
| 1.5, 3.5 | 0.70, 0.33 | 0.010 | ||||
| 0.33, 0.18 | 0.008 | |||||
| 0.18, 0.09 | 0.006 | |||||
| 0.09, 0.02 | 0.002 | |||||
| 3.5, 6.5 | 0.70, 0.33 | 0.007 | ||||
| 0.33, 0.18 | 0.006 | |||||
| 0.18, 0.08 | 0.004 | |||||
| 0.08, 0.02 | 0.001 | |||||
| 6.5, 9.0 | 0.70, 0.25 | 0.005 | ||||
| 0.25, 0.08 | 0.004 | |||||
| 0.08, 0.02 | 0.001 | |||||
| 9.0, 14 | 0.70, 0.35 | 0.005 | ||||
| 0.35, 0.20 | 0.004 | |||||
| 0.20, 0.08 | 0.003 | |||||
| 0.08, 0.02 | 0.001 | |||||
| 14, 22 | 0.70, 0.35 | 0.004 | ||||
| 0.35, 0.20 | 0.003 | |||||
| 0.20, 0.08 | 0.003 | |||||
| 0.08, 0.02 | 0.001 | |||||
| 22, 44 | 0.70, 0.35 | 0.006 | ||||
| 0.35, 0.22 | 0.004 | |||||
| 0.22, 0.08 | 0.004 | |||||
| 0.08, 0.02 | 0.002 | |||||
| 44, 90 | 0.70, 0.28 | 0.006 | ||||
| 0.28, 0.14 | 0.004 | |||||
| 0.14, 0.02 | 0.003 | |||||
| 90, 200 | 0.70, 0.28 | 0.005 | ||||
| 0.28, 0.14 | 0.003 | |||||
| 0.14, 0.02 | 0.001 | |||||
| 200, 1000 | 0.70, 0.23 | 0.004 | ||||
| 0.23, 0.02 | 0.001 |
| () | extrapolation factor | ||||||
|---|---|---|---|---|---|---|---|
| 2 | 0.00003 | 4.17 | 0.983 | ||||
| 0.00007 | 3.02 | 0.817 | |||||
| 0.00018 | 3.07 | 0.672 | |||||
| 0.00035 | 4.72 | 0.591 | |||||
| 4 | 0.00007 | 3.84 | 1.140 | ||||
| 0.00018 | 2.68 | 0.930 | |||||
| 0.00035 | 2.67 | 0.808 | |||||
| 0.00100 | 3.93 | 0.652 | |||||
| 7 | 0.00018 | 3.18 | 1.195 | ||||
| 0.00060 | 2.34 | 0.907 | |||||
| 0.00150 | 3.31 | 0.737 | |||||
| 11 | 0.00018 | 3.29 | 1.447 | ||||
| 0.00035 | 2.21 | 1.229 | |||||
| 0.00100 | 2.11 | 0.948 | |||||
| 0.00300 | 2.95 | 0.724 | |||||
| 18 | 0.00035 | 2.96 | 1.476 | ||||
| 0.00060 | 1.94 | 1.280 | |||||
| 0.00150 | 1.90 | 1.001 | |||||
| 0.00300 | 2.69 | 0.831 | |||||
| 30 | 0.00060 | 2.47 | 1.510 | ||||
| 0.00100 | 1.70 | 1.303 | |||||
| 0.00150 | 1.69 | 1.160 | |||||
| 0.00600 | 2.44 | 0.772 | |||||
| 60 | 0.00150 | 1.84 | 1.384 | ||||
| 0.00300 | 1.54 | 1.107 | |||||
| 0.01200 | 2.24 | 0.710 | |||||
| 130 | 0.00300 | 1.60 | 1.290 | ||||
| 0.00600 | 1.51 | 1.005 | |||||
| 0.03000 | 2.51 | 0.575 | |||||
| 500 | 0.01200 | 1.57 | 0.905 | ||||
| 0.03000 | 2.42 | 0.624 |