Measurements of the Branching Fractions of Charged Decays
to Final States
B. Aubert
R. Barate
D. Boutigny
J.-M. Gaillard
A. Hicheur
Y. Karyotakis
J. P. Lees
P. Robbe
V. Tisserand
A. Zghiche
Laboratoire de Physique des Particules, F-74941 Annecy-le-Vieux, France
A. Palano
A. Pompili
Università di Bari, Dipartimento di Fisica and INFN, I-70126 Bari, Italy
J. C. Chen
N. D. Qi
G. Rong
P. Wang
Y. S. Zhu
Institute of High Energy Physics, Beijing 100039, China
G. Eigen
I. Ofte
B. Stugu
University of Bergen, Inst. of Physics, N-5007 Bergen, Norway
G. S. Abrams
A. W. Borgland
A. B. Breon
D. N. Brown
J. Button-Shafer
R. N. Cahn
E. Charles
C. T. Day
M. S. Gill
A. V. Gritsan
Y. Groysman
R. G. Jacobsen
R. W. Kadel
J. Kadyk
L. T. Kerth
Yu. G. Kolomensky
J. F. Kral
G. Kukartsev
C. LeClerc
M. E. Levi
G. Lynch
L. M. Mir
P. J. Oddone
T. J. Orimoto
M. Pripstein
N. A. Roe
A. Romosan
M. T. Ronan
V. G. Shelkov
A. V. Telnov
W. A. Wenzel
Lawrence Berkeley National Laboratory and University of California, Berkeley, CA 94720, USA
K. Ford
T. J. Harrison
C. M. Hawkes
D. J. Knowles
S. E. Morgan
R. C. Penny
A. T. Watson
N. K. Watson
University of Birmingham, Birmingham, B15 2TT, United Kingdom
K. Goetzen
T. Held
H. Koch
B. Lewandowski
M. Pelizaeus
K. Peters
H. Schmuecker
M. Steinke
Ruhr Universität Bochum, Institut für Experimentalphysik 1, D-44780 Bochum, Germany
N. R. Barlow
J. T. Boyd
N. Chevalier
W. N. Cottingham
M. P. Kelly
T. E. Latham
C. Mackay
F. F. Wilson
University of Bristol, Bristol BS8 1TL, United Kingdom
K. Abe
T. Cuhadar-Donszelmann
C. Hearty
T. S. Mattison
J. A. McKenna
D. Thiessen
University of British Columbia, Vancouver, BC, Canada V6T 1Z1
P. Kyberd
A. K. McKemey
Brunel University, Uxbridge, Middlesex UB8 3PH, United Kingdom
V. E. Blinov
A. D. Bukin
V. B. Golubev
V. N. Ivanchenko
E. A. Kravchenko
A. P. Onuchin
S. I. Serednyakov
Yu. I. Skovpen
E. P. Solodov
A. N. Yushkov
Budker Institute of Nuclear Physics, Novosibirsk 630090, Russia
D. Best
M. Bruinsma
M. Chao
D. Kirkby
A. J. Lankford
M. Mandelkern
R. K. Mommsen
W. Roethel
D. P. Stoker
University of California at Irvine, Irvine, CA 92697, USA
C. Buchanan
B. L. Hartfiel
University of California at Los Angeles, Los Angeles, CA 90024, USA
B. C. Shen
University of California at Riverside, Riverside, CA 92521, USA
D. del Re
H. K. Hadavand
E. J. Hill
D. B. MacFarlane
H. P. Paar
Sh. Rahatlou
V. Sharma
University of California at San Diego, La Jolla, CA 92093, USA
J. W. Berryhill
C. Campagnari
B. Dahmes
N. Kuznetsova
S. L. Levy
O. Long
A. Lu
M. A. Mazur
J. D. Richman
W. Verkerke
University of California at Santa Barbara, Santa Barbara, CA 93106, USA
T. W. Beck
J. Beringer
A. M. Eisner
C. A. Heusch
W. S. Lockman
T. Schalk
R. E. Schmitz
B. A. Schumm
A. Seiden
M. Turri
W. Walkowiak
D. C. Williams
M. G. Wilson
University of California at Santa Cruz, Institute for Particle Physics, Santa Cruz, CA 95064, USA
J. Albert
E. Chen
G. P. Dubois-Felsmann
A. Dvoretskii
D. G. Hitlin
I. Narsky
F. C. Porter
A. Ryd
A. Samuel
S. Yang
California Institute of Technology, Pasadena, CA 91125, USA
S. Jayatilleke
G. Mancinelli
B. T. Meadows
M. D. Sokoloff
University of Cincinnati, Cincinnati, OH 45221, USA
T. Abe
F. Blanc
P. Bloom
S. Chen
P. J. Clark
W. T. Ford
U. Nauenberg
A. Olivas
P. Rankin
J. Roy
J. G. Smith
W. C. van Hoek
L. Zhang
University of Colorado, Boulder, CO 80309, USA
J. L. Harton
T. Hu
A. Soffer
W. H. Toki
R. J. Wilson
J. Zhang
Colorado State University, Fort Collins, CO 80523, USA
D. Altenburg
T. Brandt
J. Brose
T. Colberg
M. Dickopp
R. S. Dubitzky
A. Hauke
H. M. Lacker
E. Maly
R. Müller-Pfefferkorn
R. Nogowski
S. Otto
J. Schubert
K. R. Schubert
R. Schwierz
B. Spaan
L. Wilden
Technische Universität Dresden, Institut für Kern- und Teilchenphysik, D-01062 Dresden, Germany
D. Bernard
G. R. Bonneaud
F. Brochard
J. Cohen-Tanugi
P. Grenier
Ch. Thiebaux
G. Vasileiadis
M. Verderi
Ecole Polytechnique, LLR, F-91128 Palaiseau, France
A. Khan
D. Lavin
F. Muheim
S. Playfer
J. E. Swain
University of Edinburgh, Edinburgh EH9 3JZ, United Kingdom
M. Andreotti
V. Azzolini
D. Bettoni
C. Bozzi
R. Calabrese
G. Cibinetto
E. Luppi
M. Negrini
L. Piemontese
A. Sarti
Università di Ferrara, Dipartimento di Fisica and INFN, I-44100 Ferrara, Italy
E. Treadwell
Florida A&M University, Tallahassee, FL 32307, USA
F. Anulli
Also with Università di Perugia, Perugia, Italy
R. Baldini-Ferroli
M. Biasini
Also with Università di Perugia, Perugia, Italy
A. Calcaterra
R. de Sangro
D. Falciai
G. Finocchiaro
P. Patteri
I. M. Peruzzi
Also with Università di Perugia, Perugia, Italy
M. Piccolo
M. Pioppi
Also with Università di Perugia, Perugia, Italy
A. Zallo
Laboratori Nazionali di Frascati dell’INFN, I-00044 Frascati, Italy
A. Buzzo
R. Capra
R. Contri
G. Crosetti
M. Lo Vetere
M. Macri
M. R. Monge
S. Passaggio
C. Patrignani
E. Robutti
A. Santroni
S. Tosi
Università di Genova, Dipartimento di Fisica and INFN, I-16146 Genova, Italy
S. Bailey
M. Morii
E. Won
Harvard University, Cambridge, MA 02138, USA
W. Bhimji
D. A. Bowerman
P. D. Dauncey
U. Egede
I. Eschrich
J. R. Gaillard
G. W. Morton
J. A. Nash
P. Sanders
G. P. Taylor
Imperial College London, London, SW7 2BW, United Kingdom
G. J. Grenier
S.-J. Lee
U. Mallik
University of Iowa, Iowa City, IA 52242, USA
J. Cochran
H. B. Crawley
J. Lamsa
W. T. Meyer
S. Prell
E. I. Rosenberg
J. Yi
Iowa State University, Ames, IA 50011-3160, USA
M. Davier
G. Grosdidier
A. Höcker
S. Laplace
F. Le Diberder
V. Lepeltier
A. M. Lutz
T. C. Petersen
S. Plaszczynski
M. H. Schune
L. Tantot
G. Wormser
Laboratoire de l’Accélérateur Linéaire, F-91898 Orsay, France
V. Brigljević
C. H. Cheng
D. J. Lange
D. M. Wright
Lawrence Livermore National Laboratory, Livermore, CA 94550, USA
A. J. Bevan
J. P. Coleman
J. R. Fry
E. Gabathuler
R. Gamet
M. Kay
R. J. Parry
D. J. Payne
R. J. Sloane
C. Touramanis
University of Liverpool, Liverpool L69 3BX, United Kingdom
J. J. Back
P. F. Harrison
H. W. Shorthouse
P. Strother
P. B. Vidal
Queen Mary, University of London, E1 4NS, United Kingdom
C. L. Brown
G. Cowan
R. L. Flack
H. U. Flaecher
S. George
M. G. Green
A. Kurup
C. E. Marker
T. R. McMahon
S. Ricciardi
F. Salvatore
G. Vaitsas
M. A. Winter
University of London, Royal Holloway and Bedford New College, Egham, Surrey TW20 0EX, United Kingdom
D. Brown
C. L. Davis
University of Louisville, Louisville, KY 40292, USA
J. Allison
R. J. Barlow
A. C. Forti
P. A. Hart
M. C. Hodgkinson
F. Jackson
G. D. Lafferty
A. J. Lyon
J. H. Weatherall
J. C. Williams
University of Manchester, Manchester M13 9PL, United Kingdom
A. Farbin
A. Jawahery
D. Kovalskyi
C. K. Lae
V. Lillard
D. A. Roberts
University of Maryland, College Park, MD 20742, USA
G. Blaylock
C. Dallapiccola
K. T. Flood
S. S. Hertzbach
R. Kofler
V. B. Koptchev
T. B. Moore
S. Saremi
H. Staengle
S. Willocq
University of Massachusetts, Amherst, MA 01003, USA
R. Cowan
G. Sciolla
F. Taylor
R. K. Yamamoto
Massachusetts Institute of Technology, Laboratory for Nuclear Science, Cambridge, MA 02139, USA
D. J. J. Mangeol
P. M. Patel
McGill University, Montréal, QC, Canada H3A 2T8
A. Lazzaro
F. Palombo
Università di Milano, Dipartimento di Fisica and INFN, I-20133 Milano, Italy
J. M. Bauer
L. Cremaldi
V. Eschenburg
R. Godang
R. Kroeger
J. Reidy
D. A. Sanders
D. J. Summers
H. W. Zhao
University of Mississippi, University, MS 38677, USA
S. Brunet
D. Cote-Ahern
C. Hast
P. Taras
Université de Montréal, Laboratoire René J. A. Lévesque, Montréal, QC, Canada H3C 3J7
H. Nicholson
Mount Holyoke College, South Hadley, MA 01075, USA
C. Cartaro
N. Cavallo
Also with Università della Basilicata, Potenza, Italy
G. De Nardo
F. Fabozzi
Also with Università della Basilicata, Potenza, Italy
C. Gatto
L. Lista
P. Paolucci
D. Piccolo
C. Sciacca
Università di Napoli Federico II, Dipartimento di Scienze Fisiche and INFN, I-80126, Napoli, Italy
M. A. Baak
G. Raven
NIKHEF, National Institute for Nuclear Physics and High Energy Physics, NL-1009 DB Amsterdam, The Netherlands
J. M. LoSecco
University of Notre Dame, Notre Dame, IN 46556, USA
T. A. Gabriel
Oak Ridge National Laboratory, Oak Ridge, TN 37831, USA
B. Brau
K. K. Gan
K. Honscheid
D. Hufnagel
H. Kagan
R. Kass
T. Pulliam
Q. K. Wong
Ohio State University, Columbus, OH 43210, USA
J. Brau
R. Frey
C. T. Potter
N. B. Sinev
D. Strom
E. Torrence
University of Oregon, Eugene, OR 97403, USA
F. Colecchia
A. Dorigo
F. Galeazzi
M. Margoni
M. Morandin
M. Posocco
M. Rotondo
F. Simonetto
R. Stroili
G. Tiozzo
C. Voci
Università di Padova, Dipartimento di Fisica and INFN, I-35131 Padova, Italy
M. Benayoun
H. Briand
J. Chauveau
P. David
Ch. de la Vaissière
L. Del Buono
O. Hamon
M. J. J. John
Ph. Leruste
J. Ocariz
M. Pivk
L. Roos
J. Stark
S. T’Jampens
G. Therin
Universités Paris VI et VII, Lab de Physique Nucléaire H. E., F-75252 Paris, France
P. F. Manfredi
V. Re
Università di Pavia, Dipartimento di Elettronica and INFN, I-27100 Pavia, Italy
P. K. Behera
L. Gladney
Q. H. Guo
J. Panetta
University of Pennsylvania, Philadelphia, PA 19104, USA
C. Angelini
G. Batignani
S. Bettarini
M. Bondioli
F. Bucci
G. Calderini
M. Carpinelli
V. Del Gamba
F. Forti
M. A. Giorgi
A. Lusiani
G. Marchiori
F. Martinez-Vidal
Also with IFIC, Instituto de Física Corpuscular, CSIC-Universidad de Valencia, Valencia, Spain
M. Morganti
N. Neri
E. Paoloni
M. Rama
G. Rizzo
F. Sandrelli
J. Walsh
Università di Pisa, Dipartimento di Fisica, Scuola Normale Superiore and INFN, I-56127 Pisa, Italy
M. Haire
D. Judd
K. Paick
D. E. Wagoner
Prairie View A&M University, Prairie View, TX 77446, USA
N. Danielson
P. Elmer
C. Lu
V. Miftakov
J. Olsen
A. J. S. Smith
H. A. Tanaka
E. W. Varnes
Princeton University, Princeton, NJ 08544, USA
F. Bellini
Università di Roma La Sapienza, Dipartimento di Fisica and INFN, I-00185 Roma, Italy
G. Cavoto
Princeton University, Princeton, NJ 08544, USA
Università di Roma La Sapienza, Dipartimento di Fisica and INFN, I-00185 Roma, Italy
R. Faccini
University of California at San Diego, La Jolla, CA 92093, USA
Università di Roma La Sapienza, Dipartimento di Fisica and INFN, I-00185 Roma, Italy
F. Ferrarotto
F. Ferroni
M. Gaspero
M. A. Mazzoni
S. Morganti
M. Pierini
G. Piredda
F. Safai Tehrani
C. Voena
Università di Roma La Sapienza, Dipartimento di Fisica and INFN, I-00185 Roma, Italy
S. Christ
G. Wagner
R. Waldi
Universität Rostock, D-18051 Rostock, Germany
T. Adye
N. De Groot
B. Franek
N. I. Geddes
G. P. Gopal
E. O. Olaiya
S. M. Xella
Rutherford Appleton Laboratory, Chilton, Didcot, Oxon, OX11 0QX, United Kingdom
R. Aleksan
S. Emery
A. Gaidot
S. F. Ganzhur
P.-F. Giraud
G. Hamel de Monchenault
W. Kozanecki
M. Langer
M. Legendre
G. W. London
B. Mayer
G. Schott
G. Vasseur
Ch. Yeche
M. Zito
DSM/Dapnia, CEA/Saclay, F-91191 Gif-sur-Yvette, France
M. V. Purohit
A. W. Weidemann
F. X. Yumiceva
University of South Carolina, Columbia, SC 29208, USA
D. Aston
R. Bartoldus
N. Berger
A. M. Boyarski
O. L. Buchmueller
M. R. Convery
D. P. Coupal
D. Dong
J. Dorfan
D. Dujmic
W. Dunwoodie
R. C. Field
T. Glanzman
S. J. Gowdy
E. Grauges-Pous
T. Hadig
V. Halyo
T. Hryn’ova
W. R. Innes
C. P. Jessop
M. H. Kelsey
P. Kim
M. L. Kocian
U. Langenegger
D. W. G. S. Leith
S. Luitz
V. Luth
H. L. Lynch
H. Marsiske
R. Messner
D. R. Muller
C. P. O’Grady
V. E. Ozcan
A. Perazzo
M. Perl
S. Petrak
B. N. Ratcliff
S. H. Robertson
A. Roodman
A. A. Salnikov
R. H. Schindler
J. Schwiening
G. Simi
A. Snyder
A. Soha
J. Stelzer
D. Su
M. K. Sullivan
J. Va’vra
S. R. Wagner
M. Weaver
A. J. R. Weinstein
W. J. Wisniewski
D. H. Wright
C. C. Young
Stanford Linear Accelerator Center, Stanford, CA 94309, USA
P. R. Burchat
A. J. Edwards
T. I. Meyer
B. A. Petersen
C. Roat
Stanford University, Stanford, CA 94305-4060, USA
S. Ahmed
M. S. Alam
J. A. Ernst
M. Saleem
F. R. Wappler
State Univ. of New York, Albany, NY 12222, USA
W. Bugg
M. Krishnamurthy
S. M. Spanier
University of Tennessee, Knoxville, TN 37996, USA
R. Eckmann
H. Kim
J. L. Ritchie
R. F. Schwitters
University of Texas at Austin, Austin, TX 78712, USA
J. M. Izen
I. Kitayama
X. C. Lou
S. Ye
University of Texas at Dallas, Richardson, TX 75083, USA
F. Bianchi
M. Bona
F. Gallo
D. Gamba
Università di Torino, Dipartimento di Fisica Sperimentale and INFN, I-10125 Torino, Italy
C. Borean
L. Bosisio
G. Della Ricca
S. Dittongo
S. Grancagnolo
L. Lanceri
P. Poropat
L. Vitale
G. Vuagnin
Università di Trieste, Dipartimento di Fisica and INFN, I-34127 Trieste, Italy
R. S. Panvini
Vanderbilt University, Nashville, TN 37235, USA
Sw. Banerjee
C. M. Brown
D. Fortin
P. D. Jackson
R. Kowalewski
J. M. Roney
University of Victoria, Victoria, BC, Canada V8W 3P6
H. R. Band
S. Dasu
M. Datta
A. M. Eichenbaum
J. R. Johnson
P. E. Kutter
H. Li
R. Liu
F. Di Lodovico
A. Mihalyi
A. K. Mohapatra
Y. Pan
R. Prepost
S. J. Sekula
J. H. von Wimmersperg-Toeller
J. Wu
S. L. Wu
Z. Yu
University of Wisconsin, Madison, WI 53706, USA
H. Neal
Yale University, New Haven, CT 06511, USA
Abstract
We present results of searches for -meson decays to
with the BABAR detector.
With a data sample of 61.6 million pairs,
we measure the branching fractions and 90% confidence-level upper limits
averaged over charge-conjugate states (the first error is statistical and the second is systematic):
,
,
,
and
( non-resonant) .
The study of charmless hadronic decays can make important
contributions to our understanding of hadronic decays and violation in the Standard Model BBNS . Branching fraction
predictions for meson decays to Pseudoscalar–Vector final states
have recently been calculated using QCD Factorisation
and SU(3) flavor symmetry models BN ; noel ; GR . The measurement of
meson conjugates decays to the final state via
intermediate resonances can be used to search for weak phases and
direct violation. The signal can be used to examine the
light-meson mass spectrum PDG ; Minkowski:2003ja . The charm
state might be sensitive to the angle of the
Unitarity Triangle through interference with the non-resonant
component producing an observable charge asymmetry gamma2 ; the
branching fraction also constrains some models for charmonium hybrid
production close .
The data used in this analysis were collected at the PEP-II asymmetric
storage ring with the BABAR detector babar .
The BABAR detector consists of a five-layer silicon tracker, a drift chamber, a
new type of Cherenkov detector DIRC , an electromagnetic
calorimeter and a magnet with instrumented flux return.
The data sample
has an integrated luminosity of 56.4 collected at the
resonance, which corresponds to pairs
(). We assume that the decays equally to neutral and
charged meson pairs.
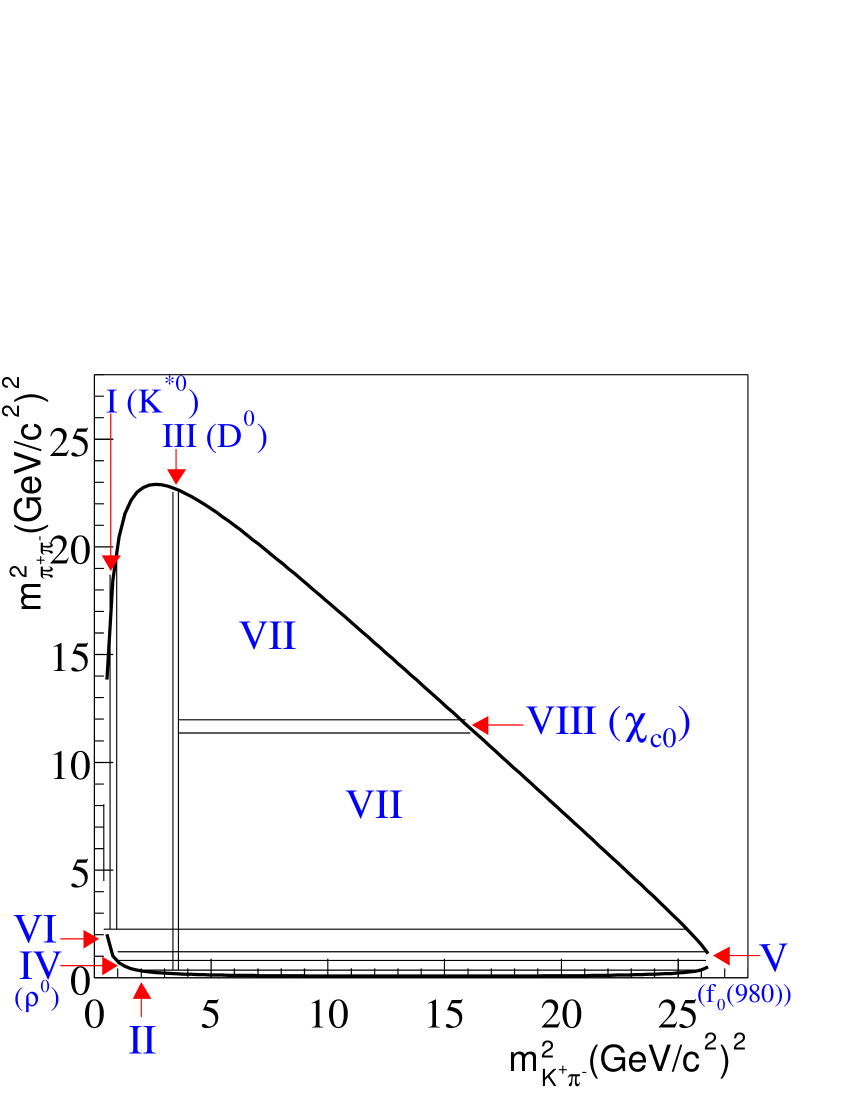
The phase space can be represented in a Dalitz plot,
in which the many resonant decay modes form overlapping bands and
interference occurs where the bands overlap Dalitz .
As a consequence, the whole Dalitz plot should
be considered before assigning a branching fraction to a specific mode.
However, the data sample is not large enough for a full Dalitz plot fit
to be effective.
In this analysis, the Dalitz plot is divided into eight regions,
reflecting as much as possible the known decay modes.
We first determine the yields in these regions using a maximum-likelihood fit.
We then interpret the yields as branching fractions, assuming a
particular collection of quasi-two-body decay modes.
We evaluate the systematic uncertainty due to the particular choice
of decay modes and the effect of
interference between the different contributions.
Figure 1: A Dalitz plot showing the defined regions.
The regions are defined in and , the invariant masses
of the neutral and systems, as given in
Table 1 and illustrated in Fig. 1.
Region I is expected to be dominated by .
Region II could have contributions from several higher resonances.
Region III is dominated by the production of .
The high branching fraction for this mode allows it to be used to
correct for differences between data and
simulated events and to evaluate systematic uncertainties.
Regions IV and V are expected to be dominated by
and , respectively.
The resonance contributions to Region VI are not known a priori.
The area where these regions intersect the band,
, is excluded.
Region VII could contain higher mass charmless and charmonium
resonances, as well as a non-resonant contribution that extends across
the whole Dalitz plot.
Region VIII is dominated by . This channel is vetoed from other regions
using .
Table 1: Regions of the Dalitz plot and signal yields obtained (the first error is statistical and the second is systematic). The band, , is excluded from all regions except region III, and the band, , is excluded from all regions except region VIII.
Region
Selection Criteria ()
Signal Yield
I
,
II
,
III
IV
V
VI
VII
,
VIII
,
Candidate mesons are formed by combining three charged tracks, where
each track is required to have at least 12 hits in the drift chamber, to
have transverse momentum of at least 100 and to be consistent with
originating from the beam-spot. Charged pions and kaons are identified
using energy loss () measured in the tracking system and the
Cherenkov angle and number of photons measured by the Cherenkov
detector. Pions are required to fail the kaon selection.
The efficiency of selecting kaons is approximately 80%,
while the probability of misidentifying pions as kaons is
below 5%, up to a laboratory momentum of 4.0 .
Pions are also required to fail an electron selector which uses
, the energy to momentum ratio and the shape of the calorimeter signal.
Over 99% of pions from the signal decay pass this requirement.
Signal decays are identified using two kinematic variables: ,
the difference between the center-of-mass (CM) energy of the
candidate and , where is the total CM energy;
and the beam-energy-substituted mass , where is the momentum
of the reconstructed candidate and () is the
four-momentum of the initial system. The and
distributions for signal events have widths of and
, respectively. We require and
for events entering the fit. Events with are used for continuum background
characterisation as described below.
A very small proportion of events, fewer than 4%,
have two or more candidates that pass the above requirements.
For these events a single candidate is selected at random, so as not to bias the fit distributions.
This random selection has a minimal impact on the efficiency,
and any systematic uncertainty due to this effect is negligible.
A single candidate per event is similarly selected for the data with
used in continuum background characterisation.
Continuum light-quark and charm production is the dominant source of background.
This is suppressed using two event-shape variables.
The first is the cosine of the angle between the thrust axis
of the selected candidate and the thrust axis of the rest of the event.
For continuum background, the distribution of is strongly
peaked towards unity whereas the distribution is uniform for signal events.
We require .
The second event-shape variable is a Fisher discriminant () Fisher .
For we use a linear combination of the cosine of the
angle between the -candidate
momentum and the beam axis, the cosine of the angle between the -candidate
thrust axis and the beam axis, and the energy flow of the rest of
the event into each of nine contiguous, concentric, cones around the
thrust axis of the reconstructed CLEOCones .
There are also -decay backgrounds, mainly four-body decays,
and three-body decays with one or more particles misidentified.
These backgrounds are studied using Monte Carlo simulations (MC).
They are reduced by the particle identification selections and
by excluding events containing or decays to
with vetoes
and , however some -decay backgrounds
remain and must be accounted for.
For backgrounds contributing only a few events to the maximum-likelihood (ML)
fit, the estimated contribution is subtracted from the final signal
yield with a systematic uncertainty to account for the unknown
probability of the background to be selected as signal in the fit. Larger
backgrounds are parameterized in the ML fit as described below.
These were in regions II and
VII, with and in region VII and
with , in regions IV and V.
We form probability density functions (PDFs) with parameters for
the three variables () , , and in each region.
We find the correlations among these variables to be negligible;
accordingly, for each hypothesis (signal, continuum background, and background),
we form a product
that models that hypothesis.
The likelihood for an event is the sum over the hypotheses of the products ,
with each product weighted by the number of events (to be determined), ,
for that hypothesis.
A product over the events in the data sample of the event likelihoods
along with a Poisson factor forms the likelihood function:
(1)
This likelihood is maximized to obtain for the signal and
continuum background components; for the -background
component is fixed to an estimate of the contribution from MC.
The parameters of the
signal and -background PDFs are determined from MC and held fixed
in the final fit. The continuum background parameters for
are fixed from the data with .
The continuum background parameters for and are left free in the final fit.
Each PDF is a Gaussian distribution for signal, and an ARGUS threshold
function Argus for continuum background. Each PDF is a
sum of two Gaussian distributions with equal means for the signal and
a first-degree polynomial for the continuum background. The signal
and background PDFs are Gaussian distributions with
different widths above and below the mean. For the -background
parameterizations, signal or continuum shapes are used depending on
the nature of the background.
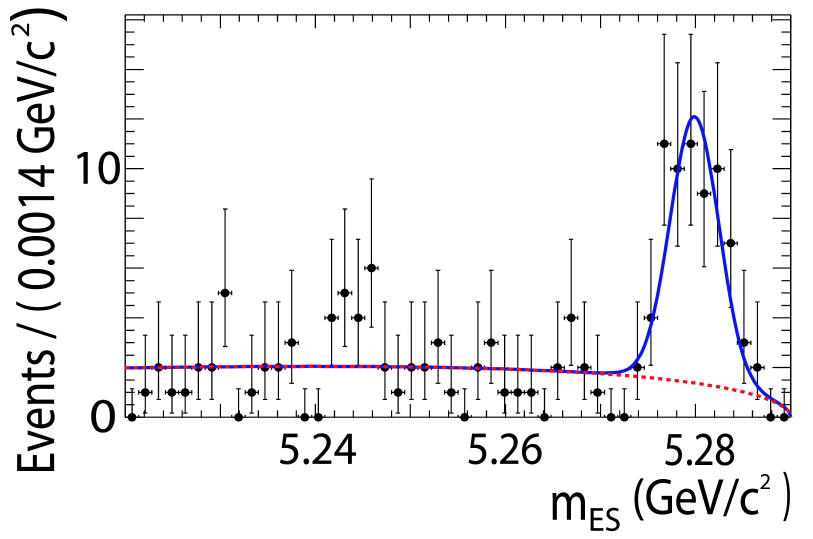
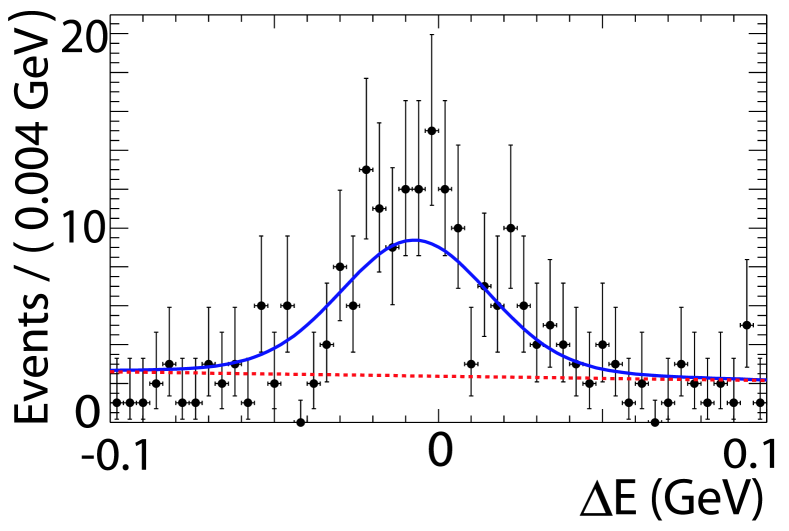
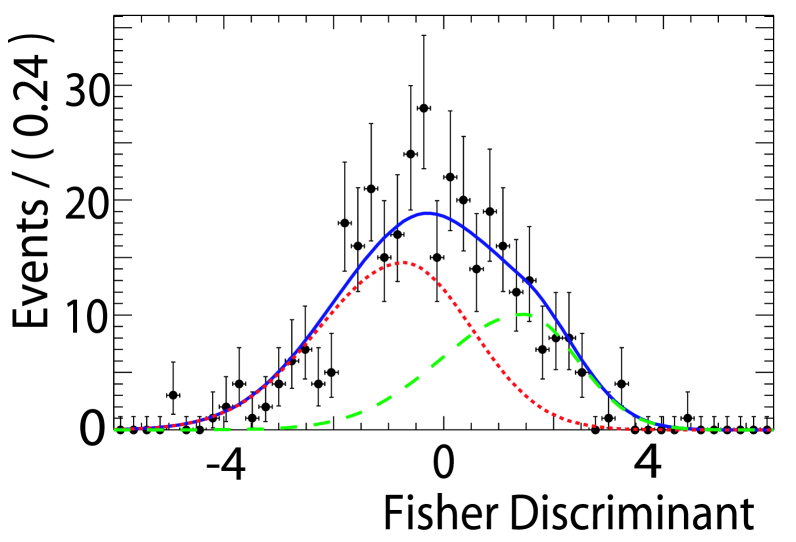
The projections of the Region I data in , and
and the results of the fit are shown in Fig. 2,
demonstrating a clear signal.
The data in the plots pass a selection on the
per-event signal-to-background likelihood ratio
formed from the other two fit variables, which has been
optimized to give the greatest significance to the signal.
Figure 2: Projection plots in , and ,
for the data in Region I.
The superimposed curve is a projection of the full fit with the
background component shown as a dotted line and,
for , the signal component shown as a dashed line.
The signal yields for the regions of the Dalitz plot are
shown in Table 1. The systematic uncertainty
arises from the PDF parameters and from -background subtraction.
We find that all yields have a significance greater than five standard
deviations, where
is used as an estimator of the significance.
We calculate the branching fractions from the measured yields, taking
into account the overlapping nature of the resonances, using
where Y is
a vector of the yields in each Dalitz region and is a vector of
branching fractions. M is the efficiency matrix where
is the probability that an event arising from
the contribution dominating region will be found in region .
The elements of M are estimated using MC including small corrections for
differences in tracking and in particle identification efficiencies between MC and data, and
differences between MC and our resonance model.
Table 2: A summary of the model used to calculate branching fractions. Alternative lineshapes are given in parentheses. The masses and widths are taken from the Review of Particle Physics PDG .
In our resonance model we assume one dominant contribution per region.
The contributions for the chosen model are given in Table 2.
For Regions II and VI where the main contributions are not known a priori,
we take the dominant contributions to be and
respectively.
However, we quote branching fractions for
“higher ” where “higher ” means any
combination of and and
“higher ”, where “higher ” means any combination
of , and .
Non-relativistic Breit–Wigner line shapes are used for
all channels except for the broad resonance, where we use a
relativistic Breit–Wigner line shape with Blatt–Weisskopf damping
BlattW .
We evaluate systematic uncertainties on the branching fractions
taking into consideration uncertainties on resonance parameters and
alternative line shapes given in Table 2.
We also include the effect on all branching fractions that in
Regions II and VI, the dominant contribution could be any
combination of a number of resonances.
Also included in the systematic uncertainties is the possibility that the
yield measured in Region VII
is from a resonant component and does not extend into the other regions.
Uncertainties on the branching fractions due to the interference between
the resonances are evaluated by generating many simulated Dalitz plots with all the contributions having random
phases and observing how the interference between the contributions affects
the measured branching fractions.
The branching fractions and uncertainties of intermediate resonances
are given in Table 3.
Table 3: The measured branching fractions and uncertainties. The first uncertainty is statistical, the second includes the systematic uncertainties from the yields and the efficiencies, the third is the model uncertainty, and the fourth is the uncertainty due to interference.
Channel
BF
“higher ”,
,
,
“higher ”,
Non-resonant
,
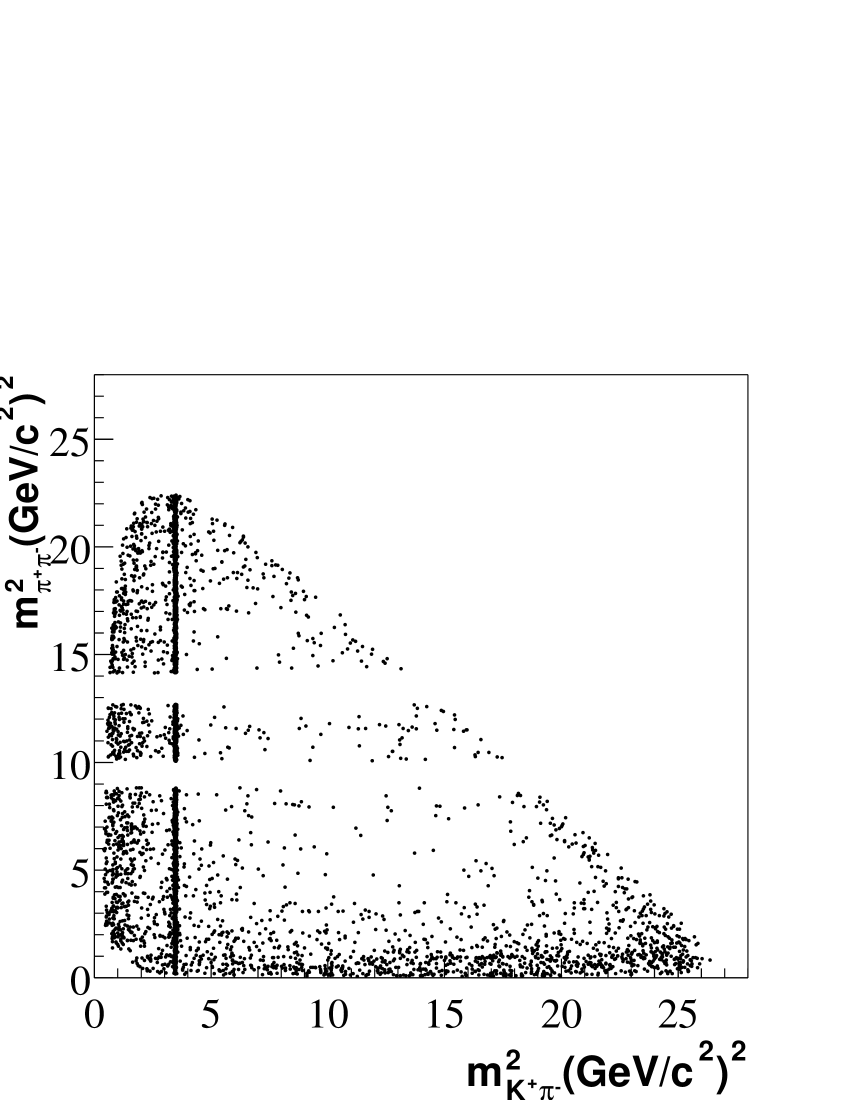
Figure 3: Dalitz plots showing (left) the observed distribution in a signal region (defined in the text) and (right) the distribution for continuum background from the sideband. Vetoes reject events with and .
Fig. 3 shows the Dalitz plot for data events
within a signal region, , that have a
the per-event signal-to-background likelihood ratio
formed from the and PDFs, greater than 5.
Both signal and background
events appear in the plot. The signal is the narrow band in
the spectrum. To illustrate the expected background
distribution, events passing the same likelihood selection but having
a value of between are also shown.
The size of this sideband is chosen to contain approximately the
expected number of background events that will enter the signal-region plot.
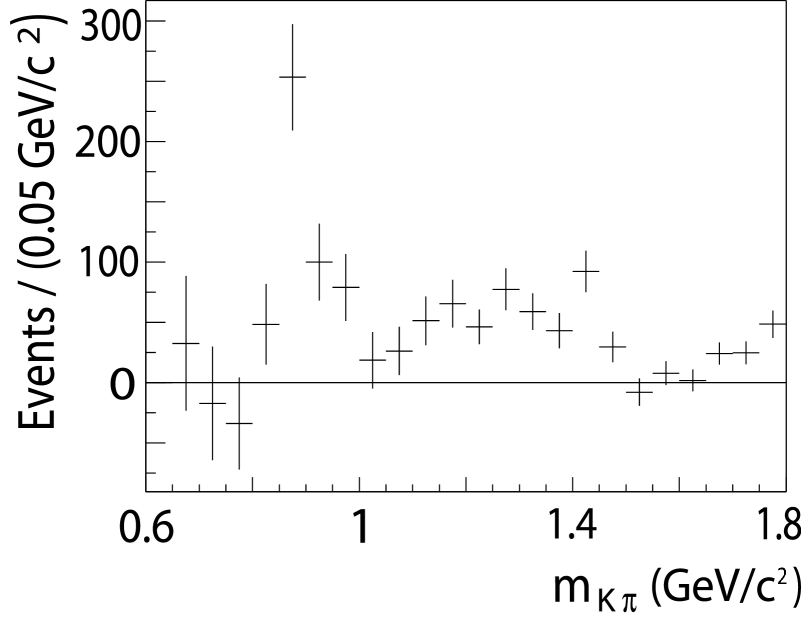
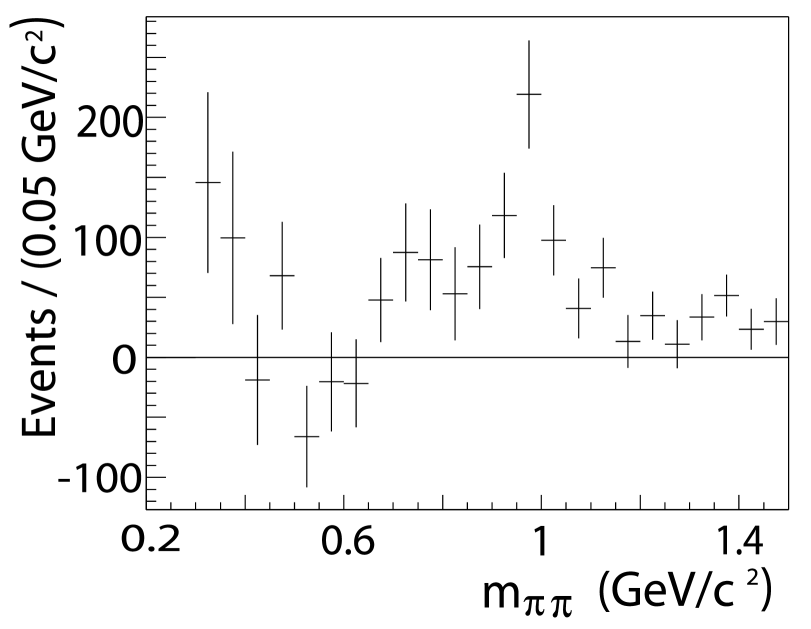
Figure 4:
Background-subtracted and efficiency-corrected projections of the Dalitz plot in and .
Fig. 4 shows background-subtracted,
efficiency–corrected projections of the two-body invariant mass spectra,
and , from to and
from to respectively.
The signal events and background distributions are obtained by the same
method as for Fig. 3 and again
the , and vetoes are applied.
Peaks at the and masses
are clearly visible.
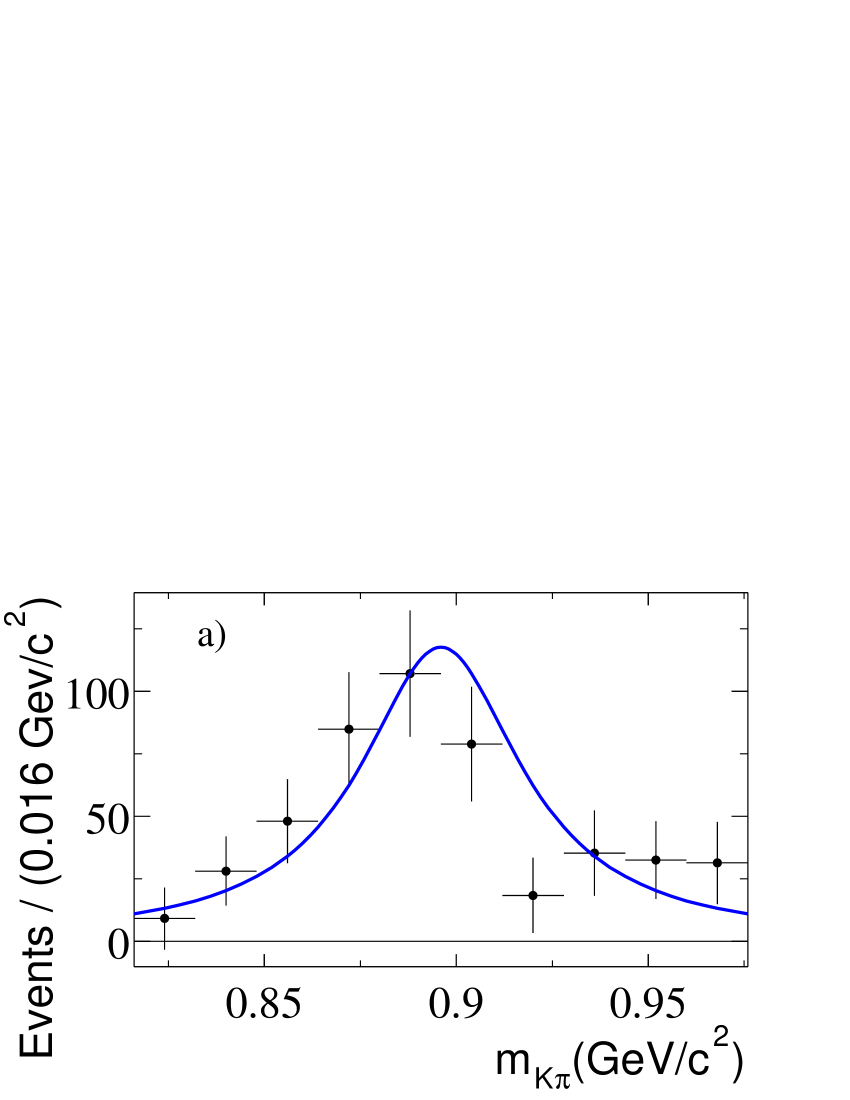
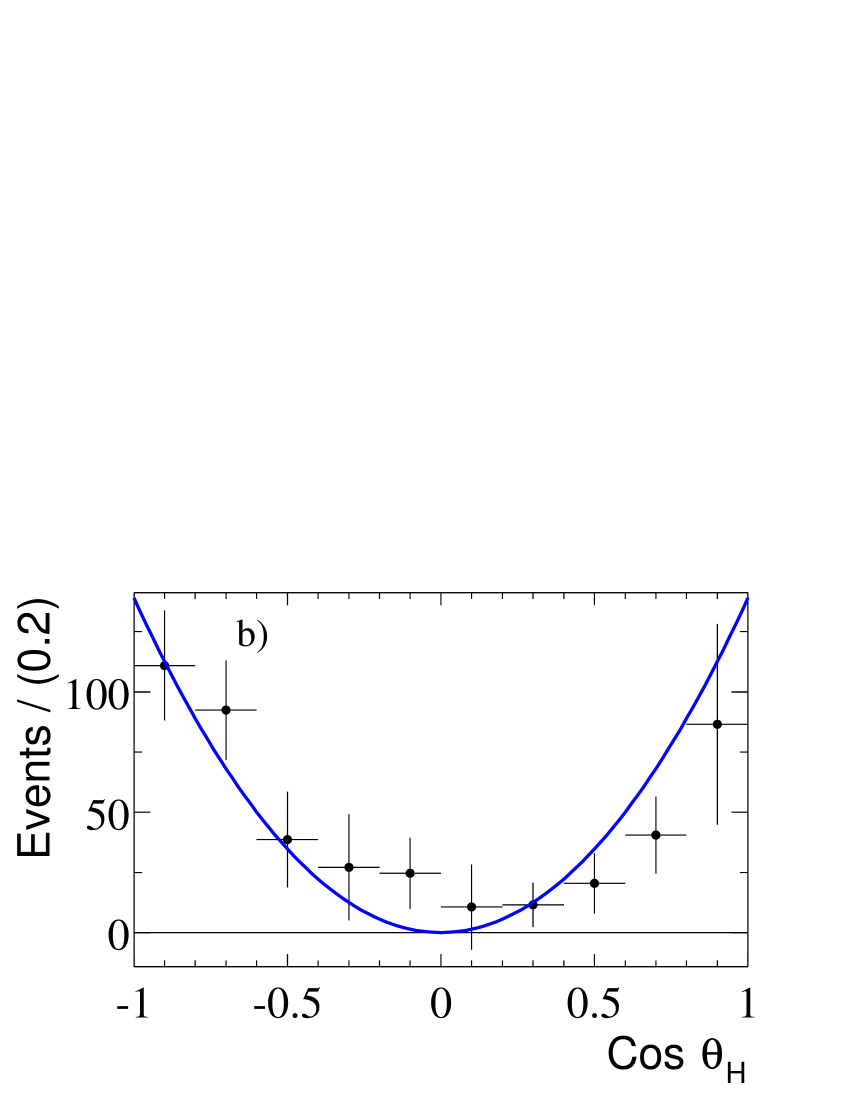
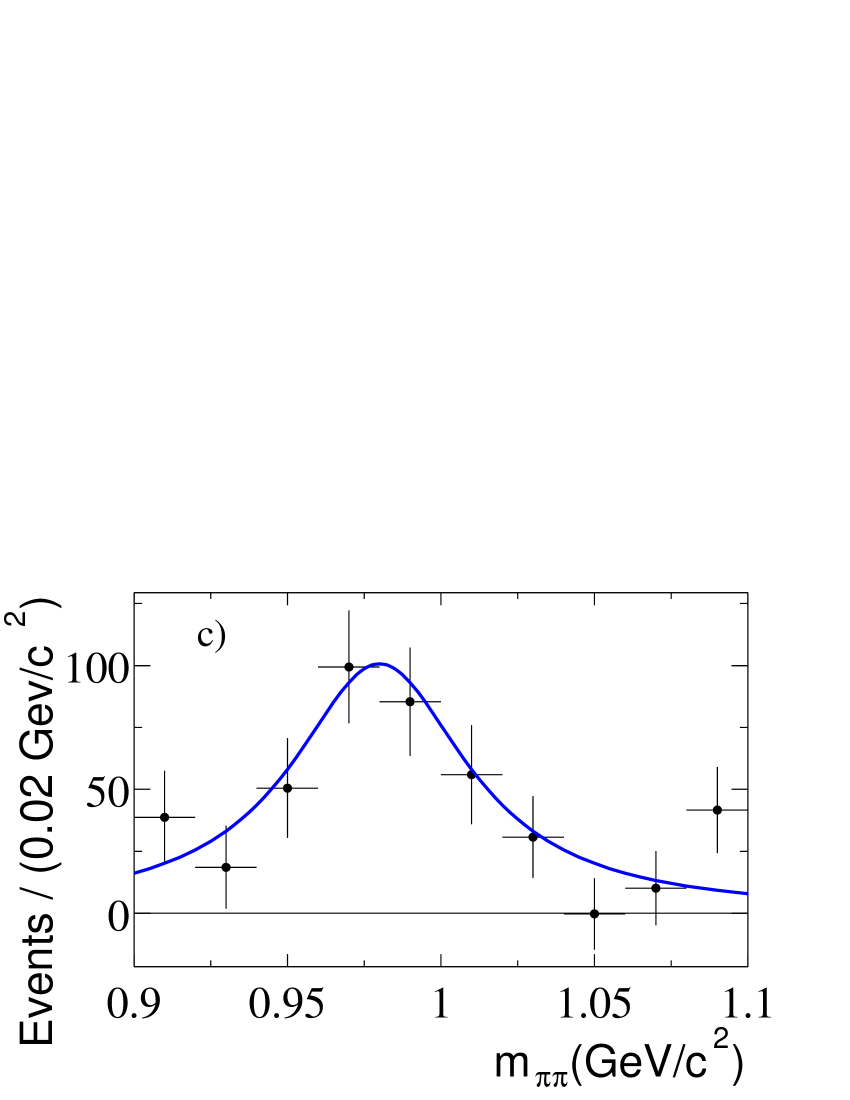
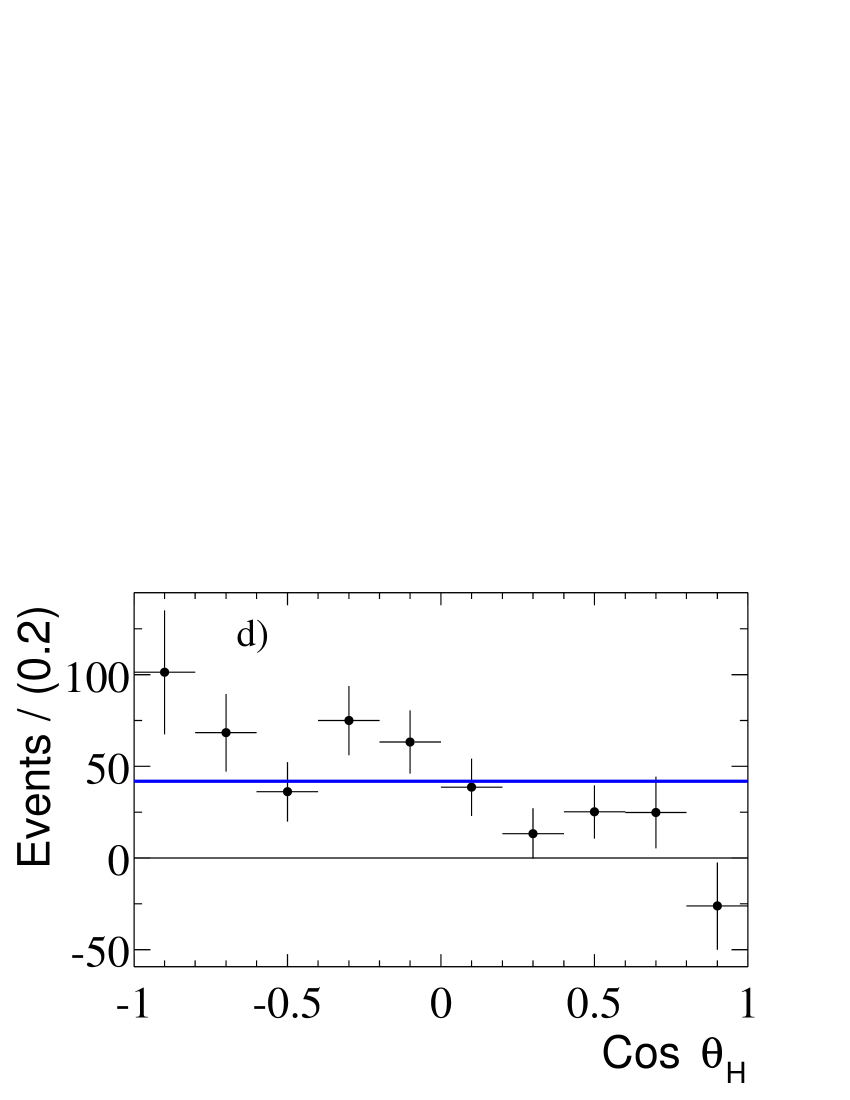
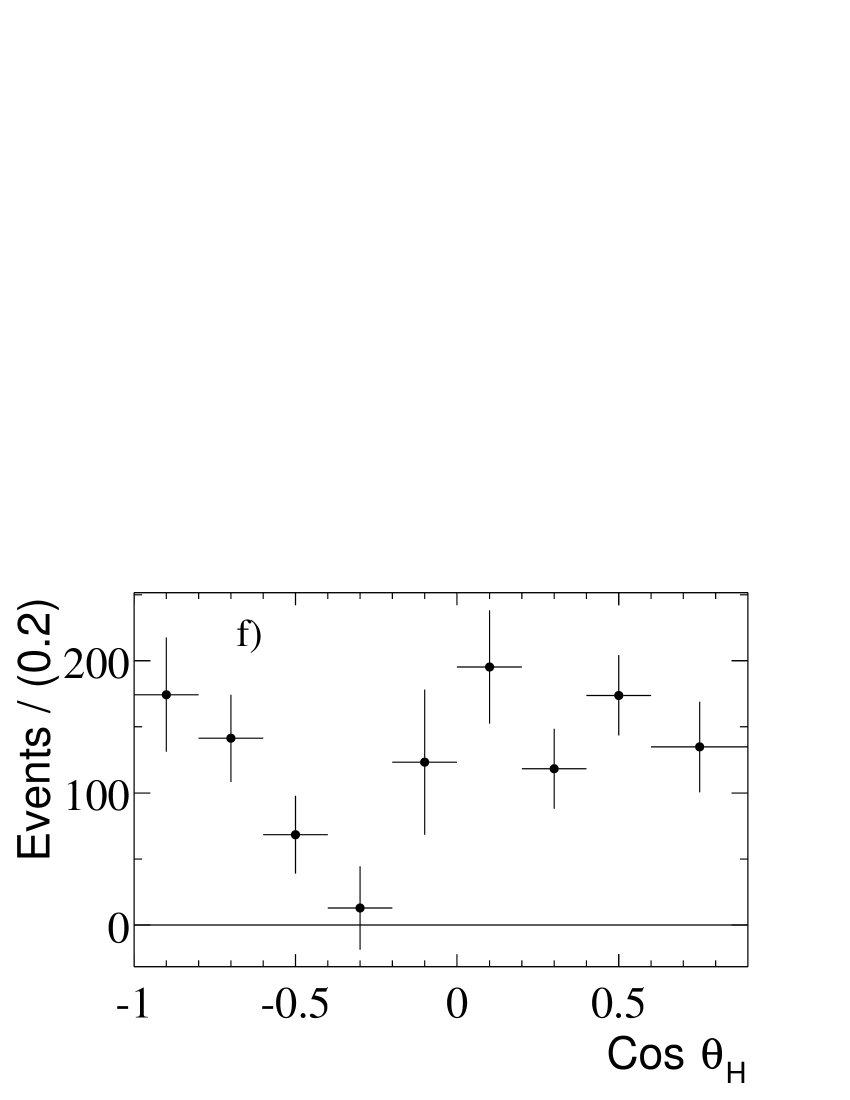
Figure 5:
Projection plots of the two-body invariant mass and
for, from top to bottom, Regions I, V and II.
The invariant mass or ,
and helicity angle between the resonance decay and flight directions,
, are not used in the likelihood fit.
However, to illustrate our findings, we show, in
Fig. 5, resonant mass and projections
for Regions I, IV and II after background subtraction and
efficiency corrections.
Figs. 5(a–d) have been overlaid with the
distribution of the expected dominant resonance: Breit–Wigner line
shapes for the mass distributions in
Figs. 5(a) and 5(c),
for the
distribution in Fig. 5(b),
and a uniform distribution for the scalar
distribution in Fig. 5(d).
There is good agreement between the overlaid and observed distributions
indicating that the expected resonances are indeed dominant in these regions.
The distribution suggests a linear dependence
that is most likely due to interference with the vector , which is
taken into account in our interference systematic uncertainty.
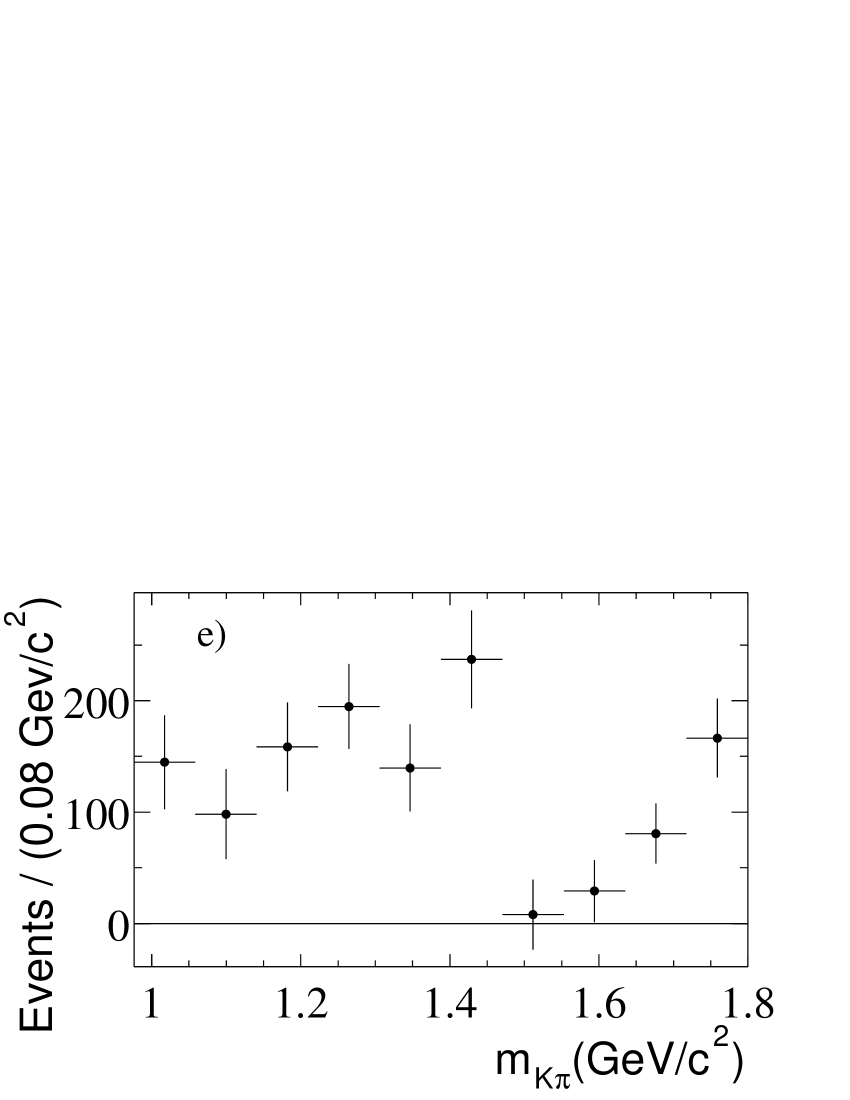
We can see in Fig 4, there is a large signal
in the region (Region II).
This is shown in more detail in Fig. 5(e), resonant
mass, and Fig. 5(f), the projections
for Region II.
The complex behavior of this signal is
similar to that observed by LASS LASS and precludes
an interpretation as a single resonance.
In conclusion, we have made branching fraction measurements,
summarized in Table 3, for a number of charm and
charmless decay channels with the final state .
This analysis has taken into account the uncertainty in the knowledge
of the nature and parameterization of the intermediate resonances on all
the branching fractions assuming a non-resonant contribution with kinematics
defined by phase space.
The results also take account of the unknown levels of interference between
the different contributions.
The and results agree with previous measurements D0br ; chickbr .
The kstbr and branching fractions are consistent with,
and more precise than, previous measurements BelleNew .
The result is significantly higher than predicted by many factorization
models noel .
The observation of the decay provides hints about the nature of the Minkowski:2003ja .
A large signal is seen for “higher ” where “higher ” means any
combination of and .
We also give 90% confidence-level upper limits for the branching fractions of the
following channels:
,
non-resonant,
“higher ”.
The tight limit on the non-resonant component means that its
-dependent interference with the final state will be
very hard to measure.
We are grateful for the excellent luminosity and machine conditions
provided by our PEP-II colleagues,
and for the substantial dedicated effort from
the computing organizations that support BABAR.
The collaborating institutions wish to thank
SLAC for its support and kind hospitality.
This work is supported by
DOE
and NSF (USA),
NSERC (Canada),
IHEP (China),
CEA and
CNRS-IN2P3
(France),
BMBF and DFG
(Germany),
INFN (Italy),
FOM (The Netherlands),
NFR (Norway),
MIST (Russia), and
PPARC (United Kingdom).
Individuals have received support from CONACyT (Mexico), A. P. Sloan Foundation,
Research Corporation,
and Alexander von Humboldt Foundation.
References
(1)
M. Beneke, et al.,
Nucl. Phys. B 591, 313 (2000).
(2)
M. Beneke and M. Neubert,
Nucl. Phys. B 675, 333 (2003).
(3)
W. N. Cottingham, et al.,
J. Phys. G 28, 2843 (2002).
(4)
Cheng-Wei Chiang, et al.,
Phys. Rev. D 69, 034001 (2004).
(5)
Throughout this paper, flavor-eigenstate decay modes imply also their charge conjugate.
(6)
Particle Data Group, K. Hagiwara, et al.,
Phys. Rev. D 66, 010001 (2002).
(7)
P. Minkowski and W. Ochs,
hep-ph/0304144.
(8)
S. Fajfer, R. J. Oakes and T. N. Pham,
Phys. Lett. B 539, 67 (2002).
(9)
F. E. Close and S. Godfrey
Phys. Lett. B 574, 210 (2003).
(10)BABAR Collaboration, B. Aubert, et al.,
Nucl. Instr. Meth. A 479, 1 (2002).
(11)
J. Schwiening, et al., NIM A 502, 67-75 (2003).
(12)
R. H. Dalitz,
Phil. Mag. 44, 1068 (1953).
(13)
R. A. Fisher,
Ann. Eugenics 7, 179 (1936);
G. Cowan,
Statistical Data Analysis, 51 (Oxford University Press, 1998).
(14)
CLEO Collaboration, D. M. Asner, et al.,
Phys. Rev. D 53, 1039 (1996).
(15)
ARGUS Collaboration, H. Albrecht, et al.,
Z. Phys. C 48, 543 (1990).
(16)
LASS Collaboration, D. Aston, et al.,
Nucl. Phys. B 296, 493 (1988).
(17)
J. M. Blatt and V. F. Weisskopf,
Theoretical Nuclear Physics 361 (Wiley, New York, 1952).
(18)
S. M. Flatté,
Phys. Lett. B 63, 224 (1976).
(19)
CLEO Collaboration, Phys. Rev. D 66, 031101(R) (2002)
(20)
Belle Collaboration, K. Abe, et al.,
Phys. Rev. Lett. 88, 031802 (2002)
(21)
The comparison takes into account that the secondary branching fraction
of is .
(22)
Belle Collaboration, K. Abe, et al.,
Phys. Rev. D 65, 092005 (2002).