8000
2003
Meson Spectroscopy in Photo-production at CLAS
Abstract
Photo-production of excited mesons in the GeV mass range decaying via multi-pion or multi-kaon emission has been investigated at the TJNAF††thanks: This work was supported by the U.S. Department of Energy and The U.S. National Science Foundation. experiment E01-017 (g6c) in the GeV photon beam energy range. The main objective of the experiment is to extract resonance parameters of the produced states by way of a Partial Wave Analysis (PWA) technique. In this paper, we will focus on the general characteristics of the data distributions in both the neutral and charged 3-pion final states, i.e. and .
Keywords:
Document processing, Class file writing, LaTeX 2ε:
43.35.Ei, 78.60.Mq1 Introduction
The observation of an isovector exotic state with quantum numbers at GeV by the Brookhaven E852 experiment S. U. Chung et al. (2002) provided the main motivation to search for such a state using a photon beam at JLab. This state is one of the signature hadronic states outside the constituent quark model, where either the excitation of the gluons within the hadron directly contributes to its degrees of freedom, giving a state configuration of , or that the state is composed of more than one pair, i.e. . Such a state, if produced in a pion beam via exchange, may also be produced in a photon beam, with the role of the beam and the exchange particle reversed and assuming Vector Meson Dominance (VMD) A. V. Afanasev and A. P. Szczepaniak (2000); A. V. Afanasev and P. R. Page (1998); F. E. Close and P. R. Page (1995). Photon beams, as probes for exotic meson production, have not been fully explored so far; the existing data on multi-particle final states are very sparse. The only relevant data comes from a SLAC bubble chamber experiment which employed a backscattered laser photon beam of GeV average energy G. T. Condo et al. (1991). In the low mass region, the data is dominated by production with no clear evidence for . In the high mass region, the group claimed evidence for a narrow state at GeV, with possible , or quantum numbers. Because of insufficient statistics, no PWA was performed on the data.
2 Experimental Setup and event selection.
The data for this analysis was collected during Aug.–Sep. of 2001. The nA primary beam of GeV electrons at duty factor and was provided by CEBAF (Continuous Electron Beam Accelerator Facility). The secondary beam of photons was generated in Hall B via bremsstrahlung radiation, using a radiator and a tagging system identifying photons in the range of the incident electron beam energy D. I. Sober et al. (2000). The high flux of photons (in the top of the photon beam energy) was incident on an cm long target. The Hall B experimental hall houses the CLAS (CEBAF Large Acceptance Spectromenter) detector. CLAS covers a large solid angle with polar angle coverge in the range , and azimuthal angle coverage of . The detector, composed of six independent sectors, provides a toroidal magnetic field, where positively charged particles bend outward and negatively charged tracks bend inward. Three sets of drift chambers in the radial direction are embedded in the space between the coils, and provide charged particle detection and track reconstruction. A set of time of flight scintillators are used for charged particle identification, and a set of electromagnetic calorimeters are used for neutral particle detection. Details of the CLAS detector design and performance are described elsewhere B. A. Mecking et al. (2003).
The lack of acceptance in the forward region () presents a drawback to any meson spectroscopy program at CLAS in its current configuration. In addition, with the maximum available photon beam energy of GeV, there is a significant contribution from -channel baryon resonance production.
Both neutral and charged final states were subjected to similar topological and geometrical cuts. The photon beam energy was selected to be higher than GeV; vertex position cuts were applied to ensure the events originated within the target volume, and vertex timing constraints were imposed to reduce the accidentals between the CLAS and the tagging system.
3 Data Distributions:
The , , and were detected in CLAS, and the neutron was reconstructed by way of missing mass. In order to suppress the -channel baryon background, we have employed two kinematical cuts, a low four-momentum transfer to the cut defined as GeV2, and the other, a small lab polar angle cut imposed on the two positively charged pions defined as . These two cuts, referred to as “baryon rejection cuts”, discard mostly events associated with background processes. In all the plots shown for this final state, the shaded histograms represent the events that passed these two cuts collectively.
The left plot in Fig. 1 shows the missing mass off the for low events. The neutron peak sits on top of a negligible linearly increasing background, with a signal to background ratio of approximately . A Gaussian plus a order polynomial fit to the peak gives a of MeV. The area between the lines around the neutron peak represents the neutron selection cut. The distribution shown in the middle plot of Fig. 1 is fit to an exponential function of the form . The shape of the distribution is consistent with the characteristics of peripheral production, and the exponential constant of is consistent with and exchange M. Guidal, J. M. Laget, M. Vanderhaeghen (1997). In the invariant mass spectrum shown in the right plot of Fig. 1 two enhancements are evident, one in the MeV region, and another in the MeV range.
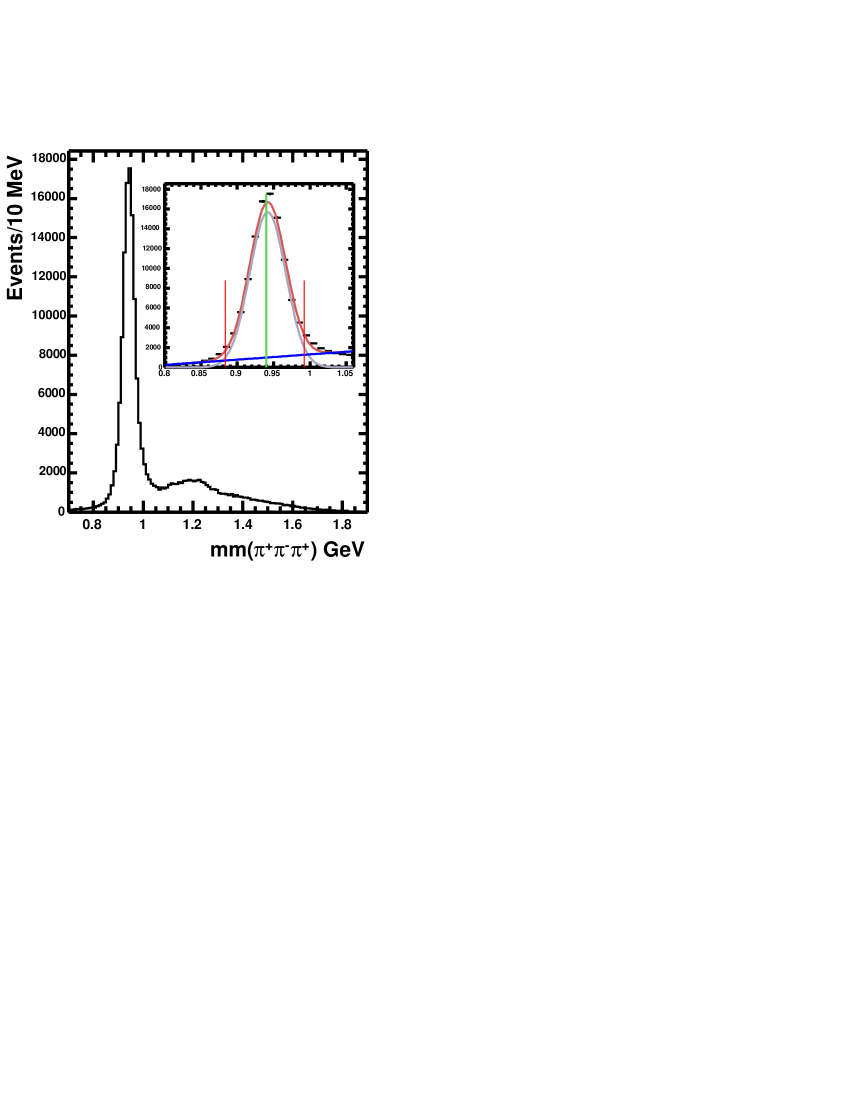
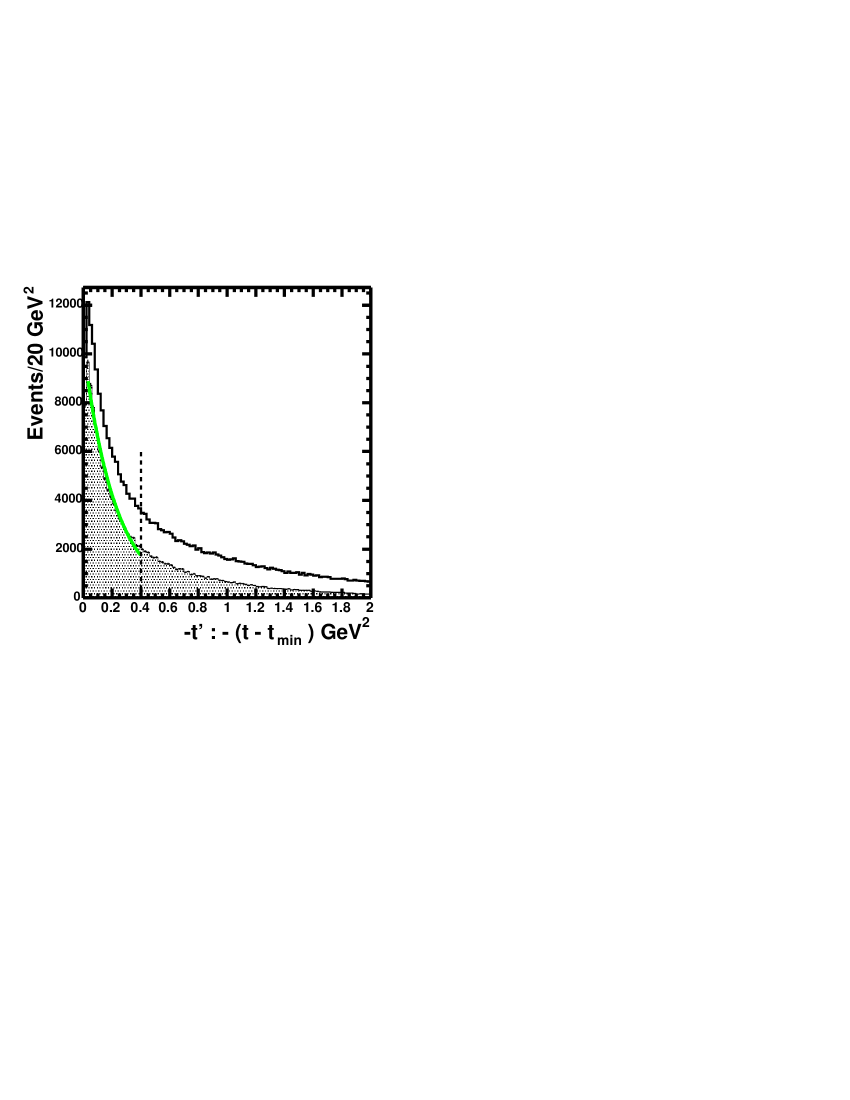
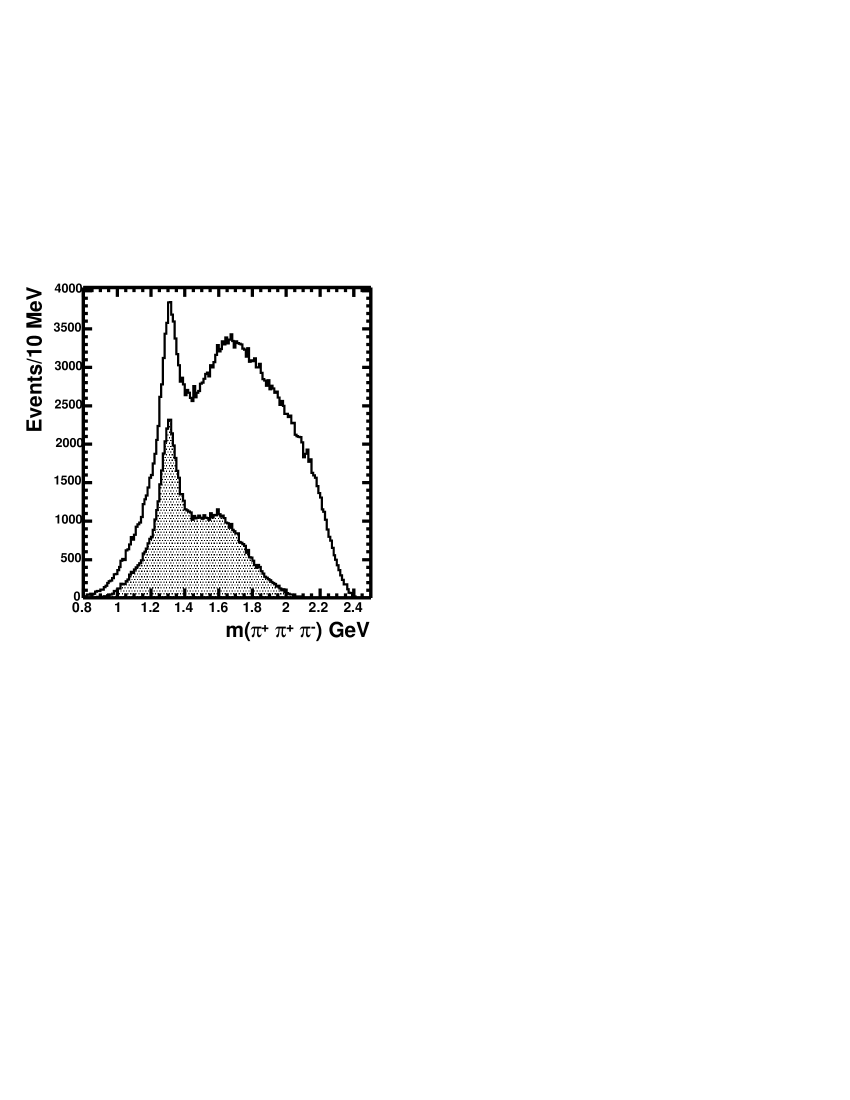
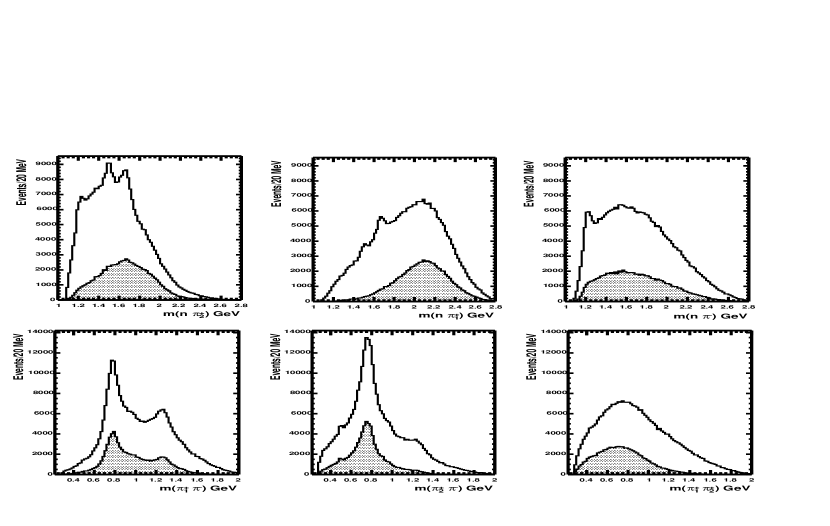
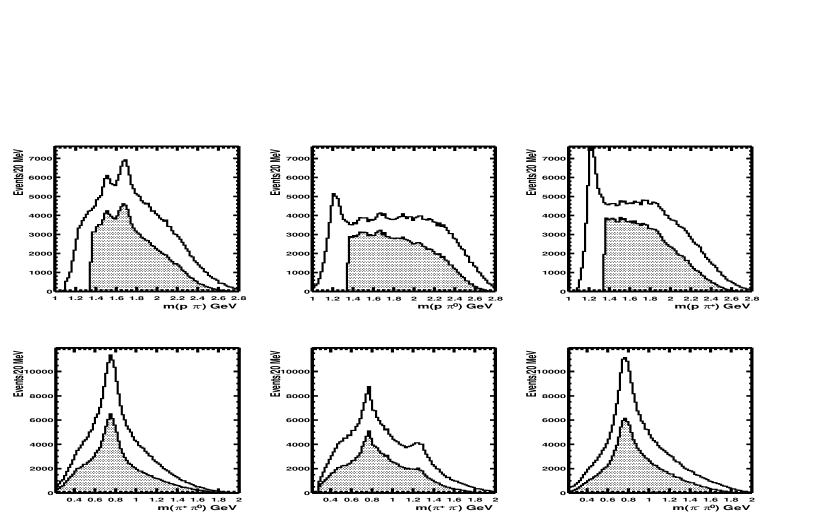
Figure 2 shows all three possible combinations of the and invariant mass distributions. In this analysis, the two positively charged pions were sorted based on momentum, with the being the one with higher momentum. The two combinations show peaks around the known baryon resonances, , , and , while the shows a peak around the only as is expected due to isospin considerations. It is clear from the shaded distributions that the baryon resonance peaks are greatly suppressed after the “baryon rejection” cuts. The neutral effective mass distributions show signals around the mass of the and the , as well as a shoulder at the mass of the . The doubly-charged combination doesn’t show any distinct peak, indicative of the lack of an isospin state.
4 Data Distributions:
The , , and were detected in CLAS while the was reconstructed by way of missing mass. In order to enhance the mesonic events, a combination of low and mass cut was employed. The cut was defined as GeV2, with the effective masses for all three combination above GeV. We’ll refer to these two cuts, as “baryon rejection cuts”. In all the plots shown for this final state, the shaded histograms represent the events that passed these two cuts.
The left plot in Fig. 3 shows the missing mass squared off the . A Gaussian plus a order polynomial fit to the peak around the gives a of MeV for the missing mass resolution. The region between the lines represents the selection cut; these events were subjected to kinematical fitting in a later stage. The distribution is shown in the middle plot of Fig. 3. The shaded distribution, after the rejection cut is fit to an exponential function, , with the resulting . The invariant mass distribution is shown in the right plot of Fig. 3, with the shaded histogram showing the events which passed the “baryon rejection cuts”. In the remaining events, one is able to see enhancement of events at MeV and in the MeV region.
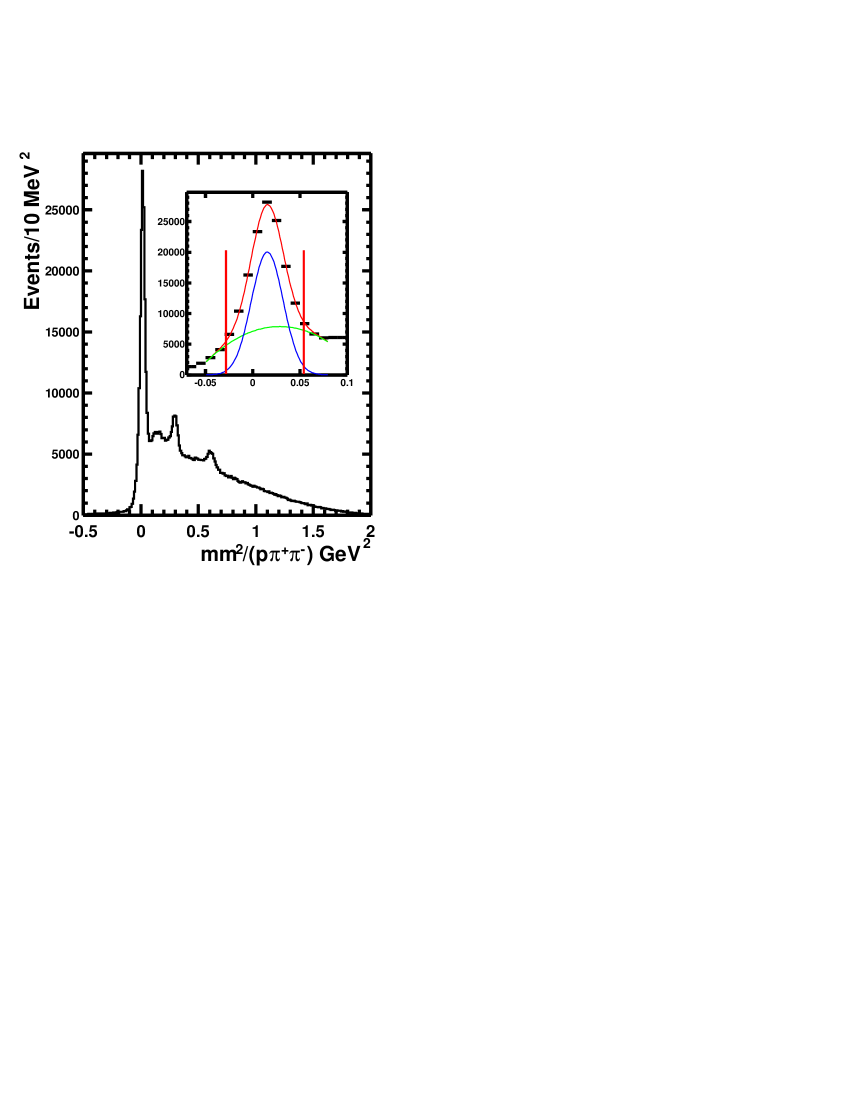
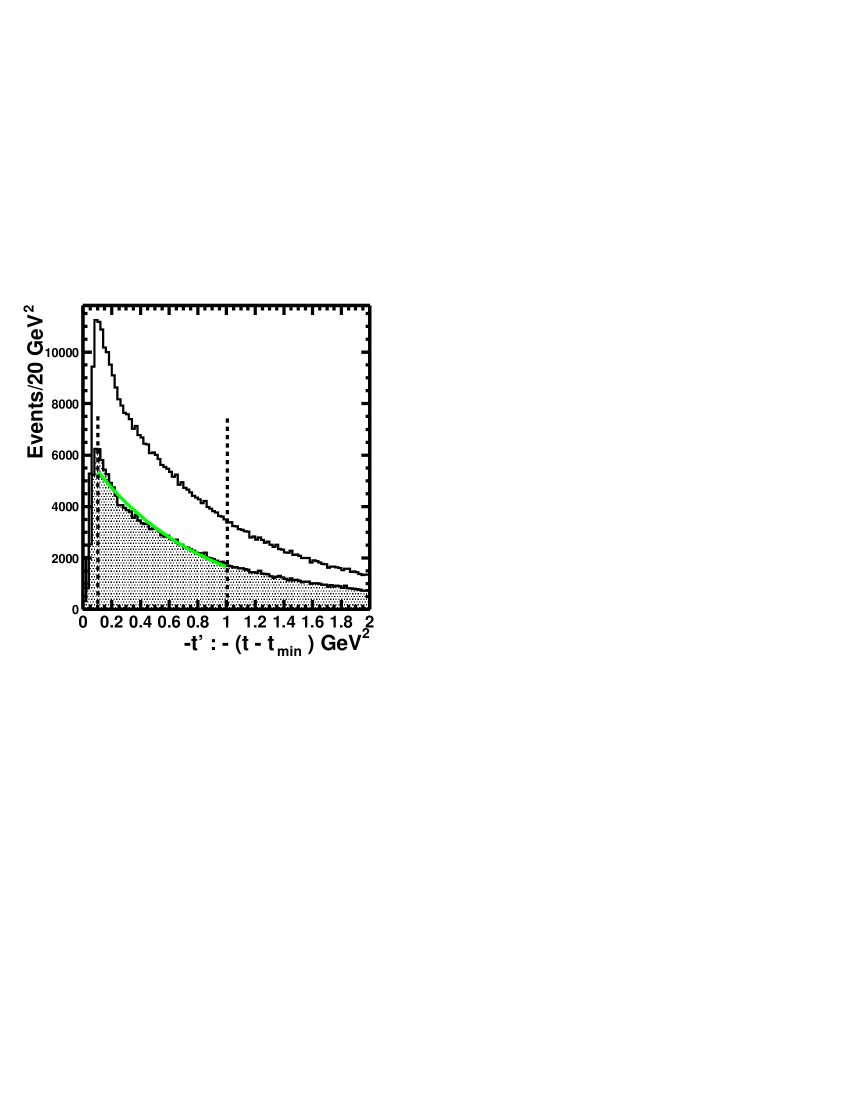
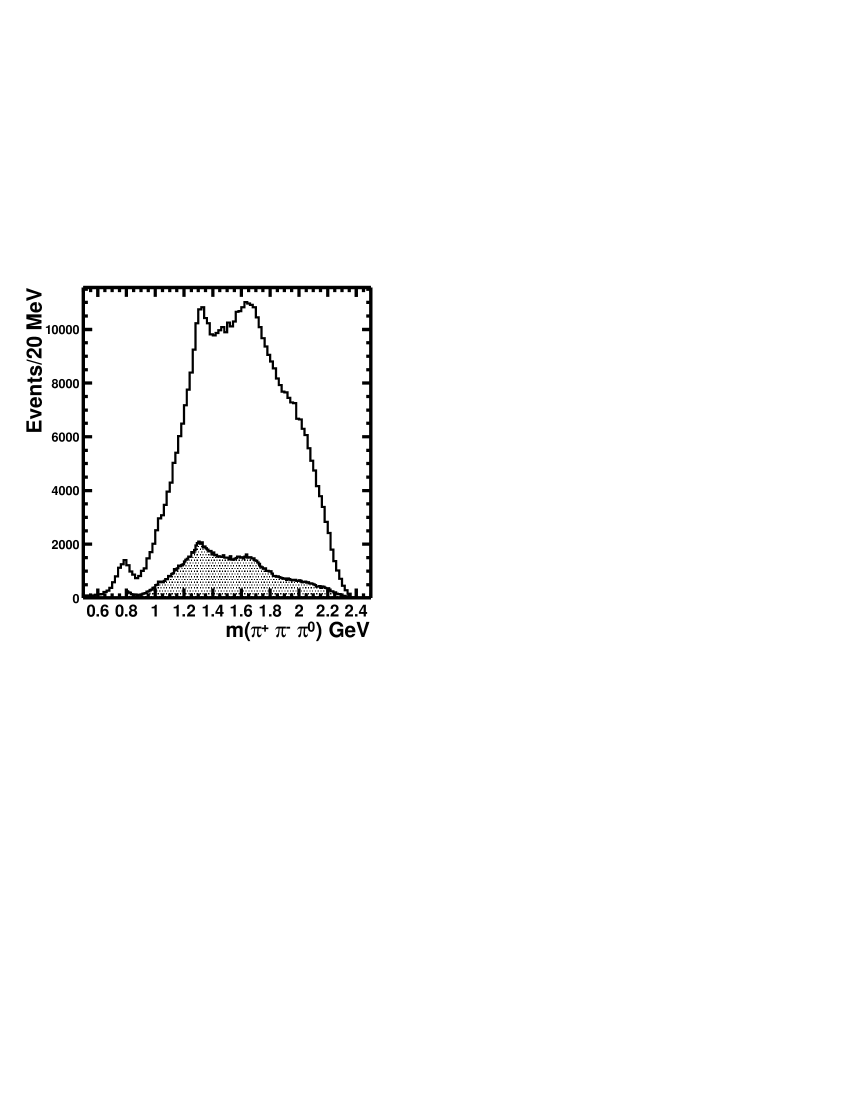
Figure 4 shows all three possible combinations of the and invariant mass distributions. Before the “baryon rejection cuts”, the most prominent feature observed is the peak around the mass region. After the cuts, the peaks around the and still remain. The invariant mass distributions for the charged combinations, and , show strong peaks at the mass, while the neutral invariant mass distribution shows enhancements around the and masses.
5 Summary and Outlook
We have shown the data quality and the general characteristics of the distributions for both the neutral and the charged final states from the data collected during the g6c running of CLAS. The statistics for both sets of events is by a factor of few hundred higher than the existing data. Partial Wave Analysis on both systems are underway.
References
- S. U. Chung et al. (2002) S. U. Chung et al., Physical Review D, 65, 1–16 (2002).
- A. V. Afanasev and A. P. Szczepaniak (2000) A. V. Afanasev and A. P. Szczepaniak, Physical Review D, 61 (2000).
- A. V. Afanasev and P. R. Page (1998) A. V. Afanasev and P. R. Page, Physical Review D, 57 (1998).
- F. E. Close and P. R. Page (1995) F. E. Close and P. R. Page, Physical Review D, 52 (1995).
- G. T. Condo et al. (1991) G. T. Condo et al., Physical Review D, 43 (1991).
- D. I. Sober et al. (2000) D. I. Sober et al., Nuclear Instruments and Methods in Physics Research A, 440, 263 (2000).
- B. A. Mecking et al. (2003) B. A. Mecking et al., Nuclear Instruments and Methods in Physics Research A, 503, 513–553 (2003).
- M. Guidal, J. M. Laget, M. Vanderhaeghen (1997) M. Guidal, J. M. Laget, M. Vanderhaeghen, Nuclear Physics A, 627, 645–678 (1997).