Measurement of the Branching Fraction for B Decays
K. Abe
High Energy Accelerator Research Organization (KEK), Tsukuba
K. Abe
Tohoku Gakuin University, Tagajo
R. Abe
Niigata University, Niigata
T. Abe
Tohoku University, Sendai
I. Adachi
High Energy Accelerator Research Organization (KEK), Tsukuba
Byoung Sup Ahn
Korea University, Seoul
H. Aihara
University of Tokyo, Tokyo
M. Akatsu
Nagoya University, Nagoya
Y. Asano
University of Tsukuba, Tsukuba
T. Aso
Toyama National College of Maritime Technology, Toyama
V. Aulchenko
Budker Institute of Nuclear Physics, Novosibirsk
T. Aushev
Institute for Theoretical and Experimental Physics, Moscow
A. M. Bakich
University of Sydney, Sydney NSW
Y. Ban
Peking University, Beijing
E. Banas
H. Niewodniczanski Institute of Nuclear Physics, Krakow
A. Bay
Institut de Physique des Hautes Énergies, Université de Lausanne, Lausanne
P. K. Behera
Utkal University, Bhubaneswer
A. Bondar
Budker Institute of Nuclear Physics, Novosibirsk
A. Bozek
H. Niewodniczanski Institute of Nuclear Physics, Krakow
M. Bračko
University of Maribor, Maribor
J. Stefan Institute, Ljubljana
J. Brodzicka
H. Niewodniczanski Institute of Nuclear Physics, Krakow
B. C. K. Casey
University of Hawaii, Honolulu HI
P. Chang
National Taiwan University, Taipei
Y. Chao
National Taiwan University, Taipei
B. G. Cheon
Sungkyunkwan University, Suwon
R. Chistov
Institute for Theoretical and Experimental Physics, Moscow
S.-K. Choi
Gyeongsang National University, Chinju
Y. Choi
Sungkyunkwan University, Suwon
M. Danilov
Institute for Theoretical and Experimental Physics, Moscow
L. Y. Dong
Institute of High Energy Physics, Chinese Academy of Sciences, Beijing
A. Drutskoy
Institute for Theoretical and Experimental Physics, Moscow
S. Eidelman
Budker Institute of Nuclear Physics, Novosibirsk
V. Eiges
Institute for Theoretical and Experimental Physics, Moscow
Y. Enari
Nagoya University, Nagoya
C. Fukunaga
Tokyo Metropolitan University, Tokyo
N. Gabyshev
High Energy Accelerator Research Organization (KEK), Tsukuba
A. Garmash
Budker Institute of Nuclear Physics, Novosibirsk
High Energy Accelerator Research Organization (KEK), Tsukuba
T. Gershon
High Energy Accelerator Research Organization (KEK), Tsukuba
R. Guo
National Kaohsiung Normal University, Kaohsiung
F. Handa
Tohoku University, Sendai
T. Hara
Osaka University, Osaka
Y. Harada
Niigata University, Niigata
H. Hayashii
Nara Women’s University, Nara
M. Hazumi
High Energy Accelerator Research Organization (KEK), Tsukuba
E. M. Heenan
University of Melbourne, Victoria
I. Higuchi
Tohoku University, Sendai
T. Hojo
Osaka University, Osaka
T. Hokuue
Nagoya University, Nagoya
Y. Hoshi
Tohoku Gakuin University, Tagajo
K. Hoshina
Tokyo University of Agriculture and Technology, Tokyo
S. R. Hou
National Taiwan University, Taipei
W.-S. Hou
National Taiwan University, Taipei
H.-C. Huang
National Taiwan University, Taipei
T. Igaki
Nagoya University, Nagoya
Y. Igarashi
High Energy Accelerator Research Organization (KEK), Tsukuba
K. Inami
Nagoya University, Nagoya
A. Ishikawa
Nagoya University, Nagoya
R. Itoh
High Energy Accelerator Research Organization (KEK), Tsukuba
M. Iwamoto
Chiba University, Chiba
H. Iwasaki
High Energy Accelerator Research Organization (KEK), Tsukuba
Y. Iwasaki
High Energy Accelerator Research Organization (KEK), Tsukuba
H. K. Jang
Seoul National University, Seoul
J. Kaneko
Tokyo Institute of Technology, Tokyo
J. H. Kang
Yonsei University, Seoul
J. S. Kang
Korea University, Seoul
P. Kapusta
H. Niewodniczanski Institute of Nuclear Physics, Krakow
S. U. Kataoka
Nara Women’s University, Nara
N. Katayama
High Energy Accelerator Research Organization (KEK), Tsukuba
H. Kawai
Chiba University, Chiba
Y. Kawakami
Nagoya University, Nagoya
N. Kawamura
Aomori University, Aomori
T. Kawasaki
Niigata University, Niigata
H. Kichimi
High Energy Accelerator Research Organization (KEK), Tsukuba
D. W. Kim
Sungkyunkwan University, Suwon
Heejong Kim
Yonsei University, Seoul
H. J. Kim
Yonsei University, Seoul
H. O. Kim
Sungkyunkwan University, Suwon
Hyunwoo Kim
Korea University, Seoul
S. K. Kim
Seoul National University, Seoul
T. H. Kim
Yonsei University, Seoul
P. Krokovny
Budker Institute of Nuclear Physics, Novosibirsk
R. Kulasiri
University of Cincinnati, Cincinnati OH
S. Kumar
Panjab University, Chandigarh
A. Kuzmin
Budker Institute of Nuclear Physics, Novosibirsk
Y.-J. Kwon
Yonsei University, Seoul
G. Leder
Institute of High Energy Physics, Vienna
S. H. Lee
Seoul National University, Seoul
J. Li
University of Science and Technology of China, Hefei
D. Liventsev
Institute for Theoretical and Experimental Physics, Moscow
R.-S. Lu
National Taiwan University, Taipei
J. MacNaughton
Institute of High Energy Physics, Vienna
G. Majumder
Tata Institute of Fundamental Research, Bombay
F. Mandl
Institute of High Energy Physics, Vienna
S. Matsumoto
Chuo University, Tokyo
T. Matsumoto
Tokyo Metropolitan University, Tokyo
K. Miyabayashi
Nara Women’s University, Nara
H. Miyake
Osaka University, Osaka
H. Miyata
Niigata University, Niigata
G. R. Moloney
University of Melbourne, Victoria
T. Mori
Chuo University, Tokyo
T. Nagamine
Tohoku University, Sendai
Y. Nagasaka
Hiroshima Institute of Technology, Hiroshima
E. Nakano
Osaka City University, Osaka
M. Nakao
High Energy Accelerator Research Organization (KEK), Tsukuba
J. W. Nam
Sungkyunkwan University, Suwon
Z. Natkaniec
H. Niewodniczanski Institute of Nuclear Physics, Krakow
K. Neichi
Tohoku Gakuin University, Tagajo
S. Nishida
Kyoto University, Kyoto
O. Nitoh
Tokyo University of Agriculture and Technology, Tokyo
S. Noguchi
Nara Women’s University, Nara
T. Nozaki
High Energy Accelerator Research Organization (KEK), Tsukuba
S. Ogawa
Toho University, Funabashi
F. Ohno
Tokyo Institute of Technology, Tokyo
T. Ohshima
Nagoya University, Nagoya
T. Okabe
Nagoya University, Nagoya
S. Okuno
Kanagawa University, Yokohama
S. L. Olsen
University of Hawaii, Honolulu HI
Y. Onuki
Niigata University, Niigata
W. Ostrowicz
H. Niewodniczanski Institute of Nuclear Physics, Krakow
H. Ozaki
High Energy Accelerator Research Organization (KEK), Tsukuba
P. Pakhlov
Institute for Theoretical and Experimental Physics, Moscow
H. Palka
H. Niewodniczanski Institute of Nuclear Physics, Krakow
C. W. Park
Korea University, Seoul
H. Park
Kyungpook National University, Taegu
K. S. Park
Sungkyunkwan University, Suwon
L. S. Peak
University of Sydney, Sydney NSW
J.-P. Perroud
Institut de Physique des Hautes Énergies, Université de Lausanne, Lausanne
M. Peters
University of Hawaii, Honolulu HI
L. E. Piilonen
Virginia Polytechnic Institute and State University, Blacksburg VA
N. Root
Budker Institute of Nuclear Physics, Novosibirsk
K. Rybicki
H. Niewodniczanski Institute of Nuclear Physics, Krakow
H. Sagawa
High Energy Accelerator Research Organization (KEK), Tsukuba
S. Saitoh
High Energy Accelerator Research Organization (KEK), Tsukuba
Y. Sakai
High Energy Accelerator Research Organization (KEK), Tsukuba
M. Satapathy
Utkal University, Bhubaneswer
O. Schneider
Institut de Physique des Hautes Énergies, Université de Lausanne, Lausanne
S. Schrenk
University of Cincinnati, Cincinnati OH
C. Schwanda
High Energy Accelerator Research Organization (KEK), Tsukuba
Institute of High Energy Physics, Vienna
S. Semenov
Institute for Theoretical and Experimental Physics, Moscow
K. Senyo
Nagoya University, Nagoya
R. Seuster
University of Hawaii, Honolulu HI
M. E. Sevior
University of Melbourne, Victoria
H. Shibuya
Toho University, Funabashi
B. Shwartz
Budker Institute of Nuclear Physics, Novosibirsk
V. Sidorov
Budker Institute of Nuclear Physics, Novosibirsk
J. B. Singh
Panjab University, Chandigarh
S. Stanič
on leave from Nova Gorica Polytechnic, Slovenia
University of Tsukuba, Tsukuba
M. Starič
J. Stefan Institute, Ljubljana
A. Sugiyama
Nagoya University, Nagoya
K. Sumisawa
High Energy Accelerator Research Organization (KEK), Tsukuba
T. Sumiyoshi
Tokyo Metropolitan University, Tokyo
S. Suzuki
Yokkaichi University, Yokkaichi
S. K. Swain
University of Hawaii, Honolulu HI
T. Takahashi
Osaka City University, Osaka
F. Takasaki
High Energy Accelerator Research Organization (KEK), Tsukuba
K. Tamai
High Energy Accelerator Research Organization (KEK), Tsukuba
N. Tamura
Niigata University, Niigata
M. Tanaka
High Energy Accelerator Research Organization (KEK), Tsukuba
G. N. Taylor
University of Melbourne, Victoria
Y. Teramoto
Osaka City University, Osaka
S. Tokuda
Nagoya University, Nagoya
T. Tomura
University of Tokyo, Tokyo
S. N. Tovey
University of Melbourne, Victoria
W. Trischuk
on leave from University of Toronto, Toronto ON
Princeton University, Princeton NJ
T. Tsuboyama
High Energy Accelerator Research Organization (KEK), Tsukuba
T. Tsukamoto
High Energy Accelerator Research Organization (KEK), Tsukuba
S. Uehara
High Energy Accelerator Research Organization (KEK), Tsukuba
K. Ueno
National Taiwan University, Taipei
S. Uno
High Energy Accelerator Research Organization (KEK), Tsukuba
S. E. Vahsen
Princeton University, Princeton NJ
G. Varner
University of Hawaii, Honolulu HI
K. E. Varvell
University of Sydney, Sydney NSW
C. C. Wang
National Taiwan University, Taipei
C. H. Wang
National Lien-Ho Institute of Technology, Miao Li
J. G. Wang
Virginia Polytechnic Institute and State University, Blacksburg VA
M.-Z. Wang
National Taiwan University, Taipei
Y. Watanabe
Tokyo Institute of Technology, Tokyo
E. Won
Korea University, Seoul
B. D. Yabsley
Virginia Polytechnic Institute and State University, Blacksburg VA
Y. Yamada
High Energy Accelerator Research Organization (KEK), Tsukuba
A. Yamaguchi
Tohoku University, Sendai
Y. Yamashita
Nihon Dental College, Niigata
M. Yamauchi
High Energy Accelerator Research Organization (KEK), Tsukuba
H. Yanai
Niigata University, Niigata
J. Yashima
High Energy Accelerator Research Organization (KEK), Tsukuba
Y. Yuan
Institute of High Energy Physics, Chinese Academy of Sciences, Beijing
Y. Yusa
Tohoku University, Sendai
J. Zhang
University of Tsukuba, Tsukuba
Z. P. Zhang
University of Science and Technology of China, Hefei
V. Zhilich
Budker Institute of Nuclear Physics, Novosibirsk
D. Žontar
University of Tsukuba, Tsukuba
Abstract
We have measured the branching fractions of the colour suppressed decays
and using a data sample of 84 million events
recorded by the Belle detector on the resonance. The branching
fractions for the charged and neutral mode decays are
and ,
respectively.
The decays are colour-suppressed two-body
decays with two vector mesons in the final state. Measurements of such
processes can provide insight into the interplay between the weak and strong
interactions.
We study eight different decay channels, which are combinations of
two decay modes for the :
and ;
and four different final states: ,
, , and
(charged conjugate processes are implied throughout
this paper).
The branching fractions for have been
measured previously by the CLEObfcleo and CDFbfcdf experiments.
Our much larger data sample permits us to make more precise determinations
of these quantities.
II Data Sample and Event Selection
This measurement uses a data sample of approximately 84 million events,
corresponding to an integrated luminosity of 78 fb-1, collected at the
(4S) resonance by the Belle detectorbldnim at KEKBkekb .
KEKB is an energy-asymmetric double storage ring that collides 8 GeV electrons with
3.5 GeV positrons.
The Belle detector is a general-purpose large-solid-angle spectrometer with
a 1.5-T solenoidal magnet. It is designed to study the properties of
mesons, charmed hadrons, and leptons, and also to study two-photon interactions.
Charged particles are detected by a silicon vertex detector (SVD) that
surrounds the interaction point, and then tracked by a cylindrical
wire drift chamber (CDC). The CDC provides a three-dimensional momentum
measurement of each track. Charged particles are identified via information
from silica aerogel Cherenkov counters (ACC), a time-of-flight
scintillator barrel (TOF), and specific ionization () measurements
in the CDC. Electromagnetic showers are detected in an array of CsI(T)
crystals (ECL) that is located just inside the solenoidal coil. Muons and
mesons are identified by glass-electrode resistive-plate counters (KLM)
embedded in the solenoid’s magnetic flux return.
Hadronic events are selected from the raw data sample by requiring at least
three good charged tracks emerging from near the interaction point,
within a cylindrical region of cm
and cm, aligned along the positron beam axis, and at least
one cluster of 0.1 GeV or more within the ECL barrel. In the center-of-mass
(CM) frame, the component of the total momentum along the beam axis of all
charged tracks and neutral ECL clusters must be below , where
GeV is the total available energy. In the laboratory
frame, the visible energy (the sum of the charged track momenta and the
neutral cluster energies) must exceed and the neutral-only part
must be between and . Continuum (non-resonant
) events are suppressed relative to
by requiring that the ratio of
the second to the zeroth Fox-Wolfram momentsfoxh2 falls below 0.5.
Candidate charmonium mesons are reconstructed through the decays
, ,
and , where represents either an electron or a muon.
Electrons are identified by a maximum-likelihood technique that uses energy and
momentum information from the ECL and CDC, respectively. If there is a neutral ECL cluster
within rad of the electron/positron direction, it is assumed to
arise from bremsstrahlung, and its energy is added to that of the lepton.
Both tracks are required to originate from a common vertex by requiring that
their distance of closest approach, measured along the beam axis, satisfies
cm. Candidate and mesons are
retained if the mass difference between the reconstructed invariant
mass and the nominal or mass falls in the range
GeV/ or
GeV/.
(The windows are wider on the low side of the charmonium mass peak to
allow for residual bremsstrahlung.)
Muons are identified by a maximum likelihood technique that uses the
momentum information from the CDC in combination with the range and
transverse scattering information from the KLM.
As for electrons, muon pairs must satisfy the
common-vertex requirement of .
Candidate and mesons are retained if the reconstructed
mass satisfies
GeV/ or
GeV/.
The invariant-mass spectrum of the candidate inclusive sample is plotted in
Fig. 1.
Figure 1: Invariant mass spectra of candidates. The
left plot shows while right
plot shows .
Additional candidates are reconstructed through their decay
to . The meson is reconstructed via its decay
to dileptons, as described above. Here, the momenta of the leptons and the
parent candidate are redetermined in a mass-constrained fit
assuming the nominal meson mass. Pions are selected from charged
tracks after electron and muon rejection. To reduce combinatorial
background, the invariant mass must exceed 0.4 GeV/,
and the CM momentum of the candidate must fall below
1.7 GeV/. The three-dimensional distance between the reconstructed
vertices of the lepton pair and the pion pair must be less than
. We retain a candidate meson if its mass
exceeds the reconstructed mass by .
The spectrum of the mass difference between the
candidate and the daughter is shown in Fig. 1.
We reconstruct candidates from their decays to or
, and candidates from their decays to or
. Charged tracks are identified as kaons if they satisfy the
kaon selection criterion derived from a maximum likelihood technique that
distinguishes them from pions using information from the CDC, ACC, and the TOF;
otherwise, they are classified as pions. Neutral pions are reconstructed from pairs of
photons (i.e., neutral ECL clusters) whose individual energies exceeds
and whose invariant mass is in the window GeV/.
(The photon and pion momenta of the surviving candidates are also recalculated
assuming the nominal mass of the meson.)
mesons are reconstructed from two oppositely charged pions whose
distance of closest approach to the interaction point exceeds
in the plane perpendicular to the beam axis.
If the two tracks have SVD hits, they must originate from a common vertex
that is within the SVD but detached from the interaction point.
Otherwise, the azimuthal coordinate of the common vertex must agree with
the azimuthal direction of the pion pair within . The
invariant mass of the pion pair must be in the range
.
When combining a neutral pion with either a charged or neutral kaon to form a
candidate, we require the helicity angle
(the angle of the kaon with respect to the direction in the
rest frame) to satisfy . This requirement provides rejection of the
slow-pion background. The invariant mass of the or
combinations and the or combinations must agree with the nominal
meson mass within and ,
respectively. For the mode, the momenta of
the kaon and pion are recalculated in a vertex-constrained fit.
III Measurement of Branching Fractions
Candidate mesons are reconstructed by combining candidates
with candidates. For each candidate, we calculate the
momentum and energy in the CM frame, and from these the beam-constrained
mass and the energy difference
. ( is the
beam energy in the CM frame.)
If there are multiple candidates in an event, the best one is chosen
by first discarding all but the best-reconstructed candidate,
and then selecting the candidate with the smallest . This quantity
is defined by , where
is the central value of the measured parameter —i.e., the mass of
the reconstructed or —and the corresponding
uncertainty. The candidate selected in this way is retained only if it
lies within a specified region of the – plane:
GeV and GeV/.
A signal box, GeV (0.04 GeV for modes)
and GeV/, was determined using a large sample of
Monte Carlo signal events. We have verified that the and
resolutions agree well between data and simulation. In the cases where the
final state contains only charged tracks ( and
), the track momenta are recalculated assuming
a common vertex constraint; this improves the resolutions in and
for signal candidates while having no effect on the background distribution.
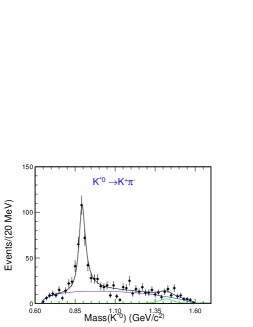
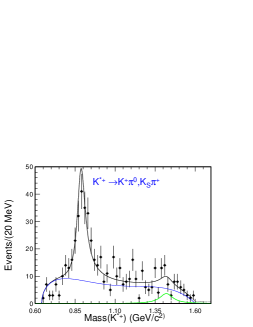
Using the and signal box cut to restrict the sample of
meson candidates, we obtain mass distributions for and
candidates. These distributions are fitted to Breit-Wigner -wave functions
for signal and second-order polynomial functions for background. The mass
spectra of the exclusive candidates are shown in Fig. 2.
Figure 2: Invariant mass of the (a) candidates reconstructed
from and pairs, (b) candidates
reconstructed from and pairs.
backgrounds are classified as coming from
the continuum, combinatorics, feed across, and
non-resonant decay. The relative importance of each background
category varies with the signal mode under consideration.
Backgrounds of each type were studied for each mode using a combination
of Monte Carlo samples and data sidebands, as described below.
We simulate the continuum background using the proportion
for quarks. A Monte Carlo sample with a size corresponding
to twice the data sample was generated and subjected to the selection criteria
outlined above. Since no events survive our cuts, we conclude that the continuum
contribution is negligible.
Combinatorial backgrounds are analyzed by using the sidebands of
the experimental data. (A MC study was also considered, but owing
to complications arising from non-resonant
backgrounds and contributions from higher resonances, it was
not adopted.) We take the areas in the - plane given by
and GeV
and GeV for our sideband analysis. We exclude
the GeV region from this study to avoid possible
non-combinatorial contributions from and decays.
Background from feed across is studied by using exclusive
signal MC data generated using the program EvtGen EvtGen .
The generated particles are tracked through the detector using
the program GEANT GEANT . Eight 20,000-event samples,
corresponding to the eight
modes studied, are used. For each decay mode studied, feed across
backgrounds from the remaining seven modes are summed. The total
amount of feed across relative to signal yields is 8.1-12.9%,
depending on the mode.
Finally, backgrounds from non-resonant modes
are studied by using a sideband in the mass spectrum with
masses in the range
GeV/. We obtain an estimated background
contribution from non-resonant modes of about
6.8% for and 4.7% for .
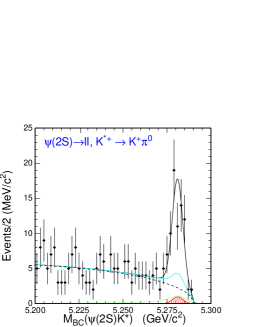
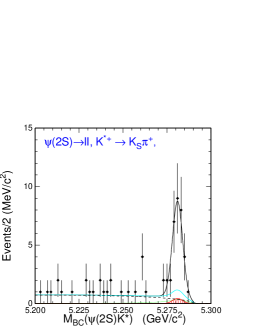
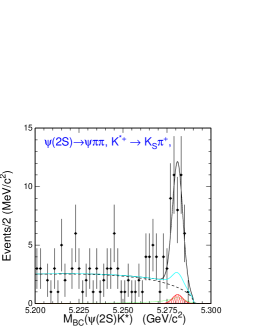
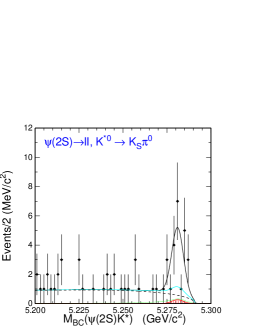
Figure 3:
Beam-constrained mass plots and fits for
. The left-hand plots are for
and the right-hand plots are for . The top plots
show and the bottom plots show
. The dashed lines show the
combinatorial contribution to the background. The dotted lines (green) show the
feed across background and the solid lines with hatched areas (red) show the contributions from non-resonant decay. The gray lines give total background.
Measurements of the branching fractions are based on fits to the
beam-constrained mass () distributions. Separate fits are
performed for each of the eight submodes under study. These distributions
comprise signal and background events as discussed in the previous sections.
In the fits, the signal is described by a Gaussian whose mean and width
are determined from MC. The combinatorial background is described using
an ARGUS function ARGUS whose shape parameters are fixed using sideband data.
The feed across background is modeled by a Crystal Ball function CB
where both the shape and the level are fixed by MC. The level of the feed across
background depends on the branching fractions
being measured, so an iterative procedure is adopted wherein the branching
ratios obtained using initial estimates for the feed across modes are
used to carry out a second analysis. Since the feed across backgrounds are
a small fraction of the signal, this procedure quickly converges.
The non-resonant
background is described by a Gaussian of fixed shape and amplitude.
The level of the combinatorial background is allowed to vary.
Figs. 3 and 4
show the fit results for and decays, respectively.
Fitting results from the distributions are checked by carrying out
a second set of fits to the distributions. This method yielded
consistent results, with yield differences varying from 1 to 3%.
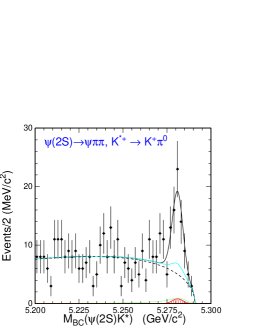
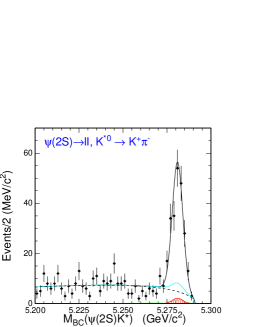
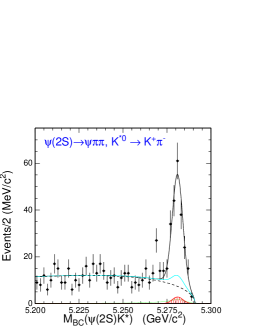
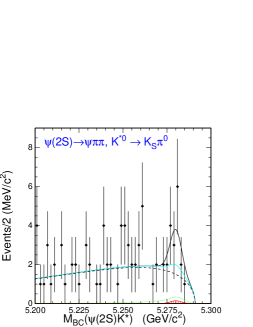
Figure 4:
Beam-constrained mass plots and fits for
. The left-hand plots are for
and the right-hand plots are for . The top plots
show and the bottom plots show
. The dashed lines show the
combinatorial contribution to the background. The dotted lines (green) show the
feed across background and the solid lines with hatched areas (red) show the contributions from non-resonant decay. The gray lines give total background.
The reconstruction efficiency for each decay mode is obtained using signal MC
data with the same cut criteria. Table 1 shows the number of signal events,
the reconstruction efficiency and the total number of background events for
each decay mode. World average values PDG are used for the branching fractions for
, ,
, and decays.
Decay channel
(%)
15.85
33.2
5.25
57.1
15.5
9.8
6.42
18.2
29.5
62.6
12.1
91.6
10.3
7.3
4.01
13.4
Table 1: Number of signal events, reconstruction efficiency, number of
background events and measured branching fractions for each decay mode.
Systematic errors arise from uncertainties in detector efficiency, particle
identification efficiency, reconstruction efficiency, and beam-constrained mass
fitting. We estimate these as follows: tracking efficiency (1.0% per track);
particle identification efficiency (3.0% for leptons and less than 1% for kaons
and pions); background contribution (5.0 - 7.0% decay mode dependent); neutral
pion reconstruction (4.0%); number of events (1.0%);
branching fraction for secondary decay (1.7%); and the effect of polarization (1.7%).
The uncertainty in the background, which is the dominant contribution
to the overall systematic error,
is due to uncertainties surrounding the contributions of higher-mass
resonances to the GeV/ mass region used to
estimate the non-resonant contributions to the mass region under
the peak.
The measured branching fractions are summarized in Table 1.
Table 2 shows the branching ratios that result from the weighted average of the
four final states for the charged and neutral mode decays. Table 2
also shows previous measurements by CLEO bfcleo for comparison.
Decay channel
Belle (
CLEO (
Table 2: The results of measured branching fractions after taking weighted average for different decay channels.
IV conclusion
The branching fraction for has been measured using a sample
of 84 million pairs. The results are consistent with earlier measurements from CLEO bfcleo
and CDF bfcdf , but offer improved statistical accuracy.