Workshop on the CKM Unitarity Triangle, IPPP Durham, April 2003
: Status and Prospects
Abstract
An overview of the observation of violation in the neutral system, and the measurements of the -violating asymmetry with charmonium events, performed by the BABAR and Belle experiments at the SLAC and KEK factories is given. In addition, the measurements of with several other modes are described, including , which, as the leading contribution is from a loop diagram, could be sensitive to physics beyond the Standard Model.
1 Introduction
violation has been a central concern of particle physics since its discovery in 1964 in the decays of decays [1]. An elegant explanation of the -violating effects in these decays is provided by the -violating phase of the three-generation Cabibbo-Kobayashi-Maskawa (CKM) quark-mixing matrix [2]. However, existing studies of violation in neutral kaon decays and the resulting experimental constraints on the parameters of the CKM matrix [3] do not provide a stringent test of whether the CKM phase describes violation [4]. In the CKM picture, large -violating asymmetries are expected to occur in the time distributions of decays to charmonium final states.
In general, -violating asymmetries are due to the interference between amplitudes with a weak phase difference. For example, a state initially produced as a () can decay to a eigenstate, such as , either directly, or it can first oscillate into a () and then decay to . With little theoretical uncertainty in the Standard Model, the phase difference between these two amplitudes is equal to twice the angle of the Unitarity Triangle [5]. The measurement of the -violating asymmetry in this decay allows a direct determination of , and can thus provide a crucial test of the Standard Model.
Initial measurements of the asymmetry in were performed at LEP by Aleph and Opal, and at the Tevatron by CDF [6], but the small branching ratio of this decay made it difficult for the the experiments to obtain sufficient events for a statistically significant measurement. The KEK and SLAC based factories, running at the resonance, were designed to provide the required high luminosity to perform this measurement. Although the measurements from the BABAR and Belle experiments, at SLAC respectively KEK, after the first year of running, shown in summer of 2000, were not yet conclusive, only a year later both experiments were able to claim the observation of violation in the meson system. And in 2002 the direct measurements [7] of surpassed the precision of the indirect determination of obtained from -conserving variables, assuming the validity of the CKM description [8]. The consistency of these measurements with their prediction [9] implies that the CKM description of the violation in the quark sector has successfully passed its first quantitative test.
2 Measurement of at -factory experiments
A pair produced in decays evolves as a coherent -wave until one of the mesons decays. If one of the mesons, referred to as , can be ascertained to decay to a state of known flavour, i.e. or , at a certain time , the other , referred to as , at that time must be of the opposite flavour as a consequence of Bose symmetry. Consequently, the oscillatory probabilities for observing , and pairs produced in decays are a function of , allowing the mixing frequency and asymmetries to be determined if is known.
The proper-time distribution of meson decays to a eigenstate with a or tag can be expressed in terms of a complex parameter that depends on the both the oscillation amplitude and the amplitudes describing and decays to this final state. The decay rate when the tagging meson is a () is given by
where is the difference in proper decay times of the reconstructed meson () and the tagging meson (), is the lifetime, and is the oscillation frequency. The sine coefficient, which is given by is due to the interference between direct decay and decay after flavour change, and the cosine coefficient, is due to the interference between decay amplitudes with different strong and weak phases. In the Standard Model, for charmonium-containing decays, where is the eigenvalue of the final state .
At asymmetric colliders such as PEP-II at SLAC and KEK-B at KEK [10], resonant production of the provides a copious source of pairs moving along the beam axis ( direction) with an average Lorentz boost of 0.56 and 0.43 respectively. Therefore, the proper decay-time difference is, to an excellent approximation, proportional to the distance between the two -decay vertices along the axis of the boost, .
The analysis of the data proceeds in the following steps:
-
1.
selection of events where one , referred to as is fully reconstructed;
-
2.
determination of the vertex of the other decay, , and computation of ;
-
3.
determination of the flavour of from its charged decay products.
Both experiments determine their resolution and the mistag rate of the flavour tagging algorithms from control samples, obtained from the data itself.
2.1 Data samples and reconstruction
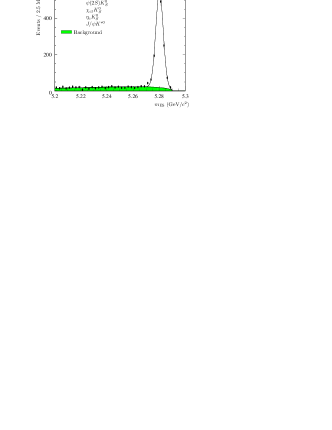
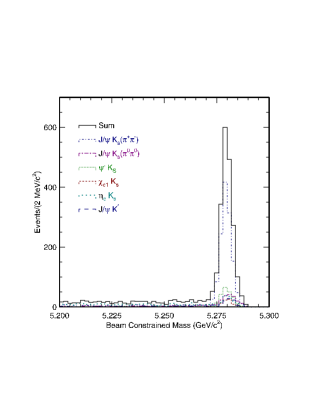
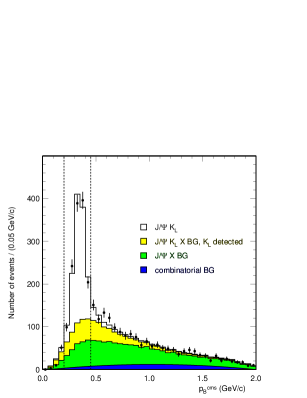
Both experiments have sofar published their measurements on samples obtained as of July 2002. In the case of BABAR, this implies a sample of decays, whereas Belle collected a sample of decays. As the branching ratios of decays of mesons to eigenstates are small, e.g. a few times for , both experiments increase the size of the event sample by reconstructing several final states: and . In addition, to determine the performance of the reconstruction and the flavour tagging, control samples of fully reconstructed decays of mesons to self-tagging flavour eigenstates are selected111Throughout this paper, charge-conjugate modes are implied.: and . In addition, semileptonic decays into are selected. The main selection criteria of the fully reconstructed decays are the energy difference, , between the energy of the reconstructed candidate and the beam-energy in the center-of-mass system, and the beam-energy substituted mass, , also known as the beam-constrained mass, defined as , where is the square of the center-of-mass energy and is the momentum of the candidate in the center-of-mass. In the case of signal events, these variables are distributed according to Gaussian distributions, centered at and respectively. The distributions of for charmonium events are shown in Figure 1. In the case of , only the direction of the is measured, and, to determine its momentum, both experiments constrain the mass of the candidate to the mass. Next, they plot either the of the candidate, or . These distributions are also shown in Figure 1.

| BABAR | Belle | |||
|---|---|---|---|---|
| Mode | (%) | (%) | ||
| 1429 | 96 | 1116 | 96 | |
| other () | 721 | 85 | 523 | 86 |
| 283 | 73 | 89 | 84 | |
| flavour eigenstates | 32700 | 83 | 18045 | 82 |
2.2 Determination of
The time difference can be related to the distance along the boost axis between the decay points of the two mesons. Approximating the unmeasured sum of the proper times by the average lifetime, , yields , where , and are the polar angle with respect to the boost direction, the velocity and the boost of the reconstructed candidate in the frame. Whereas BABAR solves the above equation for , Belle makes an approximation which only keeps the first term: .
As one of the mesons, is fully reconstructed, its decay vertex position is well known. The decay vertex of the other meson, , is inferred from the charged particle tracks remaining after the decay products of are removed. To remove tracks from secondary decays, both experiments first remove tracks from and candidates as well as photon conversion, and then perform an iterative fit procedure, rejecting those tracks with the large contribution to the . In the case of Belle, the constraint that the vertex of is consistent with the beamspot is applied. BABAR instead requires that the vertex is consistent with the line of flight computed from the location of the beamspot, the momentum of and the known boost. The resolution obtained on , determined from the fully reconstructed flavour samples, is 1.1 ps for BABAR and 1.4 ps for Belle, partly due to the difference in the boost.
2.3 Flavour tagging
After the daughter tracks of the are removed from the event, the remaining tracks are analyzed to determine the flavour of the , and this ensemble is assigned a flavour tag, either or . For this purpose, flavour tagging information carried by primary leptons from semileptonic decays, charged kaons, soft pions from decays, and more generally by high momentum charged particles is used.
Belle uses the likelihood ratios of the properties of these particles to estimate the mistag rate for each individual event, and then ranks events into six mutually exclusive groups based on their estimated mistag rate. BABAR uses neural networks, trained according to each of the physics processes mentioned above, and classifies events into four mutually exclusive categories according to the underlying physics process, combined with performance criteria based on the neural network output.
As the amplitude of the observed asymmetries will be reduced by a factor , where is the mistag rate, it is crucial for the experiments to determine the mistag rates of the various tagging categories from data. This can be done by considering decays to flavour eigenstates, where the deviation of the observed mixing asymmetry from unity is also given by . BABAR uses fully reconstructed events in the modes and , whereas Belle uses fully reconstructed events in modes and , complemented by events. In the case of Belle, the mistag rates are determined by fitting the control samples separately, and then propagating the obtained values to the fit on the sample. The statistical uncertainty on the mistag rates due to the finite size of the control samples is accounted for in systematic errors. BABAR proceeds differently, performing a simultaneous fit to both the control samples and the sample. This automatically insures that the statistical error on the mistag rates is propagated into the statistical error on the asymmetries. Even though the flavour tagging algorithms are somewhat different between the experiments, their performance is very similar: the total effective tagging efficiency , which is given by , is measured to be for Belle, and for BABAR.
One complication has recently received attention, partly due to its relation to the measurement of : when decays of the type are used to infer the flavour of the parent mesons, one suffers from an intrinsic mistag rate due to the contribution of CKM suppressed decays. This effect is put to good use in the measurement of , as the suppressed mode can, once oscillations are taken into account, interfere with the favoured amplitude. As the relative weak phase between these decay amplitudes is given by , the results is a time-dependent asymmetry, depending on , albeit with a magnitude which is suppressed by . This same interference, when applied to the tagging decay effectively results in a mistag rate which is not constant as a function of , and thus is not accounted for in the experimental determined mistag rate which is assumed to be independent of . However, because the two mesons produced by decays are correlated until one of them decays, interference terms involving favoured and suppressed amplitudes are only suppressed by a factor of about . The result is that for the and coefficients are now given by [11]:
where and are the effective strong phase and ratio of the suppressed to favored amplitudes obtained when all final states contributing to a particular tagging category are combined, and , an empirical constant which depends on the values of and , is approximately 0.3. Fortunately, lepton tags are unaffected by this effect, and, as lepton tags represent about of the effective tagging efficiency, this effect is suppressed by a factor of . As can be seen from equations above the largest effect is present for , whereas the extraction of from is not very much affected. However, this effect currently dominates the systematic uncertainty on the extraction of from .

2.4 Current measurements with transitions
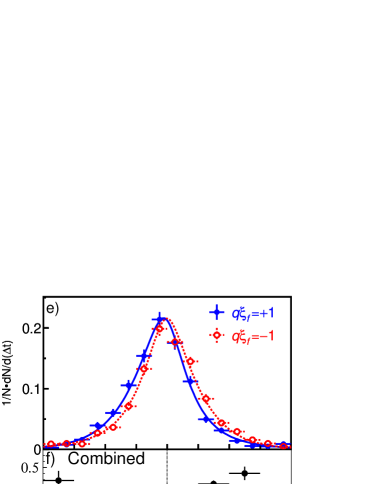
The value of is determined from unbinned maximum-likelihood fits to the distributions, taking into account the resolution and the mistag rates. The projections of the likelihood fits onto the observed distributions is shown in Figure 2. A clear difference in the distributions for and tagged events is visible. The values measured by the two experiments are
in good agreement with each other. Combining the two measurements yields
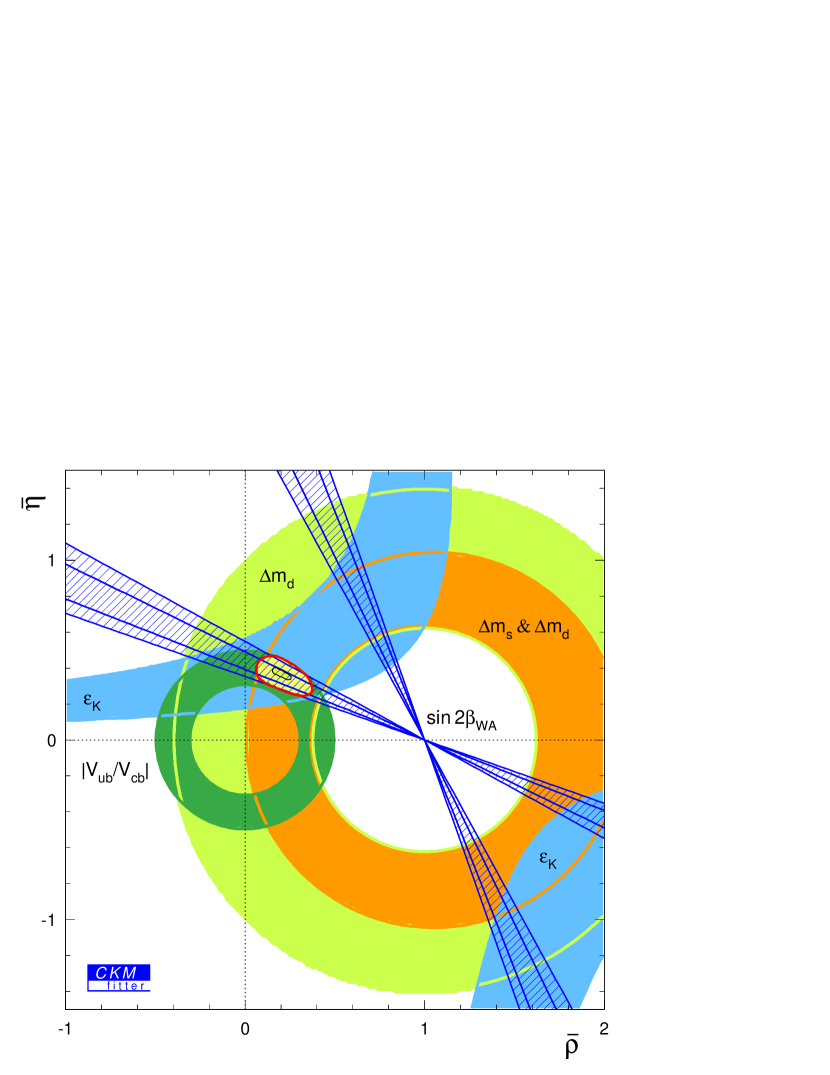
The constraint of this measurement on the parameters of the CKM matrix can be visualized in the plane, as shown in Figure 3. In addition the constraints derived from -conserving measurements and the observed violation in the neutral kaon system are included [8].
2.5 Extrapolation to larger samples
Both -factories are performing above expectations, having accumulated well over 100 each in their first four years of operation. Currently, PEP-II is capable of routinely delivering more than 300 per day, whereas KEK-B has recently set a record for daily integrated luminosity of 500. As a result, both experiments are well on their way to collecting on the order of 500 by 2006. Looking into the past, comparing how the statistical error on has improved versus the integrated luminosity, both experiments have been able to perform better than by improving their reconstruction, calibrations and selections. It is however clear that the impact of future improvements, other than increased sample size, on the statistical error will be less and less pronounced. As a result one can expect a statistical error on of approximately given a 500 sample. The main effort will have to be focused on reducing the systematic error. Currently the measurement of is still dominated by the statistical error, but the current systematic uncertainty, even though it is partly driven by the available sample size, will reach parity with the statistical error at the level of about 500 . It is expected that with a combination of additional improvements to selections, vertexing and tagging, and further studies of the data with improved control samples, the systematic error can be reduced sufficiently such that the measurement on 500 will still be limited by the statistical accuracy.
3 Approximations in the determination of
In the determination of described above some very reasonable assumptions are made about both mixing and the decay amplitudes and . The evolution of the and states prior to their decay is described by oscillations and with a frequency given by the mass difference of the mass eigenstates, multiplied by factors and , respectively. In the measurement of , it is assumed that , which, given the Standard Model expectation of for the system [12], is a very good approximation. If , the rate of and should be equal, unlike the case for the neutral Kaon system. This possible rate difference can be determined by measuring the like-sign lepton asymmetry, . Several measurements of this asymmetry are available [13], and recently this asymmetry has also been measured by BABAR [14] to be , which corresponds to .
Recently BABAR has also determined using samples of flavour tagged, fully reconstructed decays of mesons to either or flavour eigenstates [15]. Although the sensitivity to is less than for a like-sign dilepton analysis, these samples allow one to also set a limit on the lifetime difference between the mass eigenstates and on the complex CPT violating parameter , which is proportional to the mass- and lifetime differences between and states. In the Standard Model, CPT is conserved, and is expected to be [16], and thus both effects are neglected in the extraction of . Within the limited uncertainties of this measurement, no deviations from the Standard Model expectations of and are observed.
An additional assumption made in identifying the sine coefficient of the time-dependent asymmetry in as is that the decay itself is dominated by a single weak phase. This is an excellent approximation as the leading penguin contributions have the same weak phase as the CKM favoured tree diagram. This assumption can to some extent be tested by considering the decay , which is related to by exchange of the spectator quark. In case there would be a sizable contribution from diagrams with a different weak phase, there might be a non-zero charge asymmetry: This asymmetry has been measured by both BABAR and Belle [17], and the values obtained are consistent with zero:
The decays and both proceed through CKM favoured, colour suppressed tree diagrams , followed by and respectively. As a result, neglecting the tiny amount of violation in neutral kaon mixing, the time dependent asymmetries in and should be equal in magnitude, but opposite in sign, . It can be shown that to generate a deviation of more than a few times , interference between the favoured decay and a so-called wrong flavour decay, , is required [18]. By considering the related decay , with decaying to , one can tag the kaon flavour in the decay, and by performing a time-dependent analysis BABAR measures the following ratios of wrong-flavour to favoured amplitudes [19]:
Again, no evidence for a deviation from the Standard Model expectations is observed.
4 Measurement of with
The decay of , proceeds through two -even amplitudes (,) and one -odd amplitude (). This implies that, unless one takes into account the angular dependence of the contributing amplitudes, the magnitude of the asymmetry is diluted by an additional factor , where is the fraction of -odd decay rate. The simplest way to extract from these decays is to measure , and insert the additional dilution in the time dependent analysis. Both BABAR and Belle have measured [20], and the combined results shows that this decay is mostly -even, . One can improve the sensitivity by taking into account the dependence of -even and odd amplitudes on , where is the angle in the rest-frame between the positive lepton and the normal to the decay plane of the : the -even components are proportional to , and the -odd component is proportional to . A further refinement can be obtained by including all three angles that describe this decay. Denoting the three observable angles in this decay by , the decay rate is given by [21, 22]:
and at first sight one expects to be able to determine . This would allow one to eliminate two of the four ambiguities in from the measurement of . Unfortunately the observable is invariant under the transformation , where are the relative phases between . As a result one can only determine the sign of if one could choose between the two possible solutions for the strong phases. The two experiments quote both ambiguities [21, 22], including the corresponding strong phases:
Thus reducing the number of ambiguities in will require additional information on which strong phase solution to pick. For example, assuming -quark helicity conservation [23], the positive solution seems preferred, but even then the current errors on are still too large to rule out negative values.
5 Modes with penguin contributions
5.1
In the case of , the tree diagram is CKM suppressed compared to . One has thus the possibility that this mode receives non-negligible contributions from penguin diagrams with a weak phase different from the tree diagram. Both -factory experiments have observed this decay and determined and [24]:
The precision is such that more data is needed to draw a conclusion on the possible penguin contribution to the asymmetries in this channel.
5.2
There is considerable interest in decays where the leading contribution to the amplitude is due to loop diagrams, as new physics processes could provide significant contributions. An example are transitions of the type the and , which are given by gluonic penguin decays, and for which the dominant penguin contribution has the same phase as . As a result, the process should exhibit the same asymmetry as . However, even in the Standard Model there are diagrams with different weak phases which contribute to the decay , but one can set limits on their magnitude using isospin related decays such as and . As a result one expects that within the Standard Model the deviation of from should be less than 5% [25]. Again both experiments have observed clear signals in this mode and measured the asymmetries [19, 26]:
In addition, Belle has measured the time-dependent asymmetries for the non-resonant final state, and obtains
Although the measurements show a trend for smaller or even negative values for , the difference with is not yet statistically significant.
5.3
A mode which is similar to is , but with the additional complication of a contribution of a CKM suppressed tree-level contribution. Several estimates of the relative magnitude of the penguin diagram exist, and the deviation of from is expected to be less than [27]. Both experiments observe clear signals for this mode, and measure the time-dependent asymmetries [26, 28]:
Again, no statistically significant deviations from respectively zero are observed.
5.4
The dominant contribution to this decay is the transition , but the presence of penguin contributions could cause deviations of from of about 2% [29]. Similarly to , the decay is a vector-vector decay which receives contributions from three partial waves, and either an angular analysis or a measurement of the -odd fraction is required to interpret the asymmetry. From the distribution of , BABAR determines , and Belle concludes that the decay is dominantly -even [22, 30]. BABAR proceeds to measure the time-dependent asymmetry and finds
5.5
This decay, like , is a , but in this case the final state is not a eigenstate. However, it is still possible to determine the asymmetries [31]. BABAR has measured the following time-dependent asymmetries [19]:
In addition, the time-integrated charge asymmetry has been measured by BABAR to be . Again, no significant deviation from the Standard Model expectation is observed.
6 Conclusion
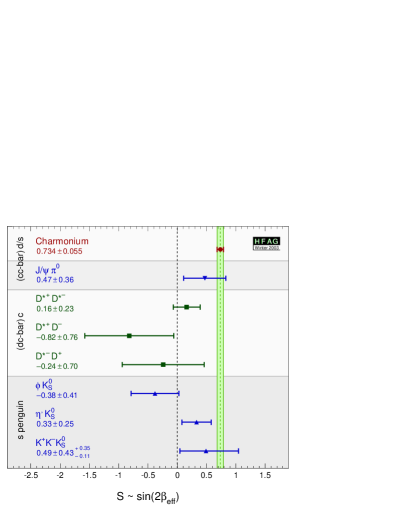
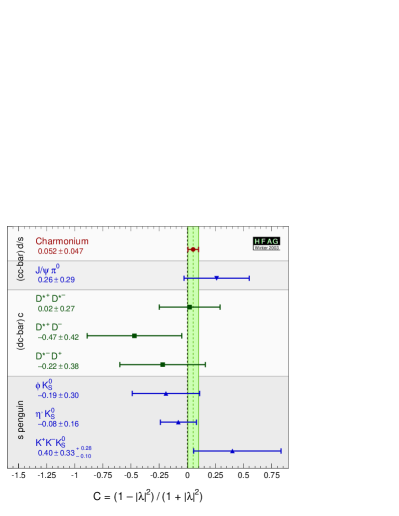
The determination of time dependent -violating asymmetries at asymmetric energy factories has reached maturity: the measurement of with is dominated by Belle and BABAR. In a short time we have gone from the first observation of violation in the B system, to the point where the precision of the direct measurements of has exceeded the prediction from the indirect measurements. The factory experiments have started measuring time-dependent asymmetries in rare modes such as . In the Standard Model, the asymmetries in these modes are, upto small corrections, equal to . A summary of these measurements, averaged over the experiments [32] is shown in Figure 4. There is an intriguing trend for these measurements to be lower than expected, but the current experimental errors are such that no firm conclusion can be drawn yet. It will be interesting to see whether these measurements will converge, as additional luminosity is collected, towards the value of measured with , or whether they will become significant deviations, indicating the presence of New Physics.
References
- [1] J.H. Christenson et al., Phys. Rev. Lett. 13, 138 (1964); NA31 Collaboration, G.D. Barr et al., Phys. Lett. 317, 233 (1993); E731 Collaboration, L.K. Gibbons et al., Phys. Rev. Lett. 70, 1203 (1993).
- [2] N. Cabibbo, Phys. Rev. Lett. 10, 531 (1963); M. Kobayashi and T. Maskawa, Prog. Th. Phys. 49, 652 (1973).
- [3] See, for instance, “Overall determinations of the CKM matrix”, Section 14 in “The BABAR physics book”, eds. P. H. Harrison and H. R. Quinn, SLAC-R-504 (1998), and references therein; “The CKM Matrix and the Unitarity Triangle”, eds. M. Battaglia, A. J. Buras, P. Gambino, A. Stochi, hep-ph/0304132 (2003), to appear as a CERN Yellow Report.
- [4] For an introduction to violation, see, for instance, “A violation primer”, Section 1 in “The BABAR physics book”, op. cit. [3].
- [5] A.B. Carter and A.I. Sanda, Phys. Rev. D 23, 1567 (1981); I.I. Bigi and A.I. Sanda, Nucl. Phys. B 193,85 (1981).
- [6] Aleph Collaboration, Phys. Lett. B 492, 259-274 (2000); Opal Collaboration, Eur. Phys. Jour. C 5, 379-388 (1998); CDF Collaboration, Phys. Rev. D 61, 072005 (2000).
- [7] BABAR collaboration, B. Aubert et al., Phys. Rev. Lett. 89, 201802 (2002); Belle Collaboration, K. Abe et al., Phys. Rev. D 66, 071102 (2002).
- [8] A. Höcker, H. Lacker, S. Laplace, F. LeDiberder, Eur. Phys. Jour. C 21,225 (2001), updated results and plots at http://ckmfitter.in2p3.fr.
- [9] See, for example, F. Parodi, P. Roudea, A. Stocchi, Nuo. Cim. 112A (1999) 833; M. Ciuchini et al., JHEP 0107 (2001) 013; and V. Lubicz, these proceedings, hep-ph/0307195.
- [10] PEP-II: An asymmetric B Factory, Conceptual Design Report, SLAC-418,LBL-5379 (1993); S. Kurokawa, et al., Nucl. Instr. and Methods A 462, 139 (2001).
- [11] O. Long, M. Baak, R. Cahn, D. Kirkby, to appear in Phys. Rev. D, hep-ex/030303 (2003).
- [12] See, for example, R.N. Cahn and M.P. Worah, Phys. Rev. D 60, 076006 (1999); Y. Nir, hep-ph/9911321, and references therein.
- [13] Opal collaboration, K. Ackerstaff et al., Z. Phys. C 76 401 (1997); CDF collaboration, F. Abe et al., Phys. Rev. D 55, 2546 (1997); Opal collaboration, G. Abbiendie et al., Eur. Phys. Jour. C 12, 609 (2000); Aleph collaboration, R. Barate et al., Eur. Phys. Jour. C 20, 431 (2001); CLEO collaboration, D.E. Jaffe et al., Phys. Rev. Lett. 86,5000 (2001).
- [14] BABAR collaboration, B. Aubert et al., Phys. Rev. Lett. 88, 231808 (2002).
- [15] BABAR collaboration, B. Aubert et al., hep-ex/0303043.
- [16] A.S. Dighe, T. Hurth, C.S. Kim and T. Yoshikawa, Nucl. Phys. B 624, 377 (2002).
- [17] BABAR collaboration, B. Aubert et al., Phys. Rev. D RC65 2001; Belle collaboration, K. Abe et al., hep-ex/0211047.
- [18] Y. Grossman, A.L. Kagan and Z. Ligeti, Phys. Lett. B 538, 327 (2002).
- [19] G. Hamel De Monchenault, BABAR collaboration, hep-ex/0305055.
- [20] BABAR collaboration, B. Aubert et al., Phys. Rev. Lett. 87, 241801 (2001); Belle collaboration, K. Abe et al., Phys. Lett. B538, 11-20 (2002).
- [21] BABAR collaboration, B. Aubert et al., hep-ex/0203007.
- [22] R. Itoh, Belle collaboration, hep-ex/0210025.
- [23] M. Suzuki, Phys. Rev. D 64, 117503.
- [24] BABAR collaboration, B. Aubert et al., hep-ex/0207058, (2002); Belle collaboration, K. Abe et al., hep-ex/0207098, (2002).
- [25] Y. Grossman,G. Isidori,M.P. Worah, Phys. Rev. D 58, 057504 (1998).
- [26] Belle collaboration, K. Abe et al., Phys. Rev. D 67, 031102 (2003).
- [27] D. London and A. Soni, Phys. Lett. B 407, 61 (1997); M. Beneke and M. Neubert, Nucl. Phys. B 651, 225 (2003).
- [28] BABAR collaboration, B. Aubert et al., hep-ex/0303046 (2003).
- [29] X.Y. Pham and Z.Z. Xing, Phys. Rev. B 458, 375 (1999).
- [30] BABAR collaboration, B. Aubert et al., hep-ex/0303004 (2003).
- [31] M. Gronau, Phys. Rev. Lett. 63, 1451 (1989); M. Gronau, Phys. Lett. B 233, 479 (1989).
- [32] Heavy Flavor Averaging Group, see also http://www.slac.stanford.edu/xorg/hfag.