SLAC-PUB-10065
hep-ex/0307045
July, 2003
Recent measurements of violation at the B factories
Gabriella Sciolla
Massachusetts Institute of Technology
77 Massachusetts Avenue,
Cambridge, MA 02139-4307, USA
sciolla@mit.edu
Abstract
Recent measurements of time dependent asymmetries at the factories have led to substantial progress in our understanding of violation. In this article, I review some of these experimental results and discuss their implications in the Standard Model and their sensitivity to New Physics.
To be published in Modern Physics Letters A.
Work supported in part by Department of Energy contract DE-FC02-94ER40818.
1 Introduction
violation is one of the most intriguing and least understood topics in particle physics. According to Sakharov[1], violation is a necessary condition to explain how equal amounts of matter and anti-matter created in the Big Bang may have evolved into a matter-dominated universe. Thus violation is a requisite to our own existence.
violation was discovered[2] in 1964 in the decays of mesons into two pion final states. A simple and elegant explanation of this effect in the context of the Standard Model was proposed by Kobayashi and Maskawa[3] in 1972. In the Kobayashi-Maskawa mechanism, violation originates from a single complex phase in the mixing matrix between the three quark families. This mechanism, however, does not allow for enough violation to explain the matter-dominated universe[4]. Understanding the mechanism that governs this phenomenon, and eventually uncovering its origin, remains one of the central questions in modern physics.
Many precise measurements of violation have been made in the study of decays of neutral kaons[5]. However, due to hadronic uncertainties, these measurements do not pose significant constraints on the parameters of the theory. In contrast, large violation effects essentially free of hadronic uncertainties are expected in final states of meson decays.
Two asymmetric factories, PEP-II at SLAC and KEKB at KEK, were designed for studying violation in the system as their main goal. Since the beginning of data taking in 1999, the factories recorded unprecedented samples of mesons and started a new era in the study of violation and physics.
In this article, I review some of the results on violation obtained so far at the factories and discuss how these measurements constrain the Standard Model, and how they can be used to probe New Physics.
2 violation in the Standard Model
In the Standard Model, violation originates from a complex phase in the quark-mixing matrix, the Cabibbo-Kobayashi-Maskawa (CKM) matrix. Following Wolfenstein’s notation[6], the CKM matrix can be expressed in terms of four real parameters , , and as
The coefficient is the sine of the Cabibbo angle, which is well measured from studies of decays. The coefficient is related to the CKM matrix element and can be determined from the study of semileptonic decays such as . The parameters and are related to violation in the system.
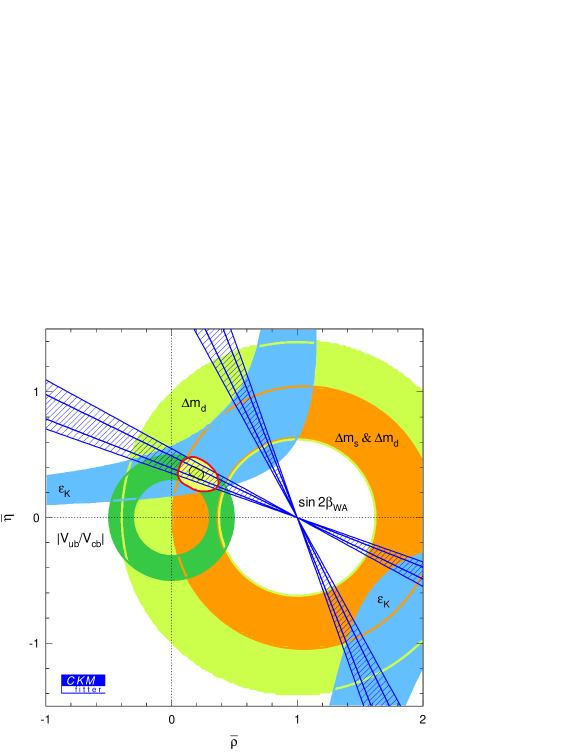
The CKM matrix is unitary, i.e. . This implies six equations that relate the elements of the matrix. One of these equations, , is particularly useful for studies of violation in the system. Dividing all the elements of the sum by , we obtain the “Unitarity Triangle” (UT) shown in figure 1 in the (,) plane.
Because the lengths of the sides of the triangle are of the same order, the angles can be large (), leading to potentially large -violating asymmetries from phases between CKM matrix elements. This means that for this triangle one can experimentally measure both sides and angles. These measurements over-constrain the triangle, thus allowing for consistency checks of the sector of the Standard Model.
The side is constrained by measurements of from studies of and transitions. The side is constrained by measurements of and mixing frequencies. Another constraint on the apex of the Unitarity Triangle comes from the measurement of the violation parameter in the kaon system. The measurements of the angles come from violation studies in decays.
A comparison between the measurement of the angles and the position of the apex of the UT in the (,) plane allows a quantitative test of the sector of the Standard Model. Studies of violation in the system can also be used as a probe for New Physics that could enhance the role of box or penguin diagrams relative to the tree diagrams, due to the contribution of new (virtual) particles participating in the loops.
3 violation in decays
We define and the neutral meson flavor eigenstates, and and the eigenstates of the Hamiltonian, with definite mass and lifetime. The mass eigenstates can be expressed in terms of the flavor eigenstates:
where and are complex coefficients that satisfy the condition .
The time evolution of a pure or state at time , is given by:
| (1) |
where and .
Let’s consider decays of and mesons into a final state that is a eigenstate, , and define the two decay amplitudes as
The probability for a or a to decay in the final state at the time will be proportional to the square of the time dependent amplitudes and :
| (2) |
where
| (3) |
with being the eigenvalue of the final state , and the mass difference between the mass eigenstates and .
We define the time dependent asymmetry as:
| (4) |
Substituting (2) into the definition (4), it follows that
| (5) |
where
| (6) |
For decays, . If only one diagram contributes to the final state, as in the case of , , thus . This simplifies equation (5) leaving the time dependent asymmetry with only a sine component having amplitude :
| (7) |
For these final states, is directly and simply related to the angles of the UT triangle.
If more than one diagram contributes to the final state , then maintains both the sine and cosine components. The coefficient is still related to the the angles of the UT, while measures direct violation.
4 The experimental apparatus
The two asymmetric factories, PEP-II[7] at SLAC and KEKB[8] at KEK, have similar designs. They are both colliders operating at a center of mass energy of GeV, the mass of the resonance. This resonance decays exclusively to and pairs, providing ideal conditions for the study of meson decays.
PEP-II collides 9.0 GeV electron and 3.1 GeV positron beams head-on, producing with a Lorentz boost of = 0.56 along the electron beam axis. KEKB, on the other hand, collides 8.0 GeV electron and 3.5 GeV positron beams at a small (11 mrad) crossing angle, producing with . These boosts are essential to violation studies because they allow the experiments to separate the decay vertices of the two mesons, and thus to measure the time dependence of their decay rates.
Each machine hosts a large solid angle general purpose detector: BaBar[9] at PEP-II and Belle[10] at KEKB. Both detectors are equipped with silicon vertex detectors, cylindrical drift chambers, Cherenkov detectors for particle identification, crystal calorimeters and muon detection systems. The magnetic field is provided by 1.5 T superconducting solenoidal coils.
Both facilities have been running very successfully since 1999, reaching or surpassing their design luminosities: PEP-II doubled the design goal and achieved 61033 cm-2s-1, while KEKB has reached the design luminosity of 11034 cm-2s-1. The integrated luminosities delivered to date by the two machines are 136 fb-1 for PEP-II and 155 fb-1 for KEKB. Of these, about 82 fb-1 and 78 fb-1 have been analyzed by the BaBar and Belle Collaborations, respectively, to produce the results discussed in this article.
5 The measurement of at the factories
At the factories, violation is studied through the measurement of the time dependent asymmetry, , defined in (4). The measurement utilizes those decays of the into two neutral mesons, of which one () can be completely reconstructed into a eigenstate, while the decay products of the other () are measured in an attempt to infer its flavor at decay time.
Due to the intrinsic spin of the , the pair is produced in a coherent state. After production, each meson will evolve in time as given in equation (1). Because the net quantum numbers of the system are conserved, the two mesons evolve in phase until one of them decays. When the first meson decays into a flavor eigenstate, the other is dictated to be of opposite flavor at that same instant. For this reason the time that appears in (4) can be considered as the difference in time between the two decays ().
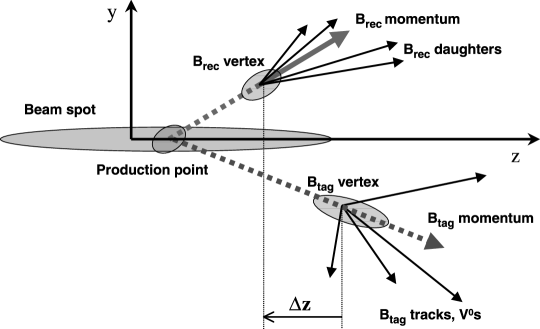
A schematic view of a typical event used for analysis is given in figure 2. The logical steps of the analysis are discussed in the following subsections. More detailed information about the analysis techniques can be found in references [11] and [12].
5.1 Reconstruction of eigenstates
Abundant and pure exclusive reconstruction of final states is the first step to a successful measurement. Since the branching fractions of experimentally accessible states are small (between 10-6 and 10-4) it is crucial to use as many modes as possible to enhance the statistical significance of the measurement. In order to preserve the interpretation of the measurements, only decays characterized by the same Feynman diagrams are combined.
5.2 Flavor tagging
The flavor of the can be inferred by the charge of various particles produced in its decay. The purest information comes from high momentum leptons produced in semileptonic decays. Although less pure than the leptons, charged kaons are also an excellent source of tagging information because they are very commonly produced in decays. Further tagging discrimination can be obtained from slow pions produced in the decay of a , from very energetic pions produced from low multiplicity hadronization of the boson in the decay , or from hyperons.
The tagging algorithm combines the above information into a discriminating variable that takes into account correlations between different sources of tagging information. This is achieved in BaBar by the use of an artificial neural network and in Belle by the use of a likelihood function implemented in a look-up table. The BaBar (Belle) tagging algorithm assigns each event to one of four (six) hierarchical and mutually exclusive tagging categories based on the purity of the tag.
The performance of the tagging algorithms is measured by two quantities:
-
•
tagging efficiency () defined as the probability of assigning a or tag,
-
•
mistag fraction () defined as the fraction of wrong tags present in the tagged sample.
Tagging purities and efficiencies are used to calculate the so called “effective tagging efficiency” (), defined as
The sensitivity to depends on to first approximation, so good performance of the tagging algorithm is crucial to the accuracy of the measurement. More importantly, the observed asymmetry is related to that defined in (4) by the expression . Thus, an inaccurate determination of the wrong tag fraction would bias the measured amplitude of the asymmetry. For this reason, the tagging parameters are measured directly from data in the context of the time dependent mixing analysis. In this analysis, one of the two mesons produced in the decay is reconstructed into a flavor eigenstate () while the other is tagged using the algorithm described above. The flavor eigenstates considered for this analysis include hadronic decays such as () and with , or and semileptonic decays such as .
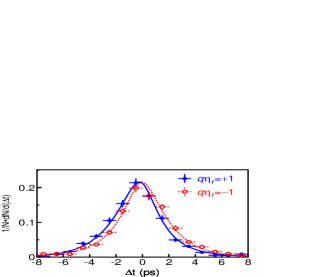
The mistag fraction () can be extracted from the fit of the time dependent mixing asymmetry, , defined as:
where is the number of events with two or two tags, while is the number of events with one and one tags. The result of the fit to is shown in figure 3: the distribution on the left refers to the BaBar measurement of using fully reconstructed hadronic final states[13], while the distribution on the right refers to the Belle measurement of using semileptonic decays[14]. The amplitude of the mixing asymmetry measures directly the “tagging dilution” .

The overall effective tagging efficiency is measured to be in BaBar and in Belle.
5.3 determination
The difference in decay times of the two mesons () can be inferred from the measured distance between the two decay vertices (). Since both mesons are produced with a known boost parallel to the collision () axis, the time between the decays is given by . The average separation between the two decay vertices is about 250 m in BaBar and 200 m in Belle.
The position of the decay vertex of the decaying into a eigenstate () is easily reconstructed by fitting the charged tracks that appear in the decay to a common vertex. The resolution obtained for this vertex is about 60 m.
The reconstruction of the decay vertex of the other meson () is more difficult because it is not possible to completely separate tracks originating promptly from the decay from those originating from decays of mesons produced in . Because of the relatively long lifetime of the mesons, the latter tracks produce a bias when used in the reconstruction of the decay vertex. The position of this vertex is obtained by a vertexing algorithm that uses all the charged tracks that do not belong to the side along with constraints from the beam spot location. Tracks identified as decay products of , or photon conversions, as well as poorly reconstructed tracks, are excluded from the vertex. To minimize the bias due to meson decay products, the algorithm also removes those tracks that give large contribution to the overall of the fit.
Since the resolution on is totally dominated by the tagging side, it is independent from the decay mode of the . This allows us to determine the parameters of the resolution function from an independent sample of mesons exclusively reconstructed into flavor eigenstates. The time resolution is measured to be about 1.1 ps for BaBar and 1.4 ps for Belle.
5.4 CP asymmetry fit
The asymmetry amplitudes are determined from an unbinned maximum likelihood fit to the distributions for events tagged as and . The BaBar analysis[11] uses a combined fit to determine simultaneously the , tagging and vertexing parameters from the and samples. This approach takes better account of the correlations between the various parameters. Belle[12], instead, prefers to disentangle the fit of the asymmetries from the determination of the vertexing and tagging parameters, thereby simplifying the final fit and the study of systematics.
6 The “golden” measurement of the angle
The decays are known as the “golden modes” for the measurement of the angle of the UT. These decays are dominated by a tree level diagram with internal boson emission. The leading penguin diagram contribution to the final state has the same weak phase as the tree diagram, and the largest term with different weak phase is a penguin diagram contribution suppressed by . This makes a very good approximation, and thus .
For the “golden modes”, is given by:
| (8) |
were the first term comes from - mixing, the second from the ratio of the amplitudes and the third from mixing. The parameter is the eigenvalue of the final state, negative for charmonium + and positive for charmonium + .
From (8) and (7) it follows that
| (9) |
which shows how the angle is directly and simply measured by the amplitude of the time dependent asymmetry.
Besides the theoretical simplicity, these modes also offer experimental advantages because of their relatively large branching fractions () and the presence of the narrow resonance in the final state, which provides a powerful rejection of combinatorial background.
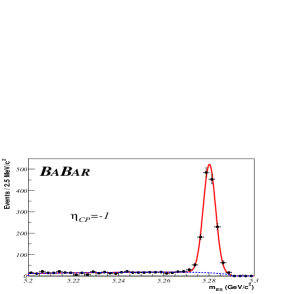
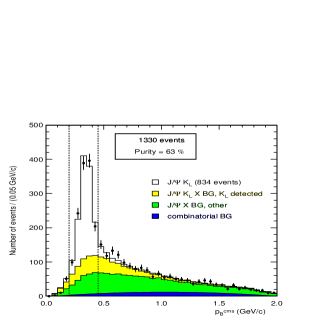
The eigenstates considered for this analysis are , (2S), , , and ()111The final state does not have a definite , but its even and odd components can be disentangled using an angular analysis.. The and are reconstructed from the final states and ; the is reconstructed also from the final state ; the is reconstructed from the radiative decay and the from the hadronic decays , and .
Figure 4 shows the invariant mass distribution for candidates and the momentum distribution for candidates.
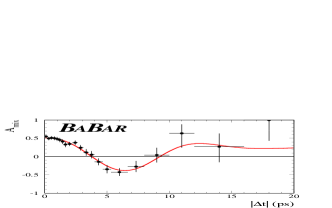
The parameter is determined by fitting the distribution separately for events tagged as and . The asymmetry between the two distributions, clearly visible in figures 5 (BaBar) and 6 (Belle), is a manifestation of violation in the system. The same figures also display the corresponding raw asymmetry with the projection of the unbinned maximum likelihood fit superimposed.

The results of the fits are for BaBar[15] and for Belle[16]. The main sources of systematic errors are uncertainties in the background level and characteristics, in the parameterization of the resolution, and in the measurement of the mistag fractions. Most of these uncertainties will decrease with additional statistics, and the systematic error is not expected to dominate this measurement at the existing factories in the foreseeable future.
The world average value for , heavily dominated by the factory results described above, is . This value can be compared with the indirect constraints on the apex of the UT originating from measurements of , , , and mixing as described in reference [17]. The comparison, illustrated in figure 7, shows excellent agreement between the measurements, indicating that the observed asymmetry is consistent with the CKM mechanism being the dominant source of violation in flavor changing processes at low energies.
7 violation as a probe for New Physics
violation is an excellent probe for seeking New Physics. The simplicity of the CKM mechanism, with a single source of violation, allows for testable predictions. The cleanliness of the predictions is what makes these studies sensitive to effects of physics beyond the Standard Model that may introduce additional sources of violation, in discrepancy with the predictions of the CKM mechanism.
Despite the excellent agreement between the measurement of in decays of and the constraints on the apex of the UT, New Physics is not ruled out yet[18]. In fact, it may manifest itself in violation in other final states such as , , , and .
The decays and are particularly suited for these studies. In the SM, these decays are dominated by penguin diagrams; a tree level diagram could contribute to but its contribution is small because this decay is both Cabibbo and color suppressed. If, as expected[19], , then the amplitude of the time dependent asymmetry in these decays would measure the parameter in a theoretically clean way. New Physics could alter these expectations via, for example, gluonic penguin diagrams with intermediate squarks and gluinos[18].
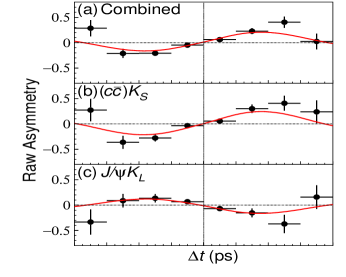
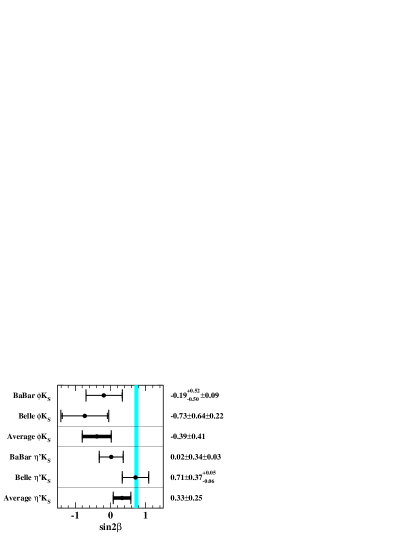
BaBar[20] and Belle[21] have measured violation in and decays, and their results are summarized in figure 8. Although these measurements still suffer from large statistical uncertainties, it is tempting to compare the parameter measured in the penguin-dominated modes with the same parameter measured in the “golden modes”. The comparison shows a discrepancy for the theoretically cleaner channel and discrepancy for . Although it is premature to interpret these measurements as a hint of New Physics, these results are certainly intriguing and they have generated much interest in the community[22].
8 The measurement of the angle
If the decay were dominated by the tree level diagram, the amplitude of the time dependent asymmetry in this channel would be a clean measurement of the parameter . Unfortunately, the contribution of gluonic penguin amplitudes to this final state cannot be neglected. The ratio between the penguin and tree contributions can be estimated from the ratio BF()/BF() to be . These contributions have a different weak phase and additional strong phases[23]. As a result, in the study of time dependent asymmetry one has to fit for both the sine and the cosine terms in equation (5). The coefficient of the sine term can be related to the angle through isospin symmetry[24], while the coefficient of the cosine term measures direct violation.
Experimentally, this analysis is very challenging for several reasons. First, the final state of interest, , has to be disentangled from the similar decay , which has a much larger branching fraction. The excellent particle identification capability provided by the Cherenkov detectors of BaBar and Belle plays a crucial role in suppressing this background.
The second experimental challenge is due to the high combinatorial background from events in which two energetic pions in opposite jets are selected. In BaBar[25], this so-called “continuum” background is suppressed employing a Fisher discriminant built with the momentum flow in nine cones around the candidate axis. In order to optimize the statistical power of the data sample, no cuts are applied on the particle identification and Fisher variables; instead they are included in the maximum likelihood fit.
In the Belle analysis[26], the suppression of continuum is instead achieved by the use of a likelihood analysis using six modified Fox-Wolfram moments[27] and the flight direction. The background is rejected by cutting on the output of the likelihood ratio prior to the fit, where and are the likelihood functions for signal and background.
The distribution for events tagged as and is shown in figures 9 and 10 for the BaBar and Belle experiments, respectively. The bottom plot of these figures displays the corresponding asymmetry after background subtraction, with the projection of the unbinned maximum likelihood fit superimposed.

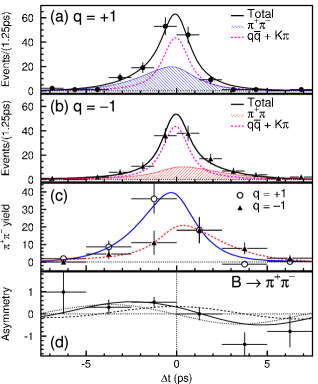
The fitted values for the sine and cosine terms of the time dependent asymmetry obtained in the BaBar experiment are and , both compatible with zero. The corresponding results obtained by Belle are and , indicating that both mixing-induced and direct violation effects in charmless decays are large.
Since the results from the two experiments are compatible (2.2 apart), we can average them to obtain and . The average shows evidence for direct violation (2.6 ), but no compelling evidence for mixing-induced violation (1.8 ). These results can be used to constrain the angle [28]. The accuracy on the determination of the angle of the UT depends critically on the theoretical assumptions used in the fits[29].
A measurement of the angle can also be extracted from the study of the decay . Compared with the mode, this final state has the advantage of a higher branching fraction and a smaller penguin pollution. On the other hand, this analysis is complicated by the presence of four configurations in the final state (, ), by the fact that the final state is not a eigenstate, and by the substantial combinatorial background induced by the presence of three pions. A theoretically clean extraction of is possible, but requires a combined fit over the entire Dalitz plane.
The BaBar Collaboration recently published the results of an exploratory analysis[30] that follows a quasi-two-body approach and avoids the interference regions in the Dalitz plot. The values of the mixing-induced violation parameter and of the direct violation parameter indicate that the accuracy on the extraction of expected from the Dalitz analysis of this decay mode will be competitive.
9 Conclusion
Since the beginning of the data taking in 1999, the factories opened a new chapter in physics. The excellent performance of the accelerators and detectors allowed the BaBar and Belle Collaborations to accumulate an unprecedented sample of decays, which lead to the first unambiguous observation of violation in the sector.
The measurement of the angle of the Unitarity Triangle allowed the first quantitative test of the the sector of the Standard Model. The excellent agreement between direct measurement of the angle and the indirect constraints on the apex of the Unitarity Triangle suggests that the CKM mechanism is the dominant source of violation at low energies.
Contributions from New Physics could be detected in the measurement of asymmetries in penguin dominated decays, such as or . The first measurements of these quantities have been published recently by both Collaborations showing a deviation of compared to the Standard Model expectations for the channel.
The measurement of the angle of the UT through a time dependent analysis is in progress in the channels and . The results of the analysis show evidence for direct violation.
The data analyzed so far by BaBar and Belle corresponds to about 80 fb-1 per experiment. By 2006, each factory expects to have more than 500 fb-1 available for analysis. The increased data sets will allow a precise test of the sector of the Standard Model and will provide a sensitive probe of New Physics.
Acknowledgments
It is a pleasure to thank T. Browder, C. Dallapiccola, D. Lange, M. Morii, Y. Sakai and R. Yamamoto for their careful reading of the the manuscript and helpful comments. This work was supported in part by the DOE contract DE-FC02-94ER40818.
References
References
- [1] A. D. Sakharov, Pisma Zh. Eksp. Teor. Fiz. 5, 32 (1967); JETP Lett. 5, 24 (1967).
- [2] J. H. Christenson et al., Phys. Rev. Lett. 13, 138 (1964).
- [3] M. Kobayashi and T. Maskawa, Prog. Th. Phys. 49, 652 (1973).
- [4] M. B. Gavela et al., Mod. Phys. Lett. A9, 795 (1994) and Nucl. Phys. B340, 382 (1994); P. Huet and E. Sather, Phys. Rev. D51, 379 (1995).
- [5] Particle Data Group, K. Hagiwara et al., Phys. Rev. D 66, 01001 (2002).
- [6] L. Wolfenstein, Phys. Rev. Lett. 51, 1945 (1983).
- [7] W. Kozanecki, Nucl. Instrum. Meth. A 446, 59 (2000).
- [8] S. Kurokawa, Nucl. Instrum. Meth. A 499, 1 (2003).
- [9] B. Aubert et al. (BaBar Collaboration), Nucl. Instrum. Meth. A 479, 1 (2002).
- [10] A. Abashian et al. (Belle Collaboration), Nucl. Instrum. Meth. A 479, 117 (2002).
- [11] B. Aubert et al. (BABAR Collaboration), Phys. Rev. D 66, 032003 (2002).
- [12] K. Abe et al. (Belle Collaboration), Phys. Rev. D 66, 032007 (2002).
- [13] B. Aubert et al. (BABAR Collaboration), Phys. Rev. Lett. 88, 221802 (2002).
- [14] K. Hara et al. (Belle Collaboration), Phys. Rev. Lett. 89, 251803 (2002).
- [15] B. Aubert et al. (BaBar Collaboration), Phys. Rev. Lett. 89, 201802 (2002).
- [16] K. Abe, et al. (Belle Collaboration), Phys. Rev. D 66, 071102(R) (2002).
- [17] A. Hocker et al., Eur. Phys. J. C 21 (2001) 225.
- [18] Y. Nir, Nucl. Phys. Proc. Suppl. 117, 111 (2003).
- [19] Y. Grossman, G. Isidori and M. P. Worah, Phys. Rev. D 58, 057504 (1998).
-
[20]
B. Aubert et al. (BaBar Collaboration), arXiv:hep-ex/0207070;
B. Aubert et al. (BaBar Collaboration), arXiv:hep-ex/0303046. - [21] K. Abe, et al. (Belle Collaboration), Phys. Rev. D 67, 031102(R) (2003)
-
[22]
R. Harnik, D. T. Larson, H. Murayama and A. Pierce, arXiv:hep-ph/0212180;
Y. Grossman, Z. Ligeti, Y. Nir and H. Quinn, arXiv:hep-ph/0303171;
S. Khalil and V. Sanz, arXiv:hep-ph/0306171;
D. Chakraverty, E. Gabrielli, K. Huitu and S. Khalil, arXiv:hep-ph/0306076. -
[23]
M. Gronau, Phys. Rev. Lett. 63, 1451 (1989);
D. London and R. D. Peccei, Phys. Lett. B 223, 257 (1989);
M. Beneke, G. Buchalla, M. Neubert and C. Sachrajda, Nucl. Phys. B 606, 245 (2001);
Y. Y. Keum, H. N. Li and A. I. Sanda, Phys. Rev. D 63, 054008 (2001);
M. Ciuchini, E. Franco, G. Martinelli, M. Pierini and L. Silvestrini, Phys. Lett. B 515, 33 (2001);
M. Gronau and J. L. Rosner, Phys. Rev. D 65, 013004 (2002). - [24] M. Gronau and D. London, Phys. Rev. Lett. 65, 3381 (1990).
- [25] B. Aubert et al. (BaBar Collaboration), Phys. Rev. Lett. 89, 281802 (2002).
- [26] K. Abe et al. (Belle Collaboration), hep-ex/0301032.
- [27] G. C. Fox and S. Wolfram, Phys. Rev. Lett. 41, 1581 (1978).
-
[28]
M. Gronau and J. L. Rosner,
Phys. Rev. D 66, 053003 (2002) [Erratum-ibid. D 66, 119901 (2002)];
Y. Y. Keum and A. I. Sanda, arXiv:hep-ph/0306004;
J. Matias, arXiv:hep-ph/0306058. - [29] A. Hocker et al., LAL 02–103.
- [30] B. Aubert et al. (BaBar Collaboration), SLAC-PUB-9923.