KAMLAND RESULTS
The LMA solution of the solar neutrino problem has been explored with the 1,000 ton liquid scintillator detector, KamLAND. It utilizes nuclear power reactors distributing effectively 180 km from the experimental site. Comparing observed neutrino rate with the calculation of reactor operation histories, an evidence for reactor neutrino disappearance has been obtained from 162 tonyear exposure data. This deficit is only compatible with the LMA solution and the other solutions in the two neutrino oscillation hypothesis are excluded at 99.95% confidence level.
1 Reactor Neutrinos
In spite of the deficits observed in all solar neutrino experiments and improvement of their precisions, the solar neutrino problem has lasted for more than 30 years. A recent revolutionary neutral-current-measurement by SNO experiment has provided an evidence of neutrino flavor transformation and proved that the problem is really on neutrino characteristic. We also know the evidence of atmospheric neutrino oscillation from SK, and it is natural to invest neutrino oscillation hypothesis to explain the solar neutrino problem. In the two neutrino oscillation hypothesis, the large mixing angle (LMA) solution is the most preferable solution. However, another solution also appears at 99% confidence level and even completely different models such as neutrino magnetic moment and neutrino decay can explain all the experimental data as well as the LMA solution.
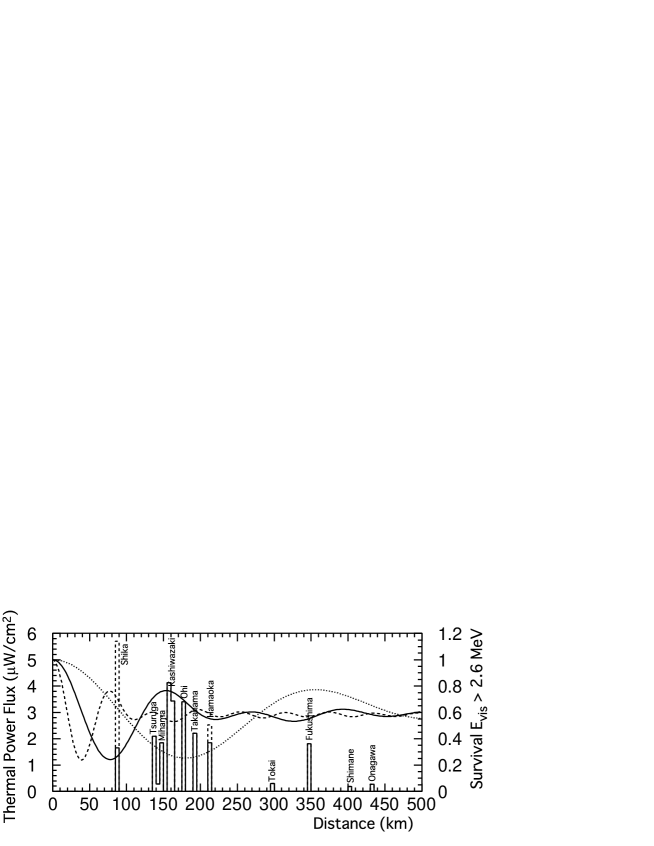
It is necessary to use a well-understood artificial neutrino source to meet a breakthrough in the solar neutrino study. Anti-electron-neutrinos from nuclear power plants are such candidates. Total power generation of world-wide reactors amounts to 1.1 TW and it corresponds to one third mole creation per second. Fortunate characteristic of KamLAND site is that 70 GW (7% of world total) distributes at distances from 130 to 240 km and consists 80% of neutrino flux at Kamioka site, . This long baseline, effectively 180 km, is sensitive to the LMA oscillation parameters as shown in Fig. 1.
Thermal power output of rector cores directly relates to the neutrino flux. Those of all 54 Japanese commercial reactor cores are measured with strictly better than 2% accuracy. In more detail, contributions from 4 different fissile nuclei, 235U, 238U, 239Pu and 241Pu, have to be known for 1% precision. Since the chemical composition of nuclear fuel changes in time as a burn-up effect, we have to know the initial 235U enrichment and history of thermal power output for each relevant reactor cores. This history information is also important to estimate time lag (0.28% error) of beta decay from energy release and non-equilibrium effect of long-life nuclei (0.65% error). We have obtained these information from all 54 Japanese cores. The contribution of Korean reactors is 2.5% and we obtained history of their electric power output. Conversion of electric powers to thermal ones causes 10% error and, thus, Korean reactor makes 0.3% error on neutrino flux estimation. All the other reactors contribute by only 0.7% of total neutrino flux and error contribution from them won’t be larger than 0.35%. Measured and/or calculated neutrino spectra for 4 fissile nuclei make 2.48% error on neutrino event rate. Cross section of inverse beta decay is strongly related to free neutron life time. Recent precise measurement of its life time (0.1%) improved calculation of the cross section to better than 0.2% with 1st order radiative corrections.
2 KamLAND Detector
KamLAND is the KAMioka Liquid-scintillator Anti-Neutrino Detector located at the cavity for the former Kamiokande experiment. It contains 1,200 m3 liquid scintillator (LS: Pseudo-cumene 20%, dodecane 80% and PPO 1.5g/l) and 1,800 m3 buffer oil (BO) in 18 m diameter stainless steel tank. Free protons in the LS are the targets. A positron from the inverse beta decay reaction () and a 2.2 MeV gamma ray from the neutron capture on a proton (mean capture time is 210 sec) make clear two-fold-delayed-coincidence signal. The LS is suspended in the BO with an 135m-thick-film balloon (EVOH-Nylon-Nylon-Nylon-EVOH) and Kevlar rope network controled at neutral buoyancy (0.04% heavier). Photons emitted in the detector are monitored by 1325 newly developed 17” tubes and 554 old Kamiokande 20” tubes. While the total photo-coverage is 34%, only the 17” tubes, corresponding to 22%, are used for this analysis. All these PMTs are isolated from inner region by a 3-mm-thick acrylic sphere preventing radon emanation from these materials. The outer detector (OD) is a water Cherenkov detector with 3.2 kton pure water and 225 old Kamiokande 20” tubes for purposes of external background absorption and cosmic-ray muon tag.
Each photo-tubes are connected to two sets of three ranges analog-transient-waveform-digitizer recording whole pulse shape from one to thousands of photo-electrons for about 200 nsec. Global triggers are issued based on number of hit channels (each channels has about 0.3 p.e. threshold) and currently set at 200 hits ( 700 keV) as a prompt trigger and at 120 hits (400 keV) as delayed trigger for 1 msec after each prompt triggers. Current trigger rate is 25 Hz and the data size amounts to 400 GB/day. This huge data size determines the lowest trigger threshold but it is sufficiently low for the reactor neutrino analysis (all phenomena have visible energies more than two electron mass). The OD trigger threshold is set to provide more than 99% muon tagging efficiency.
The primary target, reactor neutrino measurements, requires radioactive impurity level of lower than 10-13g/g for Uranium and Thorium. These impurity level are measured by tagging 214,212Bi-214,212Po in their decay chain and found to be g/g of Uranium and g/g of Thorium assuming radioactive equilibrium. These values are much better than the initial requirement and even better than that of the future 7Be solar neutrino measurement. However, an extra purification of 85Kr and 210Pb (daughter of 222Rn) contamination is necessary to start solar neutrino observation in the second stage. Vigorous efforts are being made to invent an efficient purification method and methods to measure their concentration. Requirements and achievements are listed in Table. 1.
| Impurities | Achievements | Req.(reactor) | Req.(solar) |
|---|---|---|---|
| 222Rn | 0.03 Bq/m3 | ||
| 238U | g/g | g/g | g/g |
| 232Th | g/g | g/g | g/g |
| 40K | g/g | g/g | g/g |
| 85Kr | 1 Bq/m3 | 1 Bq/m3 | |
| 210Pb | 100 mBq/m3 | 1 Bq/m3 | |
| on the balloon | equiv. mine dust | ||
| 222Rn | Bq | ||
| 238U | g | 0.9 g | |
| 232Th | g | 0.1 g |
3 Calibrations and Systematic errors
Energy calibrations are performed suspending radioactive sources (68Ge, 65Zn, 60Co and AmBe) along the z-axis. They covers energy range from 0.5 MeV to 7.6 MeV. Spallation products (neutron, 12B/12N and 8He/9Li) are also utilized to know the behavior at off z-axis and in higher energies up to 15 MeV. They distribute uniformly both in time and space and thus very useful to monitor space uniformity and time variation. Gamma rays (40K and 208Tl) from external material also provided a good monitor of time variations. In addition to these wide energy range calibrations, alpha decays in Bi-Po chain provides wide variety of dE/dx and it helped detail study of quenching effect of LS (thus linearity study of energy scale). Observed uniformity of energy scale is better than 0.5% in 5-m-radius fiducial volume and time variation of the scale was controlled within 0.6%. The systematic error for the 2.6 MeV energy threshold is estimated as 2.13% in neutrino event rate. Observed photon yield is 300 p.e./MeV at the center only with 17” PMTs and it will become about 500 p.e./MeV when we start to use 20” PMTs. Current energy resolution is .
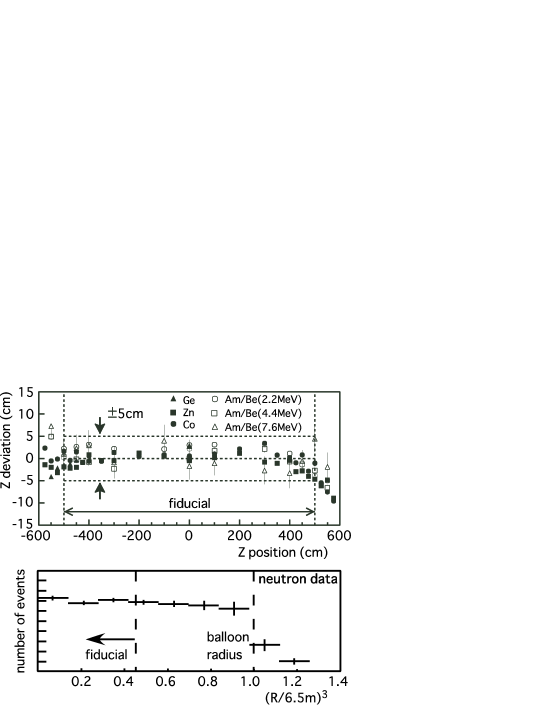
The LS density is 0.780 g/cm3 at 11.5 degree and, thus, the number of free protons in the 5-m-radius fiducial volume is . The fiducial cut is applied based on the reconstructed vertices from the relative times of PMT hits (typical resolution is 25 cm for 2 MeV events). As shown in Fig. 2, observed systematic biases along z-axis are smaller than 5 cm in the entire fiducial range. It corresponds to less than 3% fiducial volume error under spherical symmetry of the detector. This systematic error was verified with uniformly distributing spallation events (gamma ray from neutron capture and 12B beta decays). These spallation events covers energy range from 2.2 MeV to 15MeV where all relevant energies to the reactor neutrino analysis is included. Event rates in the fiducial and in the total volume are compared with the volume ratio and their precision is considered as the systematic error of the fiducial volume. Neutron data gave and 12B data gave . This verification is currently limited by statistics of spallation events. We employ the most conservative value and accounting for uncertainty in the LS total mass of 2.13%, we assign 4.6% as the systematic error of the number of target protons.
Detection and tagging efficiencies of delayed coincidence signals are measured by a LED pulser, intensity measurements of radioactive sources, AmBe delayed coincidence signals and so on. For the specific selection criteria applied in this analysis; (1) a 5-m-radius fiducial cut, (2) a time correlation cut (0.5 sec to 660 sec), (3) a vertex correlation cut (1.6 m), (4) a delayed energy cut (1.8 MeV to 2.6 MeV), and (5) a cylindrical cut around z-axis for delayed signal (1.2 m), we obtained % efficiency for the reactor neutrino signals.
Total systematic error we estimated is 6.42% for 2.6 MeV analysis threshold. And break down of the error is listed in Table. 2.
| Thermal power output (Japanese) | 2.0 | Cross section | 0.2 |
| Korean reactors | 0.3 | Total LS mass | 2.13 |
| Other reactors | 0.35 | Fiducial ratio | 4.06 |
| Burn up effect | 1.0 | Energy threshold | 2.13 |
| Long-life nuclei | 0.65 | Efficiency of Cuts | 2.06 |
| Time lag of beta decay | 0.28 | Live time | 0.07 |
| Neutrino spectra | 2.48 | ||
| Total | 6.42% |
4 Backgrounds
The most difficult background in reactor neutrino analysis is geo-neutrinos. The earth has 44 TW heat flow at the surface. Twenty TW of it is thought to come from radio-activities in the earth, 16 TW from Uranium and Thorium and 4 TW from 40K. In U and Th decay chains, there are beta decays emitting observable with the inverse decay (1.806 MeV threshold). They have identical signature with reactor neutrinos. Thier sharp edges at the end-points will be useful to distinguish them when statistics is sufficient. We currently cannot subtract their contributions blindly using inaccurate predictions. Then, the analysis threshold of visible energy, 2.6 MeV, is set above the geo-neutrino end-point energy, 2.49 MeV. On the other hand, we can separately obtain U and Th contributions from their characteristic energy spectra when sufficient statistics is acquired. Subtraction of nearby contributions with a radio-activity map will make possible to investigate interior of the earth with neutrinos. This is the start of the new field ”Neutrino Geophysics.” The lower threshold covering all events (0.9 MeV) is also used for a consistency check and geo-neutrino search.
Accidental backgrounds are expected to be only and events in final data sets of 0.9 and 2.6 MeV thresholds, respectively. Main fakes are from 210Bi as prompt and 208Tl as delayed events.
We also have two types of correlated backgrounds associated by energetic cosmic-ray muons. One is fast neutrons from outside and another is long-lived beta-decay-nuclei associating neutron emission in the detector. Contribution of fast neutrons are estimated by tagging muons in the OD and look for delayed coincidence signal in the ID. Vertices of such events are concentrated close to the wall, and there are no events entering the fiducial volume. We obtained upper limit of such events. Considering inefficiency of the OD tagging and estimating contribution of rock penetrating muons by simulation with restriction of this measurement, we obtained fast neutron backgrounds be smaller than 0.5 events.
Long-lived neutron emitters are 8He and 9Li. Their half-lives are 0.12 and 0.18 sec and 16% and 50% of their beta decays they also emit neutrons, respectively. In order to eliminate these backgrounds, spallation cuts are employed. We apply 2 msec veto after any muons. For muons with extra energy losses from minimum ionization larger than p.e. (3 GeV), two seconds veto is additionally applied. For smaller energy losses, 2 sec veto is applied only in 3-m-radius cylinder around muon track. These spallation cuts cause 11.4% dead time. After these cuts, we expect and events for two analysis thresholds.
Summary of backgrounds is shown in Table. 3 together with a model prediction of geo-neutrino events.
| Backgrounds | 0.9 MeV threshold | 2.6 MeV threshold |
|---|---|---|
| Accidental | ||
| 8He/9Li | ||
| Fast neutron | ||
| Total | ||
| Geo 16 TW | 9.1 | 0.044 |
5 Results
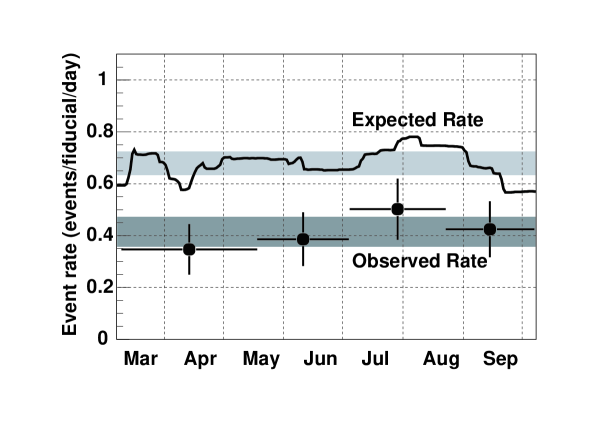
The data used for the analysis is from March 4th to October 6th, 2002. Total live time is 145.1 days (after dead time subtraction) and it corresponds to 162 ton-year exposure. As seen in Fig. 3, observed rates are always smaller than the expected ones from no oscillation. While expected number of neutrino events above 2.6 MeV is , we observed only 54 events including background events resulting neutrino disappesarance at 99.95% confidence level. The ratio (Observed-B.G.)/no-oscillation is . In the 0.9 MeV threshold dataset, we expect reactor neutrino events, backgrounds and also 9 geo-neutrino events from a model. However, we observed only 86 events and low energy data is also consistent with the deficit above 2.6 MeV.
This evidence of neutrino disappearance supports the LMA solution of the solar neutrino problem and all the other oscillation solutions are excluded at 99.95% C.L. under the CPT invariance. Also the other exotic models (RSFP, neutrino decay etc) can not be the leading phenomena of the solar neutrino problem. Adding the KamLAND results to the solar neutrino observations, we finally solved the solar neutrino problem and the LMA solution is the right solution.
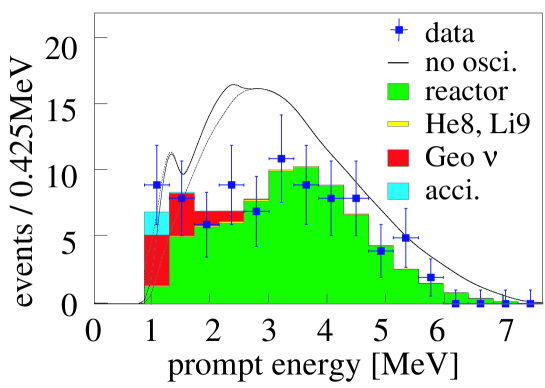
In order to claim the neutrino oscillation with KamLAND data alone, spectrum distortion has to be observed. Currently, the distortion (see Fig. 4) is not significant to claim it but helps to shrink the allowed region of the oscillation parameters. Fig. 5 shows the excluded region from the rate analysis and allowed region from rate + shape analysis with two different threshold data. Only two bands overlap with the LMA region from solar observations. Two different thresholds give similar allowed region and it means data below and above 2.6 MeV are consistent with each other. When using data below 2.6 MeV, both Uranium and Thorium geo-neutrino contributions are treated as free parameters. This is the reason that the allowed region doesn’t shrink with larger statistics in 0.9 MeV threshold. The best fit parameters are met at (,)=(1.0,eV2) with 2.6 MeV threshold and (0.91,) with 0.9 MeV threshold. The mass difference is stable but mixing angle changes easily. In the low threshold analysis, we obtained the best fit value for U and Th as 4 and 5 events. It corresponds to 40 TW heat flow from Uranium and Thorium. But 0 to 110 TW is allowed at 95% C.L. and statistics is yet insufficient to claim an observation of geo-neutrinos.
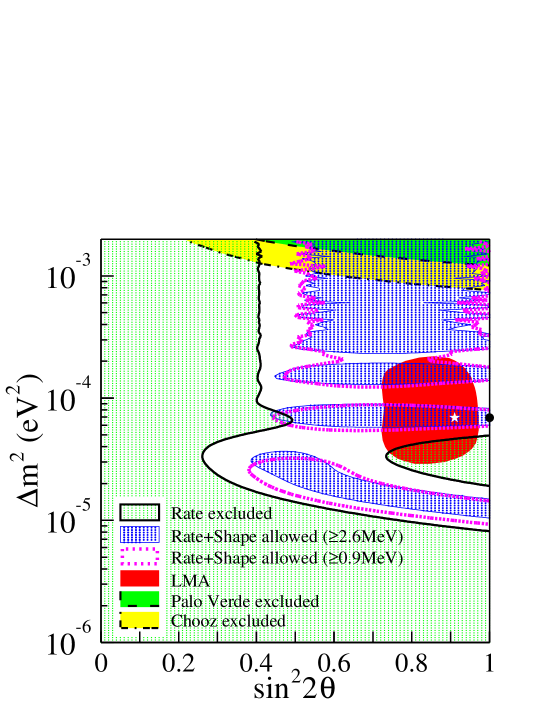
KamLAND results shrank the allowed region of oscillation parameters to two bands, LMA1 ( eV2) and LMA2 ( eV2). Chi-square of LMA2 is about 3 worse than that of LMA1 with current statistics. If LMA1 is the true answer, the LMA2 may be excluded in the next update in a year. In any cases, new Shika reactor starts in 2006 locates at a good distance to discriminate them. As shown in Fig. 1, Shika distance is close to the first minimum of the LMA1 and the LMA2 has the second maximum at the distance. Comparison before and after 2006 will give good separation of these two solutions.
Our current efforts are focused on the purification of the LS aiming at observing 7Be solar neutrinos with neutrino-electron scattering. It will make a next milestone in the ”Neutrino Astrophysics” and also by combining with charged current observations, it will give a precise measurement of mixing angle.
6 Summary
KamLAND observed an evidence of reactor neutrino disappearance at 180 km baseline. Only the LMA solution is compatible with this disappearance and the long standing solar neutrino problem is finally solved with a combination of KamLAND and solar neutrino observations. KamLAND will give a precise value of and the mixing angle with reactor and solar 7Be solar neutrino observations. Current hint of the geo-neutrino flux will soon become first observation of geo-neutrinos.
This manuscript is based on the paper and the KamLAND experiment is successfully operated and performed by efforts of the KamLAND collaboration from Japan, United States and China.
References
References
- [1] SNO collaboration, Phys. Rev. Lett. 89 (2002) 011301.
- [2] Super-Kamiokande collaboration, Phys. Rev. Lett. 81 (1998) 1562-1567.
- [3] C.S.Lim and W.J.Marciano, Phys. Rev. D 37(1988)1368, E.Kh.Akhmedov, Phys. Lett. B213 (1988) 64; Sov. Phys. JETP 68 (1989) 690, J.Barranco et al., Phys. Rev. D66 (2002) 093009.
- [4] Z.Berezhiani et al.,JETP Lett. 55 (1992) 371; R.S.Raghavan et al., Phys. Rev. D 38 (1988) 1317; J.F.Beacom and N.F.Bell, Phys. Rev. D65 (2002) 113009.
- [5] V.I.Kopeikin et al., Physics of Atomic Nuclei 64-5 (2001) 849-854.
- [6] 235U : K.Schreckenbach et al., Phys. Lett. B160 (1985) 325; 239,241Pu : A.A.Hahn et al., Phys. Lett. B218 (1989) 365; 238U: P.Vogel et al., Phys. Rev. C24 (1981) 1543.
- [7] P.Vogel and J.F.Beacom, Phys. Rev. D60 (1999) 053003; A.Kurylov, M.J.Ramsey-Musolf and P.Vogel, Phys. Rev. C67 (2003) 035502.
- [8] G.L.Fogli et al., Phys. Rev. D66 (2002) 053010.
- [9] KamLAND collaboration, Phys. Rev. Lett. 90 (2003) 021802.