Prediction of neutrino fluxes in the NOMAD experiment
Abstract
The method developed for the calculation of the flux and composition of the West Area Neutrino Beam used by NOMAD in its search for neutrino oscillations is described. The calculation is based on particle production rates computed using a recent version of FLUKA and modified to take into account the cross sections measured by the SPY and NA20 experiments. These particles are propagated through the beam line taking into account the material and magnetic fields they traverse. The neutrinos produced through their decays are tracked to the NOMAD detector. The fluxes of the four neutrino flavours at NOMAD are predicted with an uncertainty of about 8% for and , 10% for , and 12% for . The energy-dependent uncertainty achieved on the prediction needed for a oscillation search ranges from 4% to 7%, whereas the overall normalization uncertainty on this ratio is 4.2%.
keywords:
Neutrino fluxes , neutrino beamPACS:
14.60.Lm , 29.27.-a , 14.60.PqNOMAD Collaboration
, , , , , , , , , , , , , , , , , , , , , , ††thanks: Deceased , , , , , , , , , , , , , , , , , , , , , , , , , , , , , , , , , , , , , , , , , , , , , , , , , , , , , , , , , , , , , , , , , , , , , , , , , , , , , , , , , , , , , , , , , , , , , , , , , , , , , , , , , , , , , , , , , , , , , , , , ,
1 Introduction
The NOMAD experiment [1, 2] is searching for and oscillations in a predominantly beam at CERN. Oscillations between and would be evidenced by a distortion of the energy distribution of the intrinsic component of the beam. The search requires the understanding of the major component, , of the beam in order to interpret any potential oscillation signal, and of the minor components of the beam in order to calculate reliably various backgrounds. Thus it is imperative to understand the composition of the beam. In addition, to search for oscillations, a prediction of a ratio and the understanding of its systematic uncertainty is crucial.
The beam was produced through the decay of mesons originating in the interaction of protons with a beryllium target. This paper describes one of the two methods used to predict the neutrino flux at NOMAD and the performance of the beam. One of the most critical ingredients in the simulation program used to describe the beam is the set of particle production cross sections assumed in the initial p-Be interaction. Given the paucity of data on these cross sections, a dedicated experiment [3], referred to as SPY, in which some members of the NOMAD collaboration participated, was performed at the CERN 450 GeV proton synchrotron (SPS). It measured charged particle yields in the relevant energy and angular regions.
Two distinct methods were then used to predict secondary particle production as input to the simulation. The first used particle yields from a recent version of FLUKA [4] suitably corrected to take into account the SPY results, and is described in this paper. The second, referred to as the Empirical Parameterization (EP) method, was used to predict the flux. It used the NOMAD , and flux data to estimate the , and production rates at the target and thus predict the rate. It also used the SPY data to constrain the low energy rates as well as a measurement by Skubic et al. [5] to constrain the contribution. The EP method will be described in a forthcoming publication.
This publication is structured as follows. Section 2 describes the neutrino beam hardware, Section 3 its monitoring and alignment, Section 4 the particle production measurements used, Section 5 the simulation, Section 6 the beam composition, and Section 7 the systematic uncertainties. Section 8 briefly describes the NOMAD apparatus and running conditions, Section 9 compares the results of our simulations with the data collected in NOMAD, Section 10 presents the final predictions, and Section 11 draws some conclusions.
2 Beam description
The neutrino beam is produced by extracting part of the 450 GeV proton beam circulating in the SPS and letting it interact with a beryllium target. Positively charged particles (mainly and mesons) produced around zero degrees with respect to the primary proton beam are focused into a near parallel beam by a system of magnetic lenses and subsequently decay producing neutrinos. A large iron and earth shield placed at the end of the decay volume filters out particles other than neutrinos and is followed by the detectors, CHORUS [6] and NOMAD.
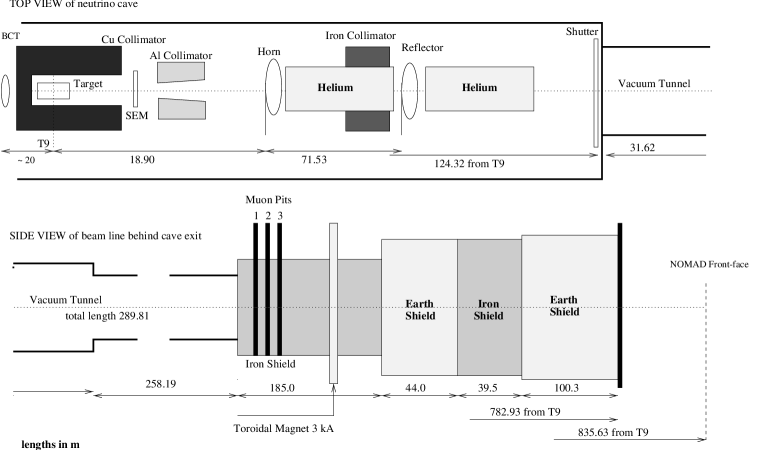
The general layout of the beam line, referred to as the West Area Neutrino Facility (WANF), is illustrated in Fig. 1. The beam line operated for more than 20 years and was re-optimized [7] in 1992 and 1993 for the NOMAD and CHORUS experiments.
2.1 The proton beam
During the lifetime of the CHORUS and NOMAD experiments the SPS accelerated up to protons per 14.4 s cycle. The protons used to produce neutrinos were ejected from the SPS through resonant extraction in two spills, one towards the end of the accelerating ramp at 445 GeV and the second, 2.7 s later, at the end of the 450 GeV flat top. Each of these two spills had a full width at half maximum of 3 ms and contained about protons. The length of the spill was dictated by the requirement to keep the detector live time above 90% while remaining compatible with the maximum possible duration of the current pulses in the focusing magnets (Section 2.4).
2.2 The target
The target consisted of 11 beryllium rods separated by 90 mm, each 3 mm in diameter and 100 mm long. The rods were supported by beryllium disks and enclosed in an aluminium target box. Gaseous helium under pressure was directed at each rod for cooling purposes. The entrance and exit windows of the box consisted of 60 mm diameter titanium foils each 0.1 mm thick. Each of the two extremities of the box could be displaced laterally by mm for alignment purposes. The target box was surrounded by iron and marble shielding slabs and along the beam direction by collimators.
The target amounted to 2.7 nuclear interaction lengths resulting in only 6.7% of the protons not undergoing inelastic interactions in it. Since the SPS is installed in an underground tunnel and the detectors were located on the surface, the primary proton beam pointed upwards at an angle of 42 mrad and the target box was located in an underground area at a depth of 35 m.
2.3 The collimators
The target was immediately followed by a copper collimator 1.20 m long with an 85 mm cylindrical bore, followed by an aluminium collimator, 2.75 m long starting 3.55 m from the centre of the target. The aluminium collimator defined an average angular acceptance of 10 mrad for secondaries produced at the target. Both collimators were water cooled.
2.4 The magnetic horn and reflector
Two toroidal magnetic lenses, referred to as the horn and the reflector, focused charged particles of a given sign (positive for a predominantly beam) produced at the target into a near parallel beam while defocusing the particles of the opposite charge. The principle of the focusing is illustrated in Fig. 2. The reflector provided additional focusing for high momentum particles and compensated for overfocusing of low momentum particles by the horn. The magnetic field was provided by current sheets flowing in the inner and outer conductors of the lenses. The field was measured to be azimuthally symmetric to better than 1.5%. Its value at a radial position from the beam axis and for a current is given by
| (1) |
The current (100 kA for the horn and 120 kA for the reflector) was provided by the discharge of capacitor banks and lasted 6.8 ms. The thickness of the inner conductors was minimized to reduce secondary interactions while maintaining adequate strength to withstand the magnetic forces. Both elements were made of aluminium alloys of various tensile strengths.

The inner conductor of the 6.56 m long horn was approximately parabolical in shape. At its upstream end it had a diameter of 140 mm and a thickness of 1.7 mm while at the downstream end its diameter decreased to 8 mm and its thickness was therefore increased to 6.8 mm in order to withstand the mechanical stress caused by strong magnetic fields. The outer conductor consisted of a 420 mm diameter cylinder of 12 mm thickness. The conductors were built in sections joined together by flanges. The centring of the inner conductor was achieved with steel cables joining the inner and outer conductors through insulating spacers.
The 6.54 m long reflector had an inner conductor diameter of 416 mm decreasing to 196 mm, and an outer conductor of 776 mm diameter. The inner conductors of both elements were cooled by spraying water onto them from nozzles located at the top of the outer conductor.
The positions of the horn and of the reflector, 18.9 m and 90.4 m from the centre of the target, were chosen to provide a high energy neutrino spectrum best suited to the detection of charged current () interactions. An iron collimator placed between the horn and the reflector absorbed particles of the wrong charge swept away by the horn before their decay thus reducing the contamination of antineutrinos in the neutrino beam.
The polarity of these magnetic elements could be changed within minutes in order to produce an antineutrino beam.
2.5 The helium bags
Two helium bags were installed to reduce multiple scattering and secondary interactions along the beam: one, 63 m long, between the horn and the reflector and the other, 18 m long, between the reflector and the decay tunnel. Each bag was closed by 0.3 mm thick titanium windows. Replacing the air by these helium bags resulted in a 7% increase in the neutrino flux.
2.6 Ionization chambers
Two cylindrical ionization chambers, 840 mm and 60 mm in diameter, were added to the beam line before the 1996 and 1998 runs respectively. Their purpose was to measure the flux and profiles of secondary particles and of protons that did not interact in the target. The chambers were placed between the second helium bag and the entrance to the decay tunnel.
2.7 The decay tunnel
A 289.9 m long tunnel was provided to allow a significant fraction of the and to decay. This decay tunnel was evacuated to a pressure of 10 Torr. It consisted of a 31.6 m long section of 2.2 m diameter followed by a 258.3 m long section of 1.2 m diameter. The entrance window to the tunnel was made of 2 mm thick titanium.
The decay tunnel contained hardware that had only been used in earlier experiments to position an absorber in the tunnel in order to enhance the fraction of prompt neutrinos in the beam by reducing the number of neutrinos originating from long lived particles that decayed in the tunnel. This hardware was located near the outer radius of the decay tunnel, at its downstream end, and was not used during the CHORUS and NOMAD runs.
2.8 The hadron and muon filter
The very large flux of hadrons and muons emerging at the end of the decay tunnel had to be absorbed before the detectors. This was accomplished by a shield consisting of two iron filters, one 185 m long and the other 39.5 m long, separated by 44.0 m of earth and followed by an additional 100.3 m of earth. A 10 m long magnetized iron toroid with the field of 1 T was embedded in the front iron filter. It had a 2 m inner diameter and a 6 m outer diameter and its purpose was to deflect muons away from the beam direction.
3 Monitoring and alignment
The monitoring of the neutrino beam involved the measure of the proton intensity on target, the centring of the beam relative to the target, the width of the beam pulse and its timing relative to the horn current pulse. All the elements of the neutrino beam line were aligned with respect to the incident proton beam before the start of data taking in the CHORUS and NOMAD experiments.
3.1 Monitoring of the incident proton beam
The proton flux was measured with two beam current transformers, one located immediately after the extraction from the SPS and the other before the target. A secondary emission monitor (SEM) placed just upstream of the target also yielded a measure of the proton intensity.
The alignment of the beam with respect to the target was checked by measuring the ratio of pulse heights in two SEM’s, one downstream of the target and one upstream [8]. This ratio, referred to as the multiplicity, decreased if the beam was not centred because of fewer secondary particles being produced and reaching the downstream SEM. The centring and width of the beam on target was also checked periodically with a horizontal and a vertical beam scanner each consisting of a wire moved in steps across the beam just in front of the target from mm to mm. The measured profiles (Fig. 3) were used as input to the simulation program. Their typical full width at half maximum was 1.7 mm in and 1.0 mm in . The beam was well contained within the 3 mm diameter target and only 5.2% of the protons missed it.

Further checks were provided by secondary emission monitors consisting of foils split in two halves either in the vertical or in the horizontal direction and placed just beyond the target. Equality of the secondary particle flux in the left, right halves and in the up, down halves ensured centring of the beam.
A visual oscilloscope display provided a monitoring of the width of the beam spill and of its correct timing relative to the horn and reflector pulses. Furthermore, a narrowing of the beam pulse resulted in an increased experimental dead time and generated an alarm.
3.2 Monitoring of the muon flux
An overall measure of the stability of the neutrino flux intensity and direction as well as of the performance of the horn and reflector was provided by studying the accompanying muon flux. The muon flux was monitored by 3 planes (V1, V2 and V3) of solid state diodes (SSD) positioned within the first iron filter in pits located after 10.4 m, 30.8 m and 50.8 m of iron [9]. Planes V1, V2 and V3 consisted respectively of 19, 14 and 10 SSD’s fixed in positions such as to sample the radial and azimuthal distributions of the muon flux. In each plane a movable calibration box containing 5 additional counters provided an inter-counter calibration. A reference box could be moved from pit to pit for inter-plane calibration. The charge deposited in each SSD was recorded for each spill, thus providing an on-line measure of the stability of the muon, and therefore of the neutrino, flux as well as of its direction.
3.3 Alignment
The goal of the alignment exercise [10] was to maximize the neutrino flux and centre it as well as possible using as control the various beam monitors available in the beam line and at the experiments.
First the target was moved transversely to the beam in the vertical and horizontal directions, while keeping its length parallel to the beam. The optimal position was defined as the one yielding the largest multiplicity as defined in Section 3.1. Movements of 2.8 mm horizontally and 0.3 mm vertically were necessary. The tilt of the target relative to the beam was also checked but was found to be correct.
The position of the horn relative to the beam and target was then optimized by searching for the maximum value and best centring of the muon flux in the 3 pits. This was obtained for a relative displacement of 4.5 mm and 5.0 mm in the horizontal and vertical direction respectively, resulting in a 3% increase of the muon flux and in a better centring of its spatial distribution by a few centimeters.
This optimization was also checked by analyzing neutrino events in CHORUS and NOMAD. Shifts in the spatial distributions of events of about 10 cm were observed after optimization, resulting in the event distributions being in better agreement with those of events simulated with an ideal alignment. An 8% increase in the event rate also resulted from this optimization [10].
4 Particle production measurements
One of the most important ingredients in the calculation of the neutrino flux and energy spectra presented in this paper were the results of two measurements of the production rates of charged particles in p-Be interactions. These measurements were performed by the NA20 and the NA56/SPY collaborations and covered complementary ranges of secondary particle momenta, from 60 GeV/ to 300 GeV/ and from 7 GeV/ to 135 GeV/, respectively.
4.1 The NA20 experiment
The NA20 particle production experiment [11] was performed in the North Area of the CERN SPS using a 400 GeV/ proton beam incident on a variety of beryllium targets. The relevant one for this analysis was a plate 100 mm thick, 160 mm wide and 2 mm high. Bending magnets and collimators downstream of the target selected secondary particles produced with the appropriate production angle, momentum and charge. Differential Čerenkov counters (CEDARS) identified , and protons. Production rates of charged secondary particles produced with momentum of 60, 120, 200 and 300 GeV/ were measured for two values of their transverse momentum, 0.0 and 0.5 GeV/. At 120 GeV/ the rates were also measured for a transverse momentum of 0.3 GeV/. The detailed results on the particle production rates, on the ratios and on the statistical and systematic uncertainties of these measurements are given in Ref. [11], where they are expressed as “yields”. The yield is , where is the number of observed particles per incident proton. At high energy, is proportional to times the Lorentz-invariant cross section . In using the NA20 measurements, taken at 400 GeV/ incident momentum, for particle production predictions at 450 GeV/, we assume the Feynman scaling hypothesis, i.e., that the Lorentz-invariant cross section (expressed in terms of and the Feynman variable ) is the same at these two beam momenta . Then the prediction can be made at secondary particle momenta having the same at 450 GeV/ as that at 400 GeV/, if the yields are scaled up by (450/400)2.
4.2 The NA56/SPY experiment
The NA56/SPY particle production experiment [3] was similar to NA20 and was again performed in the North Area of the CERN SPS but using a 450 GeV/ proton beam. It also used a variety of beryllium targets but the relevant one for this analysis was identical to the one described for NA20, namely a plate 100 mm thick, 160 mm wide and 2 mm high. Bending magnets and collimators downstream of the target selected particles of the appropriate production angle, momentum and charge. Time-of-flight counters, and threshold and differential Čerenkov counters identified , and protons. A calorimeter separated electrons and muons from hadrons. Data were collected at 0∘ production angle at 7, 10, 15, 20, 30, 40, 67.5, and 135 GeV/ secondary particle momentum. In addition several production angles, ranging in transverse momentum from 0.0 to 0.6 GeV/, were measured at 15 and 40 GeV/. The detailed results on the particle production rates, on the ratios and on the statistical and systematic uncertainties of these measurements are given in Ref. [3].
5 Beam simulation
A full Monte Carlo simulation of the WANF beam line has been performed. It used the measured profiles and the calculated divergences of the proton beam incident on the beryllium target as input and was implemented in two main steps.
First, the yields of the secondary particles from p-Be interactions were calculated using FLUKA. FLUKA is a general purpose Monte Carlo package which contains, in particular, a detailed description of hadron-nucleon and hadron-nucleus interactions [12]. It is based on the Dual Parton Model [13] complemented by the simulation of nuclear reinteractions [14]. It has been successfully tested over a variety of experimental data [12]. A recent version of FLUKA [4], referred to as FLUKA 2000, was used (Section 5.1). The FLUKA 2000 yields were corrected to take into account the results of the SPY and NA20 measurements (Section 5.2). FLUKA 2000 was also used to transport the secondaries within the boundaries of the target box (Section 5.3).
At the second step, the secondaries were propagated up to the NOMAD detector (located 835 m from the target) using the NOMAD beam line simulation package, NUBEAM. It was based on GEANT 3.21 [15] and the 1992 version of FLUKA, GFLUKA, implemented within it [16]. It therefore included the effects of energy losses, multiple scattering, reinteractions and decays. The GFLUKA meson yields were corrected by the corresponding ratios between FLUKA 2000 and GFLUKA. In this Section we describe the crucial points of the NUBEAM package – the simulation of the magnetic field in the horn and reflector (Section 5.4), the simulation of the beam line hardware elements and the treatment of reinteractions (Section 5.5), and the simulation of meson decays (Section 5.6).
5.1 FLUKA in NOMAD
One of the most critical elements in the prediction of neutrino fluxes is the description of the yield of particles in p-Be interactions. In the approach used in this paper the yields were obtained from a complete Monte Carlo simulation based on the FLUKA generator modified to take into account available experimental data.
FLUKA 2000 was used to simulate the yield of secondary particles from the interactions of 450 GeV protons on the 100 mm thick Be target of SPY and NA20. The results of these simulations were compared to the two sets of particle production measurements described in Section 4. The comparison was carried out as a function of the secondary particle momentum, , and the production angle . It was found [19] that the yields of secondary and agree with the experimental data at the level of 20% or better with only a few exceptions, mostly for negative kaons or at large momenta; the comparison plots, of which Fig. 4 is an example, can be found in Ref. [19]. This level of agreement was considerably better than that obtained with the generators of hadronic interactions implemented within GEANT (such as GFLUKA or GHEISHA) and led us to choose FLUKA for the simulation of the primary p-Be interactions.

However, in order to increase further the accuracy of the Monte Carlo predictions, it was necessary to modify the FLUKA 2000 yields of secondary particles in order to take into account the SPY and NA20 results. The method used for this adjustment is described in the next section.
5.2 Corrections for SPY and NA20 results
Corrections were introduced by ascribing a weight to each secondary particle of a given type, , and , generated by FLUKA in the p-Be interaction. Ideally, the value of the weight would be obtained as the ratio between the measured rate and the rate predicted by FLUKA for each particle type and each and . In practice the amount of available data is limited, in particular for values of different from 0∘ (see Section 4). The weights were therefore calculated as a function of particle type and momentum only, averaging over production angles whenever possible. At 67.5 and 135 GeV/ measurements were available from both NA20 and SPY. At each momentum they were found to agree within the quoted errors and, therefore, the average of the two, weighted according to the statistical errors of the two measurements, was used.
For those values of for which angular measurements were performed (notably at 15 GeV/ and 40 GeV/), both the experimental and FLUKA yields of secondary particles were convoluted with the WANF angular acceptance functions and then integrated over all angles measured. The ratio of these two integrals was defined as the weight at a given . For the values of for which only the yields in the forward direction () were measured (mostly below 40 GeV/) the weights were simply the ratios of the measured to predicted yields at . This is justified by the fact that at these low momenta the dependence of the yield on the production angle is small below 10 mrad, the acceptance of the beam line (Fig. 4). These sets of weights, obtained at discrete momenta, were fitted to combinations of polynomial functions with systematic (see Section 7) and statistical errors of the measurements combined in quadrature and taken into account in the fits (see Fig. 5 as an example). The resulting reweighting functions were then applied on an event-by-event basis, to every , , proton and antiproton emerging from the target rod in which the primary interaction occurred.

The SPY experiment has measured the / ratios with a much smaller uncertainty than that of the separate measurements of the and yields, because of partial cancelations of systematic uncertainties when taking the ratio of yields measured under similar experimental conditions. As can be seen in Table 1, the / ratios in our simulations agree with the SPY and NA20 results within the quoted uncertainties. This can be considered as an additional test of the validity of our approach.
| (GeV/) | (mrad) | ||
|---|---|---|---|
| 15.0 | 0.0 | ||
| 5.0 | |||
| 10.0 | |||
| 20.0 | 0.0 | ||
| 30.0 | 0.0 | ||
| 40.0 | 0.0 | ||
| 1.9 | |||
| 3.8 | |||
| 5.6 | |||
| 11.3 | |||
| 67.5 | 0.0 | ||
| 7.4 | |||
| 135.0 | 0.0 | ||
| 2.2 | |||
| 3.7 |
Since no measurements of the and yields are available at these energies, they were estimated from the SPY measurements of and yields using the “quark-counting” method of Ref. [20]. This relation is:
| (2) |
where is the ratio of the u to d structure functions of the proton evaluated at , the ratio of the kaon energy in the centre of mass to its maximum possible energy at its . These estimates were then used to reweight the FLUKA 2000 yields.
Systematic uncertainties in the prediction of neutrino fluxes arising from this reweighting procedure are discussed in Section 7.
5.3 Transport and decays in the target region
Transport of the secondaries within the boundaries of the target box, including their possible decays and reinteractions in the target rods downstream of the primary interaction vertex and in the box walls, was handled by FLUKA 2000. The position and momentum vectors of all the particles emerging from the target box and reaching the upstream end of the copper collimator (115 cm from the centre of the target) were saved to a file; their transport, reinteractions and decays in the beam line downstream of the target were performed later by NUBEAM in a separate simulation run.
A small fraction of the overall neutrino flux is produced directly in the target region. It comes primarily from the prompt decays of charmed mesons as well as and decays (see Section 5.6).
5.4 Magnetic field
An accurate description of the magnetic field in the horn and the reflector is extremely important for the prediction of both the major component of the beam, , and its minor components, , and .

The magnetic field in the region between the two coaxial inner and outer conductors was simulated according to Eq. (1). The measurements of the magnetic field in a spare horn (identical to the one installed in the WANF) revealed no deviations from the expected behavior. The magnetic field in the inner conductors of the horn and reflector was also taken into account, with the current skin depth calculated using the Fourier transform of the horn pulses. The radial dependence of the magnetic field in the horn is shown in Fig. 6. The maximum value of the field (1.85 T for the horn and 0.24 T for the reflector) occurs at the downstream extremities of both focusing elements, at the outer surface of the inner conductor.
Transport of the particles in the magnetic field was performed with the Runge-Kutta method; special care was taken in optimizing the appropriate GEANT tracking medium parameters.

The effect of the horn and of the reflector on particles of different signs is illustrated in Figs. 7 and 8, which show angular distributions of positive and negative pions at a plane just upstream of the horn and immediately downstream of it. Upstream of the horn, pions of both charges emerging from the target have very similar angular distributions, with the bulk of the particles within 10 mrad, which is the acceptance of the collimators. While traversing the horn, positive pions with momentum around 50 GeV/ are focused into a near-parallel beam leading to an overall enhancement at small angles of up to a factor of 30 (Fig. 7). Negative pions are strongly defocused resulting in their reduction at small angles by as much as a factor of 5 (Fig. 8). The reflector provides an additional focusing for positive particles of momentum both higher and lower than 50 GeV/ that were respectively underfocused and overfocused by the horn.

Fig. 9 shows again angular distributions of and upstream and downstream of the horn but now only those that ultimately produce a reaching the NOMAD detector (and that give a ) are included. From the left-hand plots it can be seen that only mesons produced with angles smaller than mrad can produce neutrinos that traverse the NOMAD detector. The distribution of upstream of the horn has two distinct regions: the first, at small angles, is mainly populated by high-energy (and hence very forward) pions; the second, at larger angles, – by low- and medium-energy (up to about 100 GeV) pions. The focusing effect of the horn on (and ) in the first region is modest; however, it is crucial for the particles in the second region: their deflection is such (Fig. 9, top right) that they enter the decay tunnel and contribute to the flux at NOMAD. The minor component, , of the neutrino flux comes from the decays of very forward and that could not be defocused (Fig. 9, bottom). Another important source of ’s are interactions in the horn and in material further downstream, which are discussed in the next section.

Overall, the WANF horn–reflector system provides more than a factor of four increase in the flux at the NOMAD detector in the relevant energy range (between 2 and 200 GeV); the admixture of in the beam is at the same time reduced from 70% to less than 7%. The reflector provides an increase of about 25% in the flux compared with the horn-only case.
5.5 Secondary interactions
Reinteractions of secondary particles in the beam line hardware elements situated downstream of the target affect the neutrino fluxes. Their impact on antineutrino components of the beam is particularly large since the mesons of the “wrong” sign produced in the secondary interactions downstream of the focusing elements are not defocused and some of them then decay in the decay tunnel. A fraction of primary protons, which either did not interact in the target or missed it geometrically, also interacts in the material downstream of the target resulting in yet another contribution to neutrino fluxes. Therefore, an accurate description of the beam line hardware and of the particle yields from interactions downstream of the target is essential.
A detailed simulation of all the elements constituting the WANF beam line (described in Section 2) was performed. The NUBEAM description of the horn and the reflector included the insulating spacers, flanges, conductor plates and water cooling hardware. Special attention was paid to the simulation of the downstream (and closest to the beam axis) part of the horn inner conductor, the neck, since it is traversed by the large flux of very forward particles, including primary protons. Cables, screws, bolts and nuts were approximated by disks of iron of appropriate thickness. The titanium windows of the helium bags, as well as the surrounding pipe and flanges, were included. All measuring devices installed in the line (ionization chambers and SEM’s) were also simulated. Finally, the entrance window of the decay tunnel, a system of support rings, the tunnel walls and the hardware contained in the tunnel were also included in the simulation.
In the GEANT3 framework, the most suitable model for the simulation of particle yields from the secondary hadronic interactions is GFLUKA. However, the FLUKA package has undergone significant improvements [17] since the time when its 1992 version was implemented into GEANT. In NUBEAM, these improvements were taken into account by correcting the GFLUKA meson yields by the corresponding differences between FLUKA 2000 and GFLUKA. Since it was not possible to implement FLUKA 2000 in GEANT3 and therefore in NUBEAM, special simulation runs were performed in which the beam line material downstream of the target was replaced by a 0.5 interaction length slab of aluminium placed at the position of the neck of the horn. The thickness of the slab corresponded to the average amount of material traversed by secondary particles contributing neutrinos at NOMAD and the position of the slab to the most likely reinteraction point along the beam line. Two such special runs were performed, one with GFLUKA in GEANT3 and one with FLUKA 2000, both runs using as input the same set of particles, which had the composition, momentum and angular distributions of the ones produced in the simulation of p-Be interactions.
The comparison showed that the yields of tertiary and in FLUKA 2000 were smaller by about 30% at all energies, whereas those of , and were larger by up to 30% at energies below 30 GeV; these differences had only a very weak dependence on the production angle. The corrections obtained were applied on an event-by-event basis in the standard NUBEAM runs, as energy-dependent weights to ’s and ’s produced in secondary interactions. Their net effect was a reduction of about 10% in the flux at energies below 15 GeV, and an increase of % in the and fluxes (and in the ratio) in the same low energy region.

The effect of the interactions of the incident protons, which either did not interact in the target or missed it geometrically, in the hardware downstream of the target on the neutrino flux at NOMAD is illustrated in Fig. 10, which shows the NUBEAM prediction of the position of the interaction of the primary protons along the beam line; only events resulting in a neutrino reaching the NOMAD detector are included. About 3% of both the ’s and the ’s at NOMAD were found to originate from proton interactions downstream of the target – mainly in the narrowest part of the horn. The corresponding contribution is larger for the flux: about 15% of the ’s result from proton interactions downstream of the target. The reason is that the negatively charged mesons produced in the neck of the horn or further downstream are not (or only weakly) defocused and have a larger probability of entering the decay tunnel compared with the “wrong” sign mesons produced in the Be target.

Since the “parents” of neutrinos reaching NOMAD traverse an amount of material equivalent, on average, to about half an interaction length, reinteractions play an important role in the production of the neutrino beam. Secondary interactions resulting in neutrinos reaching NOMAD occur mainly in the horn, the collimators and the reflector (Fig. 11). Overall, secondary interactions in the material downstream of the target produce about 10% of ’s, 12% of ’s and 45% of ’s at NOMAD. The energy spectrum of these neutrinos is significantly softer than the one of neutrinos produced in the decays of mesons which did not experience secondary interactions: the average energies of these two components of the flux are, respectively, 16.7 GeV and 25.2 GeV for and 19.4 GeV and 39.6 GeV for . Since a oscillation signal would manifest itself as an excess of events at low energies, an accurate description of the material downstream of the target was crucial to the oscillation search.
5.6 Decays
High energy neutrinos are produced in two- and three-body decays in flight of mainly , , , and charmed mesons. In the default GEANT3, all decays are treated according to pure phase-space. We modified the GEANT version used in NUBEAM to treat semileptonic and decays taking into account the V–A structure of the weak leptonic current and the form factors [18]. Pure V–A muon decays were simulated assuming that the muon (produced mainly in pion decays) is fully polarized. Charmed mesons and strange baryons were added to the GEANT particle list, with their relevant decay modes and branching ratios defined according to Ref. [18]. The charmed particles were mainly produced at the beryllium target and at the hadron filter; their production cross section in p-Be interactions was taken to be 0.45 mb [4]. The contribution from this source to neutrinos at NOMAD was small: 3.2% for , 0.6% for , 0.1% for and negligible for .
In order to generate a sufficient number of neutrino events in a reasonable time, the decay of each particle with a neutrino among its decay products was repeated 100 times; each time the decay mode was randomly chosen according to the branching ratios and the kinematics of the decay generated anew. It was shown that this procedure does not lead to any significant bias once the total number of generated events is large; the effect of this procedure on statistical errors of Monte Carlo distributions was also studied and appropriately taken into account.
6 Beam composition
The spectra of the four principal neutrino species, , , and , and of their components, predicted by the simulation described above, are shown in Fig. 12. The average energies and the relative abundances of the four neutrino species, as well as the relative contributions to the neutrino fluxes from , and other sources and their average energies, are listed in Table 2. We can summarize them as follows:

| Source | ||||||||||
|---|---|---|---|---|---|---|---|---|---|---|
| Flux | or | or | or | |||||||
| species | Abund. | % | % | % | % | |||||
| 1.0 | 24.3 | 90.4 | 19.1 | 9.5 | 73.0 | 0.1 | 26.8 | 0.1 | 11.4 | |
| 0.0678 | 17.2 | 84.0 | 13.8 | 12.8 | 38.1 | 1.9 | 26.9 | 1.2 | 17.0 | |
| 0.0102 | 36.4 | – | – | 68.0 | 41.8 | 17.8 | 30.3 | 13.6 | 16.8 | |
| 0.0027 | 27.6 | – | – | 25.1 | 22.8 | 68.2 | 30.4 | 3.5 | 11.1 | |
-
•
The neutrinos are primarily produced via two-body decays of (90.4% of ) and (9.5%), with much smaller contributions from other sources (, , charmed hadrons, etc.). Neutrinos from pion decays dominate the spectrum up to GeV, whereas those from decays dominate beyond this energy.
-
•
Similar to , the neutrinos are primarily produced via decays of (84.0% of ) and (12.8%). Compared to , a larger fraction of comes from , , and charmed hadron decays since these particles are not affected by the defocusing of the horn and reflector. The ratio being smaller than the ratio, the from only start to dominate the spectrum at about 70 GeV. The flux is 6.8% that of the .
-
•
Four decays contribute to the flux. The main contribution is from (68.0% of ), followed by the (17.8%), muon decays (13.6%) and charmed hadron and hyperon decays (0.6%). The flux relative to in the absence of oscillations is expected to be about 1.0% when integrated over all energies and 0.5% below 20 GeV.
-
•
The principal source of is the decay, accounting for about 68% of . The other sources of are: (%), charmed hadron decays (3.2%), and a small contribution from . The flux relative to is about 0.3%.
7 Systematic uncertainties
As explained in Section 5, neutrinos in the beam originate from the decay of mesons produced through four different mechanisms: proton-Be interactions in the target, proton interactions downstream of the target in material other than beryllium, reinteractions of particles in the target and reinteractions of particles downstream of the target. The systematic uncertainties on the yields of particles from proton-Be interactions in the target are described in Section 7.1. The uncertainties arising from the yields of particles in interactions other than proton-Be are described in Section 7.2. Other sources of systematic uncertainties, such as those arising from the position of the beam relative to the target and from the propagation of secondary mesons through the WANF beam line, are described in Section 7.3. The summary of uncertainties is given in Section 7.4.
7.1 Uncertainty on the yields of particles from p-Be interactions
The main source of the systematic uncertainties in the prediction of the ratio was due to the uncertainty on the yields of secondary particles from p-Be interactions. This was estimated in two steps. First the overall relative systematic uncertainty, , on the reweighting function of each particle type yielding neutrinos was estimated. This uncertainty was particle type and momentum dependent. Then, the effect of on each neutrino species and on the ratio was computed.
The first step in the calculation of was to identify the systematic uncertainties of SPY and NA20 that did not cancel in the ratio, namely those due to the particle selection efficiency and identification, the particle-dependent losses along the spectrometer, the particle decays, and the stability of the intensity of the proton beam and of its position relative to the target. The ones that did cancel amounted to 1.8% and were removed from the published SPY and NA20 systematic uncertainties. The systematic uncertainties were combined in quadrature with the statistical uncertainties of the measurements. The relative error on the reweighting function arising from this source is referred to as .
The uncertainty arising from using a single, angle-independent, correction for each momentum and particle type, , was estimated as follows. For those values of momentum for which angular scans were available, the uncertainty was estimated as the root mean square deviation between the individual angular measurements available at that and the results of a single-valued reweighting obtained from these measurements as described in Section 5.2. For values of at which only the 0∘ angle was measured, mostly below 40 GeV/, the uncertainty was taken to be the difference between the 0∘ point and the single-valued reweighting at the angular scan nearest in momentum. This is justified by the fact that, as was noted in Section 5.2, at these low momenta the dependence of the yield on the production angle is small below 10 mrad. For each momentum and particle type, and were combined in quadrature, to give , the error used in the fits described in Section 5.2. As an example the values of , and for are given in Table 3.
| (GeV/) | 7 | 10 | 15 | 20 | 30 | 40 | 67.5 | 135 | 225 |
|---|---|---|---|---|---|---|---|---|---|
| 0.010 | 0.010 | 0.003 | 0.003 | 0.005 | 0.003 | 0.004 | 0.004 | 0.005 | |
| 0.096 | 0.079 | 0.098 | 0.078 | 0.057 | 0.046 | 0.051 | 0.062 | 0.065 | |
| 0.007 | 0.007 | 0.004 | 0.007 | 0.014 | 0.020 | 0.089 | 0.056 | 0.091 | |
| 0.097 | 0.080 | 0.098 | 0.078 | 0.059 | 0.050 | 0.103 | 0.084 | 0.112 |
The systematic uncertainty on the neutrino flux predictions at NOMAD arising from and from the use of a fit to interpolate between the discrete experimental measurements of SPY and NA20 was then evaluated as follows:
-
•
The distributions of neutrinos at NOMAD were generated using NUBEAM and the values of the reweighting functions obtained using the fits as described in Section 5.2.
-
•
These neutrinos were separated into classes defined by the species of the neutrino and by the type of its parent particle emerging from the target rod in which the primary interaction occurred. For each such class a fine-binned two-dimensional histogram of the parent particle momentum versus the neutrino energy was filled.
-
•
Three thousand “simulated experiments” were then performed. Each such experiment consisted of the following steps:
-
–
The discrete values of the weights were modified at random about their central values according to Gaussians with as standard deviations and the fits repeated. This resulted in a new particle production prediction for , , protons and antiprotons.
-
–
The normalizations of the and fits were further modified at random according to a Gaussian of 1.2% width to take into account the uncertainty in the branching ratio [18].
-
–
The and predictions were also recalculated by using the new and predictions into the quark-counting formula (2) together with an additional uncertainty generated at random according to a Gaussian with a standard deviation of 15% (the uncertainty in the accuracy of the formula).
-
–
The content of each bin of the two-dimensional class histograms was modified by the ratio of the new fit to the central fit evaluated for the parent particle type and at the momentum of that bin.
-
–
By summing the class histogram bins over the parent particle momentum and type, a new energy-dependent flux prediction at NOMAD was obtained for each neutrino species.
-
–
In order to separate the uncertainty into an energy-dependent uncertainty and a normalization uncertainty, the new integral flux of each neutrino species was compared to the integral flux obtained with the central fit. The ratio of these two integrals, , was used to renormalize the integral flux of the simulated experiment to that of the central fit.
-
–
Finally, the energy-dependent prediction of the flux ratio was also obtained, as well as the ratio, , of the and normalization factors.
-
–
-
•
Repeating the simulated experiment 3000 times resulted in:
-
1.
an envelope of predictions for each neutrino species and for the ratio from which the energy-dependent systematic uncertainty, , was extracted. At any energy it was taken as the r.m.s. width of the envelope at that energy. Representative values of are listed in Table 4.
-
2.
the distributions of the 3000 values of for each neutrino species and for . They are shown in Fig. 13. Their standard deviations, 0.029 for , 0.017 for , 0.035 for , 0.060 for and 0.036 for , were used as the normalization uncertainty for each species and for the ratio. Note that due to correlations between the origins of and fluxes, the uncertainty on the ratio is smaller than would be expected from the uncertainties on the individual and fluxes. The standard deviation is smaller for than for because this uncertainty only refers to and originating from mesons produced directly in the target and, as explained in Section 5.5, the fraction of at NOMAD from this source is smaller than the corresponding one from .
-
1.
| (GeV) | 10 | 30 | 50 | 70 | 100 | 130 |
|---|---|---|---|---|---|---|
| 0.017 | 0.016 | 0.028 | 0.038 | 0.055 | 0.065 | |
| 0.007 | 0.007 | 0.015 | 0.018 | 0.027 | 0.036 | |
| 0.021 | 0.011 | 0.016 | 0.025 | 0.050 | 0.080 | |
| 0.030 | 0.011 | 0.022 | 0.031 | 0.040 | 0.055 | |
| 0.025 | 0.020 | 0.030 | 0.038 | 0.057 | 0.065 |
The small contribution to the systematic uncertainty arising from the yields of particles other than pions, kaons, protons and antiprotons (referred to as “others”) – which included, among other things, the contribution from a conservative uncertainty of 50% assigned to the production cross section of charmed mesons – was also subdivided into a normalization and an energy-dependent component. They were combined in quadrature with the standard deviations of (and ) and with , respectively. Finally, the common systematic uncertainty of 1.8% that had been removed from the SPY and NA20 results was recombined in quadrature with the normalization uncertainties of the individual neutrino flavours resulting in the normalization uncertainties from the yields of secondary particles from the beryllium target shown in the first line of Table 5.

| Source of uncertainty | |||||
|---|---|---|---|---|---|
| Yields of secondary particles | 0.034 | 0.029 | 0.039 | 0.064 | 0.036 |
| Proton interaction downstream of target | 0.002 | 0.024 | 0.003 | 0.013 | 0.003 |
| Reinteractions of secondary particles | 0.014 | 0.070 | 0.017 | 0.067 | 0.018 |
| Beam position and divergence | 0.056 | 0.021 | 0.058 | 0.035 | 0.002 |
| Horn current | 0.004 | 0.004 | 0.001 | 0.001 | 0.005 |
| Field in inner conductor | 0.004 | 0.026 | 0.011 | 0.016 | 0.007 |
| Amount of material | 0.012 | 0.022 | 0.007 | 0.012 | 0.005 |
| Horn misalignment | 0.002 | 0.006 | 0.007 | 0.012 | 0.005 |
| Collimator misalignment | 0.003 | 0.020 | 0.008 | 0.013 | 0.005 |
| Total | 0.068 | 0.091 | 0.074 | 0.103 | 0.042 |
In order to check the effect of the functional form used in the fits to the SPY/NA20 points, different order polynomials were tried. The resulting envelope of 3000 simulated experiments was essentially the same as the original one and therefore no additional uncertainty was assigned from this source.
7.2 Systematic uncertainties from the yields of particles in interactions other than p-Be
As described in Section 5, the interactions of protons downstream of the target, the reinteractions of particles downstream of the target and the reinteractions of particles in the target were treated by FLUKA 2000, in the first two cases by correcting the GFLUKA estimates by the ratio between FLUKA 2000 and GFLUKA and in the third case by treating them directly with FLUKA 2000. The yields of mesons from these three sources could not be corrected by the reweighting factors obtained from the SPY and NA20 measurements since these experiments did not measure proton interactions in materials other than beryllium nor interactions of particles other than protons. However the reweighting factors discussed in Section 5.2 were used to estimate the uncertainty on the neutrino fluxes from these three sources as explained below.
For each produced meson type two quantities were defined on the basis of the reweighting factors shown in Fig. 5. was the maximum deviation from unity of the reweighting factor between 20 and 100 GeV/ and was the average deviation from unity in the same momentum range. was 10.0%, 15.0%, 17.0%, 27.0%, 26.6% and 15.0% for , , , , and “others”, respectively. The corresponding values for were 5.8%, 4.0%, 15.3%, 26.5%, 22.6% and 10.0%.
-
•
Proton interactions downstream of the beryllium target. The momentum spectrum of each meson type resulting from these interactions was modified by for this meson type. The effect of this modification on the integral flux of each neutrino flavour was calculated. The effects from all meson types were added in quadrature and were included as a normalization error on each neutrino flavour and on the ratio (line 2 of Table 5). Since these neutrinos affected the overall neutrino spectra similarly at all energies, the error was included wholly as a normalization error.
-
•
Reinteractions in the beryllium target and downstream of the target. These two sources were treated separately but their errors were added linearly since they are correlated. The contributions of these sources to the overall neutrino fluxes are very energy dependent and therefore the uncertainties were split into a normalization and an energy-dependent part. The normalization uncertainty was calculated in the same way as for proton interactions downstream of the target and is shown in line 3 of Table 5. For the energy-dependent part, was subtracted in quadrature from , yielding , resulting in values of of 8.1%, 14.5%, 7.4%, 5.2%, 14.0% and 11.2% for , , , , and “others”, respectively. The momentum spectrum of each meson type resulting from these reinteractions was then modified by and the effect of this modification was propagated to the energy spectrum of each neutrino flavour and to the ratio. The effect of all meson types on each neutrino flavour and on the ratio were combined in quadrature and were included as an energy-dependent uncertainty.
7.3 Systematic uncertainties: other sources
-
•
Position and angular divergence of the proton beam. The uncertainty in the position of the beam relative to the target (measured by the beam scanner described in Section 3.1) was mm. The effect of this uncertainty on the normalization uncertainties (listed in line 4 of Table 5) amounted to 5.6% on and 5.8% on . It also produced an energy-dependent error of up to 2.3% on the ratio. The effect of the uncertainty on the angular divergence of the beam on neutrino fluxes was found to be negligible.
All subsequent uncertainties were included as normalization uncertainties.
-
•
Magnetic field in the horn and the reflector. The effect of the uncertainty in the magnetic field of the focusing elements on neutrino fluxes was studied by varying the nominal current value used in the simulation by %, the tolerance limit of the on-line control system, and noting the corresponding changes in the neutrino fluxes at NOMAD. These changes were 0.4% for , 0.1% for and 0.5% for . We also studied the effect of the uncertainties in the knowledge of the magnetic field inside the inner conductor of the horn; the numbers obtained were 0.4% for , 1.1% for and 0.7% for .
-
•
Inaccuracies in the simulation of the beam line elements. The size of these inaccuracies was estimated by studying the differences between the measured and predicted spectra of and events, which are the most sensitive to the secondary interactions in the beam elements (see Section 5.5). We found that the amount of material possibly missing in the simulation of the beam line does not exceed the equivalent of a slab of aluminium 1 cm thick, located downstream of the focusing elements. Increasing the amount of material in the beam line by this amount in the Monte Carlo simulation changed the expected flux by 1.2%, the flux by 0.7%, and the ratio by 0.5%.
-
•
Misalignment of the beam line elements. We have studied the effects of possible misalignments of the horn and of the aluminium collimator. The upper limits on the misalignment of the horn, 1 mm in the horizontal and 1 mm in the vertical direction, were obtained by comparing the measured spatial distribution of events with the results of several Monte Carlo simulations for various horn displacements with respect to its ideal position. The effect of this uncertainty on neutrino fluxes was 0.2% for , 0.7% for and 0.5% for . The uncertainty in the collimator position (3 mm in both horizontal and vertical directions) gave rise to a 0.3% uncertainty in the flux, 0.8% in the flux and 0.5% in the ratio.
7.4 Summary of systematic uncertainties
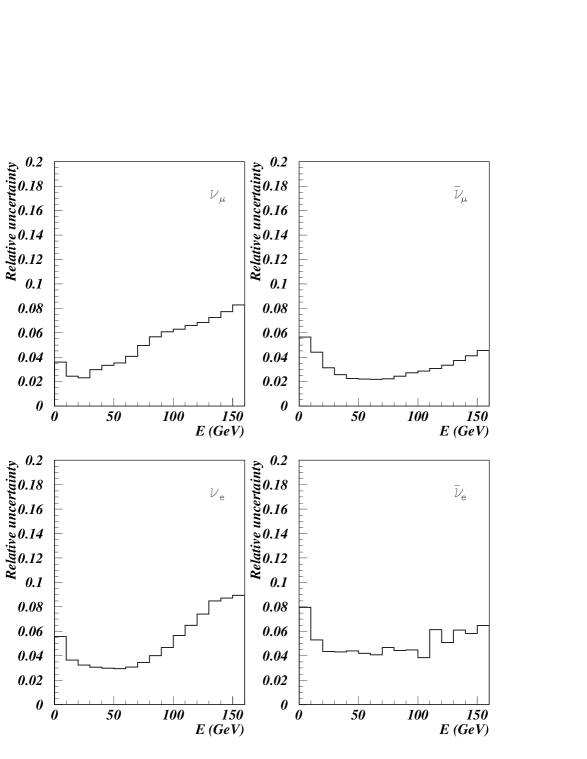
The overall energy-dependent uncertainties are shown in Fig. 14 for the four neutrino species and in Fig. 15 for the ratio. The normalization systematic uncertainties are summarized in Table 5.

It should be noted that the normalization uncertainties of the and components of the beam could be reduced significantly through a better knowledge of the beam position or through the use of a wider target that would minimize the number of protons missing it.
8 NOMAD apparatus and running conditions
8.1 Detector
The NOMAD detector [1] consisted of a number of subdetectors most of which were located inside a large dipole magnet delivering a field of 0.4 T. The direction of the field was horizontal and perpendicular to the neutrino beam.
An array of scintillator counters, , covered the front face of the magnet and was used to veto interactions caused by muons accompanying the neutrino beam. An active target consisting of 132 planes of drift chambers [21] of 33 m2 occupied the upstream part of the magnet. The fiducial mass of 2.7 tons was provided by the walls of the drift chambers. The average density of the active target of 0.1 g/cm3 was low enough to allow accurate measurements of the individual particles produced in the neutrino interactions and to minimize their reinteractions. The momentum resolution for an average track length of 1.5 m was 4% at 1 GeV/ rising to 15% at 50 GeV/.
The chambers were followed by 9 transition radiation (TRD) modules [22] for electron-pion discrimination. Each module consisted of a radiator of polypropylene foils followed by a detection plane of straw tubes. The TRD yielded a pion rejection factor of 1000 for an electron efficiency of 90% in the momentum range 1 to 50 GeV/. Two scintillation counter trigger planes [23], and , bracketed the TRD.
A lead glass array [24] was located at the end of the magnet. It measured the energies and directions of photons and electrons with a resolution of
| (3) |
It was preceded by a preshower consisting of a 1.6 X∘ lead plate followed by two planes of proportional tubes. It was used for better photon localization and for further electron-pion discrimination.
An iron-scintillator hadronic calorimeter was located outside the magnet and was followed by two stations of drift chambers for muon identification. The first station was located after 113 cm of iron and the second after an additional 80 cm of iron. This allowed identification of muons with momentum larger than 2.5 GeV/.
With the detectors described above, NOMAD had excellent electron and muon identification and therefore could reconstruct and identify , , and interactions.
8.2 Running conditions
NOMAD collected data from 1995 to 1998. The main trigger, , consisted of a coincidence between signals from the two trigger planes in the absence of a signal in the entrance veto detector. It was designed to record interactions of neutral particles in the target. Most of the running, a total exposure of protons on target (p.o.t.), was in neutrino mode and yielded about interactions. Some data, amounting to p.o.t., were also collected in antineutrino mode (reverse polarity in the horn and reflector) and some, p.o.t., in zero-focusing mode (with the horn and reflector switched off); these data were used mostly to check the beam line simulation. In particular, the ability of our simulation programs to reproduce the energy spectra of neutrinos of different species at all three settings of the horn demonstrated that the magnetic field of the horn and the material in the beam line were well simulated.
9 Comparison with data
The results of our simulations of neutrino fluxes were compared with the data collected in NOMAD. For this purpose we have generated large samples of , , and interactions in the NOMAD detector according to the energy spectra and radial distributions calculated for each neutrino species. Our event generator included deep-inelastic, quasi-elastic and resonance events, and was complemented by a full simulation of the detector response based on GEANT 3.21 [15]. A detailed description of the NOMAD simulation is given in Ref. [2]. The energy of the hadronic system produced in a neutrino interaction was reduced [25] by 8.3% in the Monte Carlo in order to account for losses in the data not very well described by our detector simulation.
Two sets of selection criteria were applied to both the data and the Monte Carlo events. The first set of cuts selected events with a prompt isolated muon in the final state; depending on the sign of the muon, these events were classified as or interactions. The second set of cuts selected events with a prompt isolated electron or positron (and no muon); these events were classified as and interactions, respectively. The non-prompt background contaminations, mainly from pion and kaon decays in the muon sample and from photon conversions in the electron sample, were evaluated and taken into account. Including the small contribution from the wrong charge assignment to the lepton, the fractions of background amounted to 0.1% for , 15.2% for , 2.3% for and 32.2% for samples for the neutrino mode. A detailed description of the selection of events used in the comparison can be found in Ref. [25]. The summary of all available data samples is given in Table 6.
| Neutrino mode | 830,535 | 27,646 | – | 1,446 |
| Antineutrino mode | 8,176 | 26,996 | 245 | 267 |
| Zero-focusing mode | 1,661 | 534 | 35 | 10 |
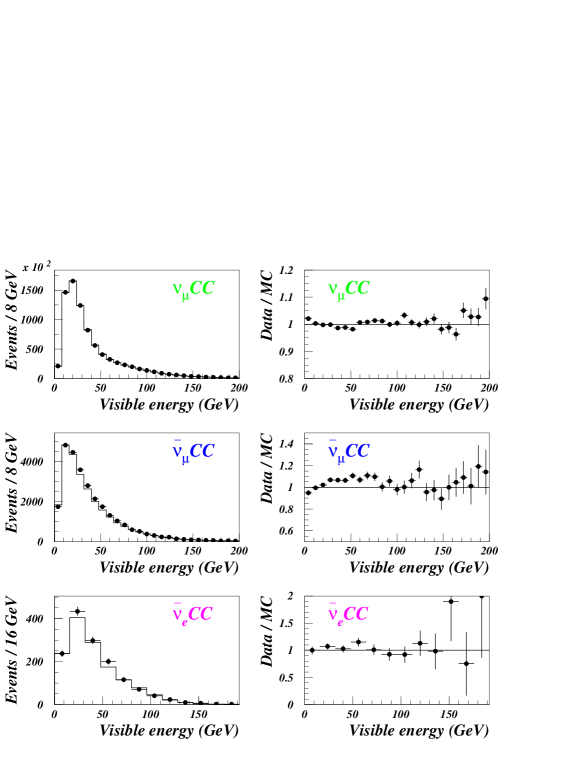
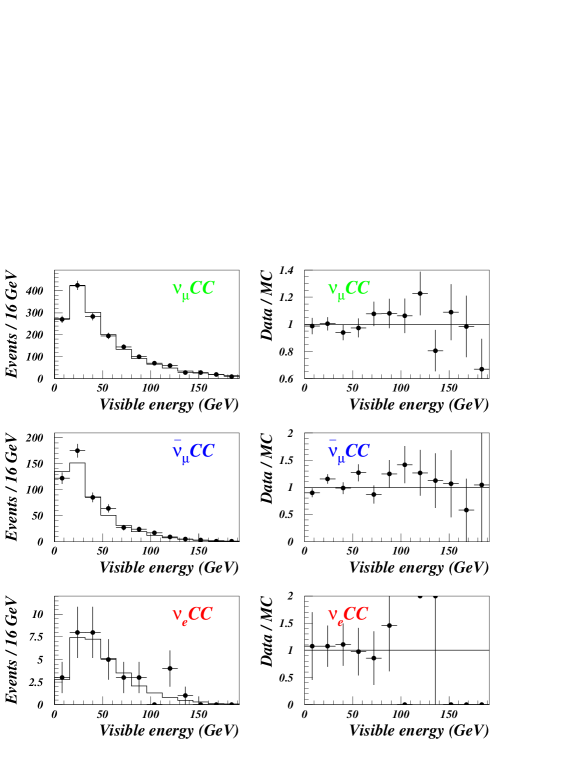
In Fig. 16 we show the comparison between the measured and the predicted neutrino energy spectra for , and events in neutrino mode. The corresponding comparison for interactions cannot be shown here as it has been the subject of a search for oscillations using a “blind” analysis111The spectrum can be shown since, even if there were oscillations within the allowed parameter space, their effect would not be very visible in this spectrum given that the intrinsic ratio of the beam is four times smaller than the intrinsic ratio (Table 2) and given the limited antineutrino statistics.; it is discussed in a separate paper [25]. The neutrino energy was approximated by the “visible energy”, defined as the sum of the energies of the charged lepton and of the hadrons observed in the final state. Since the main purpose of this detailed prediction of neutrino fluxes is the study of oscillations using the ratio, it was sufficient to normalize the Monte Carlo distribution of events to the number of events in the data. Hence, only the shape of the distributions can be compared; nonetheless it is noteworthy that the shape of the energy spectrum is predicted to better than 2% up to 150 GeV. For the normalization of and simulated events we use the relative / and / abundances predicted by our simulation. Therefore both the number of events and the shape of the spectra can be compared. The comparison shows that the results of our simulations are in very good agreement with the data. The only statistically significant difference between the data and the Monte Carlo predictions is a difference of up to about 8% in the expected number of events; this difference is smaller than the estimated uncertainty of our flux predictions. Both the shape and the total number of events are well reproduced. This confirms the validity of our description of the yields of (the principal source of ) and of our estimates of the background contamination from processes other than interactions.
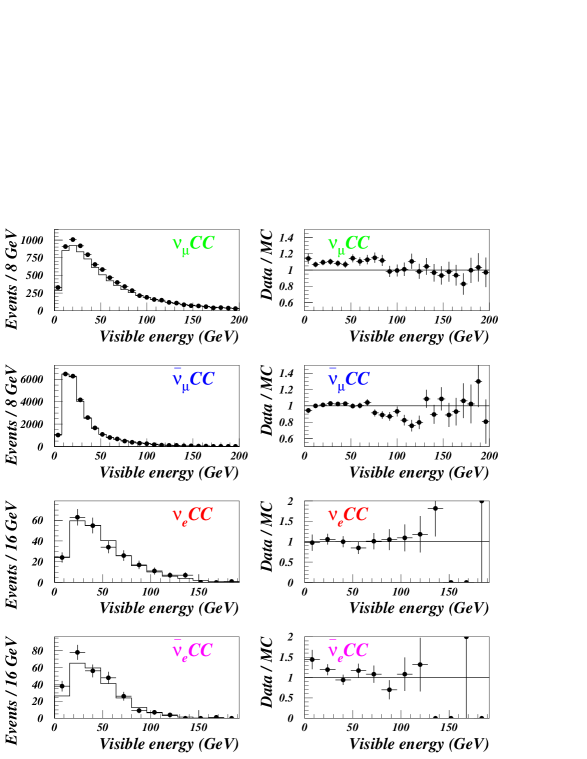
The comparison between the measured and the predicted neutrino energy spectra for , , and events in antineutrino mode is shown in Fig. 17. Similarly, the comparison between the data and the Monte Carlo for zero-focusing mode is shown in Fig. 18. The Monte Carlo distributions of the most abundant neutrino flavour in each data-taking mode ( in antineutrino and in zero-focusing) are again normalized to the total number of corresponding events in the data; the predicted distributions of all other species are normalized using their relative abundances predicted by our simulation. The good agreement between the data and the Monte Carlo is an important confirmation of the validity of the beam line simulation.
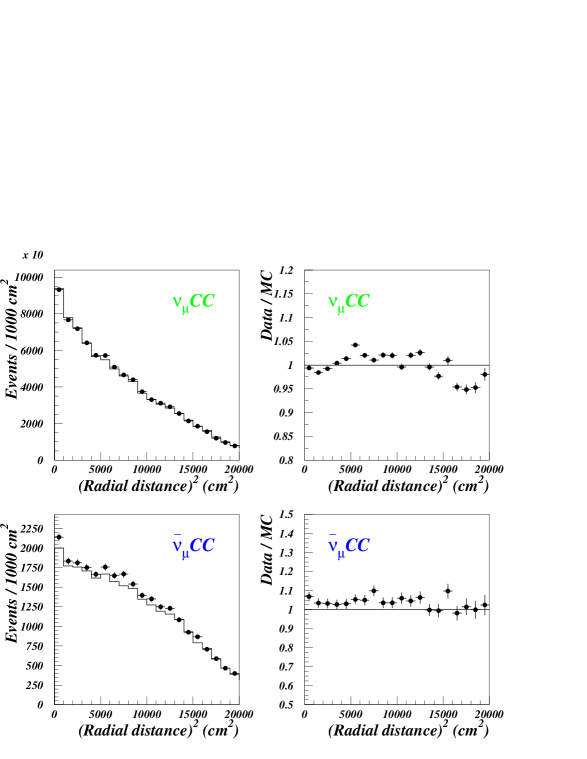
Finally, Fig. 19 shows the comparison between the measured and the simulated radial distributions of the neutrino interaction vertex for and events in neutrino mode. The radial position of each interaction was calculated with respect to the nominal beam axis. The predictions agree with the data to better than 5%. Both the energy and the radial dependence of the ratio are used in the search for oscillations, substantially increasing the sensitivity of the search.
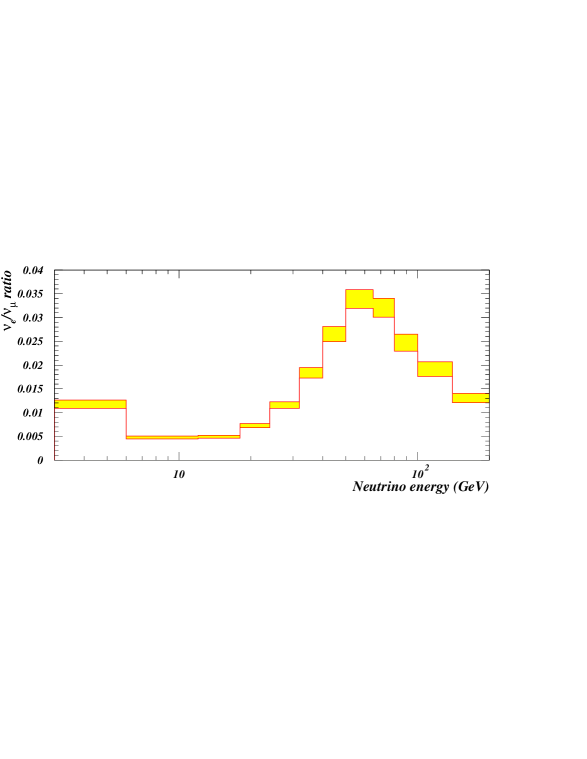
10 Prediction of the ratio
The most probing test of this beam simulation is the prediction of the ratio, which is shown in Fig. 20. The corresponding NOMAD data will be shown in a forthcoming paper, Ref. [25], on the search for oscillations.
11 Conclusions
A detailed simulation of the WANF neutrino beam has been developed by the NOMAD collaboration in order to predict the flavour content of this beam. The simulation was based on particle yields calculated using the FLUKA package. These yields were adapted to agree with the data of the NA20 and SPY particle production experiments. The fluxes of the four neutrino flavours at NOMAD were predicted with an overall uncertainty of about 8% for and , 10% for , and 12% for (energy-dependent and normalization errors combined).
The main purpose of this detailed simulation was the prediction of the ratio for the search for oscillations. The energy-dependent uncertainty achieved on this prediction ranges from 4 to 7% whereas its normalization uncertainty is 4.2%.
References
- [1] NOMAD Collaboration, J. Altegoer et al., Nucl. Instr. and Meth. A 404 (1998) 96.
- [2] NOMAD Collaboration, P. Astier et al., Nucl. Phys. B 611 (2001) 3.
- [3] SPY Collaboration, G. Ambrosini et al., Eur. Phys. J. C 10 (1999) 605.
- [4] A. Fassò, A. Ferrari, P.R. Sala and J. Ranft, in: A. Kling, F. Barao, M. Nakagawa, L. Tavora, P. Vaz, eds., Proceedings of the Monte Carlo 2000 Conference (Springer-Verlag, Berlin, 2001), 955.
- [5] P. Skubic et al., Phys. Rev. D 18 (1978) 3115.
- [6] CHORUS Collaboration, E. Eskut et al., Phys. Lett. B 497 (2001) 8, and references therein.
- [7] G. Acquistapace et al., CERN-ECP 95-14, 1995.
- [8] K. Bernier et al., CERN Yellow Report 97-07, 1997.
- [9] E.H.M. Heijne, CERN Yellow Report 83-06, 1983.
- [10] L. Casagrande et al., CERN Yellow Report 96-06, 1996.
- [11] H.W. Atherton et al., CERN Yellow Report 80-07, 1980.
- [12] A. Ferrari, P.R. Sala, The Physics of High Energy Reactions, in: A. Gandini, G. Reffo, eds., Proceedings of the Workshop on Nuclear Reaction Data and Nuclear Reactors Physics, Design and Safety (World Scientific, Singapore, 1998), Vol. 2, 424.
- [13] See e.g. A. Capella et al., Phys. Rep. 236 (1994) 225, and references therein.
- [14] See [12] and references therein.
- [15] R. Brun, F. Carminati, GEANT Detector Description and Simulation Tool, CERN Program Library Long Writeup W5013, 1993.
- [16] See [15] and references therein.
- [17] A. Ferrari, P.R. Sala, ATLAS Internal Note PHYS-No-086, 1996 (unpublished).
- [18] Particle Data Group, C. Caso et al., Eur. Phys. J. C 3 (1998).
- [19] G. Collazuol et al., Nucl. Instr. and Meth. A 449 (2000) 609.
- [20] A.A. Borisov et al., Phys. Lett. B 369 (1996) 39, and M. Kirsanov, hep-ex/0106035.
- [21] M. Anfreville et al., Nucl. Instrum. and Meth. A 481 (2002) 339.
-
[22]
G. Bassompierre et al., Nucl. Instrum. and Meth. A 403 (1998) 363,
G. Bassompierre et al., Nucl. Instrum. and Meth. A 411 (1998) 63. - [23] J. Altegoer et al., Nucl. Instrum. and Meth. A 428 (1999) 299.
-
[24]
D. Autiero et al., Nucl. Instrum. and Meth. A 372 (1996) 556,
D. Autiero et al., Nucl. Instrum. and Meth. A 373 (1996) 358,
D. Autiero et al., Nucl. Instrum. and Meth. A 387 (1997) 352,
D. Autiero et al., Nucl. Instrum. and Meth. A 411 (1998) 285,
D. Autiero et al., Nucl. Instrum. and Meth. A 425 (1999) 188. - [25] NOMAD Collaboration, P. Astier et al., “Search for oscillations in the NOMAD experiment”, submitted to Phys. Lett. B.