Recent results on two-photon and tau physics at B A B AR
We present a measurement of the total width and mass of the meson with the B A B AR detector at the PEP-II -factory at SLAC. The results based on a data sample of 88 are and . An enhancement observed around 3.63 can be interpreted as an evidence for the state. In addition a preliminary measurement of the lepton lifetime using 30.2 is described. The measured lifetime is: .
1 Measurement of the meson mass and width
1.1 Introduction
The mass and the width of the charmonium ground state are not well established. The world average of the total width and mass is and , respectively. The is expected to decay dominantly via two-gluon annihilation, so that . Hence the ratio of the total width of the to its two-photon partial width is predicted by NLO perturbative QCD :
| (1) |
Using and the world average of gives as , a value higher than but still consistent with the world average.
1.2 Fit of the mass spectrum
The data sample consists of an integrated luminosity of 88 , including runs on and below the resonance. The mesons are produced by two-photon interactions. They are selected via the decay channel with , where in addition the and are required to escape through the beam pipe.
The mass spectrum is shown in figure 1. A large peak can be seen at the mass, a smaller one at the mass. are produced by annihilation where one electron emitted a hard photon by initial state radiation.
The width of the is of the same order of magnitude as the mass resolution of the detector. Therefore the detector resolution has to be precisely known in order to extract the width from the observed peak in the invariant mass spectrum. The width of the of is much smaller than the detector resolution. Hence the observed width of the peak is completely determined by the resolution.
The mass spectrum is fitted in the mass range from 2.4 to 3.6 . The is represented by a convolution of a non-relativistic Breit-Wigner function and a Gaussian. The peak is fitted with a single Gaussian. The standard deviation of the Gaussian, which describes the mass resolution at the peak, is constrained to a value 0.8 lower than that for the . This difference of 0.8 of the mass resolution was obtained from Monte Carlo events. The background is represented by the function: . The free fit parameters are the mass , the mass difference , the width , the mass resolution of the , the normalization and slope of the background and the number of events in the and peaks. The result of the fit is presented in table 1.
| fit |
|---|
1.3 Systematic errors
A source of a systematic error on is the uncertainty of the detector mass resolution. This contribution is estimated to 0.4 by using the mass resolution for the obtained from Monte Carlo events for the fit. The systematic error due to the parametrization of the background is estimated by varying the mass range of the fit. A variation from 2.4-3.6 to 2.7-3.3 changes the value of by 0.7 .
The reconstructed masses and are shifted in Monte Carlo simulation by -1.1 compared to the values used as input. This bias does not affect the mass difference. However the fitted mass is still shifted by -1.8 from the well established PDG value of after correction of the bias observed in the Monte Carlo simulation. We take this shift as a systematic error on the mass since we do not know its source. The unkown mass shift is not necessarily the same for the and the because the angular distribution of their decay products are different. The shift could be caused by inhomogeneities in the magnetic field which may not be correctly modeled in Monte Carlo.
1.4 Evidence for the state
The is not experimentally established yet . Its theoretically predicted mass is in the range 3583 to 3640 . There exist two experimental results , which are not in agreement.
The upper right histogram of figure 1 shows the invariant mass spectrum extended to higher masses. An enhancement can be seen at about 3.63 which lies within the predicted mass region of the and hence is interpreted as an evidence of this state. The mass spectrum is fitted using a Breit-Wigner function convoluted with a Gaussian to describe the enhancement. The standard deviation of the Gaussian is set to 8.5 which was estimated from a Monte Carlo sample. The fit results in and . The peak contains events.
The systematic error associated to the width due to an uncertainty of the mass resolution is 1.6 . The background parametrization gives a contribution of 3.3 to the systematic error on the total width.


In summary, we have measured the mass and width of the meson and and observed an evidence of the . The mass and width of the were measured to and , respectively.
The measured value of the total width of the deviates from the world average by more than three standard deviations while the measured mass agrees well with the world average. The mass of the enhancement interpreted as the falls in the theoretically predicted range of the mass.
2 Measurement of the lepton lifetime
A measurement of the lepton lifetime, combined with the branching ratio of into leptons, the and mass and the lifetime, provides a test of lepton universality. This test is experimentally limited by the uncertainties of the lifetime and its leptonic branching fraction.
The mean lifetime is given by
| (2) |
where is the mass, the average momentum in the center-of-mass frame and the mean decay length. The average momentum is calculated from a Monte Carlo sample. The mean decay length is measured using decays where one decays into three charged particles while the other one decays into a single charged particle.
The tracks of the 3-prong candidate are projected onto the transverse plane, which is perpendicular to the boost direction of the annihilation. The 3-prong vertex in the transverse plane is reconstructed and the transverse decay length is calculated by:
| (3) |
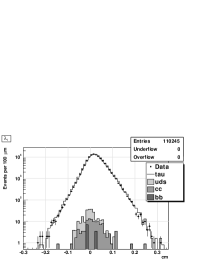
where is the center of the luminous region and the unit vector of the 3-prong momentum in the transverse plane. This method of reconstructing the decay length was chosen because it is less dependent on uncertainties of the detector alignment. The decay length in space is calculated by dividing the transverse decay length by the sine of the polar angle of the 3-prong momentum in the center-of-mass system. Figure 2 shows the decay length distribution for candidates.
The mean decay length is calculated by averaging over all events. The averaging is done without any error weighting of the events. Instead an azimuthal weighting is done to achieve an uniform azimuthal event distribution. This method of averaging is more robust with regards to uncertainties of the position of the luminous region.
The bias of this analysis method was obtained from a Monte Carlo sample. Its uncertainties are the main contribution (1.3 fs) to the systematic error of the lifetime. The detector alignment is another major source of systematic uncertainties (0.7 fs).
The result based on is . It agrees well with the world average of .
Acknowledgments
We are grateful for the excellent luminosity and machine conditions provided by our PEP-II colleagues, and for the substantial dedicated effort from the computing organizations that support B A B AR. The collaborating institutions wish to thank SLAC for its support and kind hospitality. This work is supported by DOE and NSF (USA), NSERC (Canada), IHEP (China), CEA and CNRS-IN2P3 (France), BMBF and DFG (Germany), INFN (Italy), FOM (The Netherlands), NFR (Norway), MIST (Russia), and PPARC (United Kingdom). Individuals have received support from the A. P. Sloan Foundation, Research Corporation, and Alexander von Humboldt Foundation. The author would like to thank the organizers of the XXXVIIIth Recontres de Moriond for a wonderful conference.
References
References
- [1] K. Hagiwara et al., Particle Data Group, Phys. Rev. D66, 010001 (2002).
- [2] W. Kwong et al., Phys. Rev. D37, 3210 (1988).
- [3] D. Ebert et al., Phys. Rev. D62, 034014 (2000); E.J. Eichten and C. Quigg, Phys. Rev. D49, 5845 (1994); and T.A. Lahde and D.O. Riska, Nucl. Phys. A707, 425 (2002).
- [4] C. Edwards et al., Phys. Rev. Letters 48, 70 (1982).
- [5] S. K. Choi et al., Belle Collaboration, Phys. Rev. Letters 89, 102001 (2002).