Measurement of Baryonic Decays
Recent results of baryonic decays from Belle are reported. This study is done by a 78 fb-1 data sample, consisting of million pairs, collected by the Belle detector at the KEKB asymmetric energy (3.5 on 8 GeV) collider. The results reported here include the first observation of the two-body decay , the first hyperonic decay , and first observations of , , and .
1 Introduction
The Belle collaboration recently reported the observation of aaaThroughout this report, inclusion of charge conjugate mode is always implied unless otherwise stated. , which is the first known example of meson decay to charmless final states containing baryons. The three-body decay rate is larger than the rate for two-body decays (such as ), We continue this study with a larger data set and search for other related baryonic decay modes. In the Standard Model, these decays proceed via tree and penguin diagrams. They may be used to search for direct violation and test our theoretical understanding of rare decay processes involving baryons .
Belle is a general purpose detector operating at the KEKB asymmetric collider. Data sample used here consists of million pairs or 78 fb-1 data set collected on the resonance.
2 Analysis Procedure
The biggest challenge of observing rare decay processes is to fish out a few signal events from a huge sample of background events. For example, after the trigger and hadronic event pre-selection, there are about 170 million continuum events and 85 million events left for the 78 fb-1 data set. It is a tough job to reject all of the background. The following is a brief description of the procedure of a typical analysis.
2.1 Signal identification
Since the center-of-mass energy is set to match the resonance and decays into a pair, we can use the following two kinematic variables to identify the reconstructed meson candidates: the beam-energy constraint mass, , and the energy difference, , where , and are the beam energy, the momentum and energy of the reconstructed meson in the rest frame of , respectively.
The resolution of is about 3 MeV/ which is due to the spread of the beam energy. Typically, the resolution of is about 10 MeV for final states with charged particles only.
2.2 Background suppression
The generic decay is mainly via the transition which normally has more final state particles than those of the rare decay modes reported here, thus the background from generic B decays is much less than that from the continuum process. Similar decay processes close to the target mode should be checked carefully one by one because they might feed into the signal region.
For the continuum events, they have quite different event topology (more back-to-back or jet-like) than that of events (more spherical) in the frame. We can select some shape variables to form a Fisher discriminant in order to reject the continuum background.
The probability density functions (PDFs) of the Fisher discriminant and other uncorrelated kinematic variables (e.g. the angle between the flight direction and the beam direction), are combined to form signal (background) likelihood , and a cut is then applied on the likelihood ratio in order to fish out the signal.
2.3 Yield determination
After the optimization of selection cuts, events in the candidate region are used for yield determination. This can be done either by un-binned likelihood fit or binned fit. The signal PDFs are normally a Gaussian function for and a double Gaussian for with parameters determined by MC simulation. The background PDFs are Argus function for and a straight line for with parameters determined by sideband events or by continuum MC simulation. If there is no evidence of signal events, one can use the fit results to estimate the expected background, and compare this with the observed number of events in the signal region in order to set the upper limit on the yield at the 90% confidence level .
2.4 Systematic check
If one is lucky to observe a new decay mode, the comparison between signal MC simulation and data is necessary. However, most of the systematic studies are limited by the small statistics of the signal events. Therefore, control samples with large statistics and relevant to the study are checked in order to determine the systematic errors. For example, the systematic error due to the efficiency error of the proton identification requirements is studied with the sample; the kaon identification is studied with the , sample; the tracking efficiency is studied with the and sample, etc..
3 Recent results
3.1 Results of
Although the four- and three-body baryonic decays of and are experimentally well observed, there has no two-body mode being found. An effort is made to search for with . Fig. 1 shows the results. The measured branching fraction is , where the first and the second errors are statistical and systematic, respectively. The last error is due to the uncertainty in the branching fraction . This is the first ever observation of a two-body baryonic decays. One interesting feature is that this two-body decay rate is about factor of 10 smaller than that of the related three-body decay. In contrast, the two- and three-body mesonic decays are comparable.


3.2 Results of
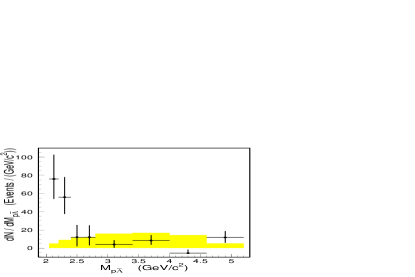
We observe a clear signal for , which is the first hyperonic decay being found. Since the decay is not uniform in phase space, we fit the signal yield in bins of , and correct for the MC-determined detection efficiency for each bin. This reduces the model dependence of the branching fraction determination. The signal yield as a function of mass is shown in Fig. 2. This threshold peaking behavior is similar to that of . The measured branching fraction is . Searches for and yield no significant signals and we set 90% confidence-level upper limits of and .
3.3 Preliminary results of
Following our observation of mode, new theoretical models tried to explain the experimental data and illustrate the possible correlations between similar decay modes. Some theoretical explanation about the threshold peaking behavior suggests possible glue-ball induced enhancement. Table 1 summarizes the search results of related three-body decays. There is no evidence for possible glue-ball states in 2.2 GeV/ 2.4 GeV/ region. These results are preliminary. Note that we apply charm veto to these decay modes. However, the vetoed events with coming from decay can be used as a calibration tool. The determined branching fractions using these events and the PDG listed values are also shown in Table 1 for comparison.
| Sig. | PDG ) | |||
|---|---|---|---|---|
| 2.12 | ||||
| 0.92 | ||||
| 2.94 | ||||
| UL at 90% C.L. | 2.78 | |||
| glue-ball | UL at 90% C.L. |
Acknowledgments
The author wish to thank the KEKB accelerator group for the excellent operation of the KEKB accelerator and the Moriond QCD organization committee for making such a wonderful conference. This work is supported by the National Science Council of the Republic of China under the grant NSC-91-2112-M-002-028.
References
References
- [1] K. Abe et al. (Belle Collaboration), Phys. Rev. Lett. 88, 181803 (2002).
- [2] K. Abe et al. (Belle Collaboration), Phys. Rev. D 65, 091103 (2002).
- [3] For some of the recent developments, see: H.Y. Cheng and K.C. Yang, Phys. Rev. D 65, 054028 (2002); H.Y. Cheng and K.C. Yang, Phys. Rev. D 66, 014020 (2002); C.K. Chua, W.S. Hou and S.Y. Tsai, Phys. Rev. D 66, 054004 (2002).
- [4] A. Abashian et al. (Belle Collaboration), Nucl. Instr. and Meth. A 479, 117 (2002).
- [5] J. Conrad et al., Phys. Rev. D 67, 012002 (2003).
- [6] S.A. Dytman et al. (CLEO Collaboration), Phys. Rev. D 66, 091101 (2002); N. Gabyshev et al. (Belle Collaboration), Phys. Rev. D 66, 0911102 (2002).
- [7] K. Hagiwara et al. (Particle Data Group), Phys. Rev. D 66, 010001 (2002).
- [8] C.K. Chua, W.S. Hou and S.Y. Tsai, Phys. Lett. B544, 139 (2002).