Study of the process in the energy region below 0.98 GeV.
Abstract
The cross section of the process was measured in the Spherical Neutral Detector (SND) experiment at the VEPP-2M collider in the energy region below 980 MeV. This measurement was based on about selected events. The obtained cross section was analyzed together with the SND and DM2 data in the energy region up to 2 GeV. The -meson parameters: MeV, MeV and nb were obtained. It was found that the experimental data cannot be described by a sum of only , , and resonances contributions. This can be interpreted as a manifestation of decay, suppressed by -parity, with relative probability .
I Introduction
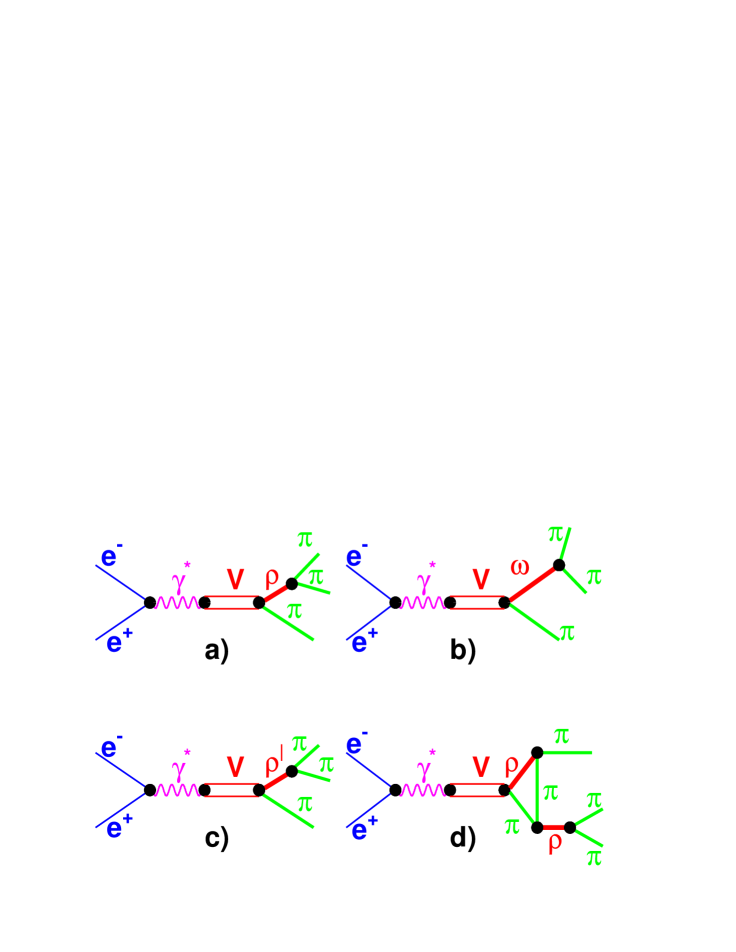
The cross section of process in the energy region 2 GeV is determined by the transitions of light vector mesons V () into the final state: . The branching ratios for vector mesons with isospin are large: , [1], , [2], and thus the cross section measurements are important for study of these resonances. The intermediate state dominates in these transitions. The transition can also proceed via mechanisms suppressed by the -parity: [3, 2] or (). The studies of the reaction allow to determine the vector mesons parameters and provide information on the rule violation in decay and on the -parity violation in the processes .
The process in the energy region below 2200 MeV was studied in several experiments during the last 30 years. The -meson production region was studied in the Ref.[4, 5, 6, 7, 8, 9, 10] and studies of the -meson energy domain were reported in Ref.[11, 12, 13, 14, 15, 16, 8]. In Ref.[17, 18, 19, 8] the cross section was studied in the wide energy region from 660 up to 1100 MeV and in the Ref.[20] the upper limit was imposed on the -parity suppressed decay . The cross section measurements in the and resonances energy region ( – 2200 MeV) were reported in Ref.[21, 22, 23, 24, 19, 8, 25].
Recently the process was also studied with the Spherical Neutral Detector (SND)[26, 27, 28, 2], the process dynamics was analyzed and the cross section was measured in the energy region from 980 to 1380 MeV. Here we present the cross section measurement in the energy region below 980 MeV. The obtained cross section was analyzed together with the SND [27, 2] and DM2 [25] data in the energy region up to 2000 MeV.
II Experiment
The SND detector [29] operated from 1995 to 2000 at the VEPP-2M [30] collider in the energy range from 360 to 1400 MeV. The detector contains several subsystems. The tracking system includes two cylindrical drift chambers. The three-layer spherical electromagnetic calorimeter is based on NaI(Tl) crystals. The muon/veto system consists of plastic scintillation counters and two layers of streamer tubes. The calorimeter energy and angular resolutions depend on the photon energy as and The tracking system angular resolution is about and for azimuthal and polar angles respectively.
In 1998 – 2000 the SND detector collected data in the energy region MeV with integrated luminosity about . For the luminosity measurements, the processes and were used. In this work the luminosity measured by using was used for normalization, because in the -meson energy region the contribution of the background to the process is rather large. The systematic error of the integrated luminosity determination is estimated to be 2%. Since luminosity measurements by and reveal a systematic spread of about 1%, this was added to the statistical error of the luminosity determination in each energy point. The statistical accuracy was better than 1%.
The beam energy was calculated from the magnetic field value in the bending magnets and revolution frequency of the collider. The relative accuracy of the energy setting for each energy point is about 0.1 MeV, while the common shift of the energy scale for all points within the scan can amount to 0.5 MeV. In the three energy points in the vicinity of the -resonance peak the beam energy was calibrated using resonant depolarization method [31]. The accuracy of center of mass energy calibration is 0.04 MeV. In order to correct the calculated beam energy, the common shifts of the energy scale in the experimental scans were the free parameters in the analysis and varied relative to the calibrated energy points. The beam energy spread varies in the range from 0.08 MeV at MeV to 0.35 MeV at MeV.
III Data analysis
A Selection of events
The data analysis and selection criteria used in this work are similar to those described in Ref.[27, 28, 2]. During the experimental runs, the first-level trigger [29] selects events with energy deposition in the calorimeter more than 180 MeV and with two or more charged particles. During processing of the experimental data the event reconstruction is performed [29, 27]. For further analysis, events containing two or more photons and two charged particles with cm and cm were selected. Here is the coordinate of the charged particle production point along the beam axis (the longitudinal size of the interaction region depends on beam energy and varies from 2 to 2.5 cm); is the distance between the charged particle track and the beam axis in the plane. Extra photons in events can appear because of the overlap with the beam background or nuclear interactions of the charged pions in the calorimeter. Under these selection conditions, the background sources are , , , , processes, cosmic and beam backgrounds.
The polar angles of the charged particles were bounded by the criterion: . To suppress the cosmic and beam backgrounds, the following cuts were applied: MeV, , cm and . Here is the energy deposition of the neutral particles, is the number of detected photons, and are z-coordinates of the charged particles tracks, is the angle between two charged particles tracks.
To suppress the events, an energy deposition of the charged particles in the calorimeter was required to be small: .
To reject the background from the , and , the following cut was imposed: . Here is an acollinearity angle of the charged particles in the azimuthal plane.
For events left after these cuts, a kinematic fit was performed under the following constraints: the charged particles are assumed to be pions, the system has zero total momentum, the total energy is , and the photons originate from the decays (Fig.1). The value of the likelihood function (Fig.2) is calculated during the fit. In events with more than two photons, extra photons are considered as spurious ones and rejected. To do this, all possible subsets of two photons were inspected and the one, corresponding to the maximum likelihood was selected. The kinematic fits were also performed under assumptions that the , or events with extra photons were detected and the values of the corresponding likelihood functions , and were calculated. After the kinematic fits, the following cuts were applied: , , and , the polar angle of at least one of the photons, selected by the reconstruction program as originated from the decay, should satisfy the following criterion: . In the energy region MeV, for additional suppression of the background, the cut – (at – MeV) was applied. Here and are the charged pions momentum and energy calculated after the kinematic reconstruction. For additional suppression of the background, the criterion was applied for the energies MeV.
B Background subtraction
The number of background events was estimated from the following formula:
| (1) |
where is a process number, is the cross section of the background process taking into account the radiative corrections, is the integrated luminosity, is the detection probability for the background process obtained from simulation under selection criteria described above. For the background estimation, the cross section obtained in SND experiments [32] was used.
To estimate the accuracy of background events number determination, the distribution in the energy region MeV (Fig.12) was studied. The experimental distribution in the range was fitted by a sum of background and signal. The distribution for background events was taken from the simulation, while for the signal events – by using experimental data collected in the vicinity of the meson peak. As a result, the ratio between the number of background events obtained from the fit and the number calculated according to Eq.(1) was found to be . The error was estimated by varying the selection criteria. Taking into account this ratio, the number of background events obtained from Eq.(1) was multiplied by a factor of 2 in all energy points and the accuracy of the determination of the number of background events was estimated to be about 60%.
The numbers of events (after the background subtraction) and background event numbers are shown in Table I.
To check the accuracy of background subtraction in the energy region MeV, the data were analyzed in a different way. The kinematic reconstruction was performed under the following constrains: the charged particles are pions, the system has zero total momentum, the total energy is . The constrain that the photon originated from the decay was not used. In events with more than two photons, extra photons are considered as spurious ones and rejected. The value of the likelihood function is calculated during the fit. After the fit, the following cut was applied: . For selected events the two-photon invariant mass spectra (Fig.13) were fitted by a sum of background and signal ( is calculated after the kinematic fit). The shape of the distribution for events was obtained by using experimental data collected in the vicinity of the -resonance. For the background the uniform distribution was used (other assumptions about the shape of the background spectrum do not change the fit results). The cross sections obtained by using two different methods of background subtraction are in agreement (TableII). The analogous check was performed for the energy region MeV. The results of different approaches are again in agreement.
C Detection efficiency
The detection efficiency of the process was obtained from simulation. To take into account the overlap of the beam background with the signal events, background events (experimental events collected when the detector was triggered with an external generator) were mixed with the simulated events. The detection efficiency for events without -quantum radiation by the initial particles is about 0.35 (Table I). The detection efficiency dependence on the radiated photon energy is shown in Fig.14. The efficiency decrease with the rise of the radiated photon energy is due to the selection criterion , which involves the energy and momentum conservations in the process.
Inaccuracies in the simulation of the distributions over some selection parameters lead to an error in the determination of average detection efficiency. To take into account these uncertainties, the detection efficiency was multiplied by correction coefficients, which were obtained in the following way [27, 2]. The experimental events were selected without any conditions on the parameter under study, using the selection parameters uncorrelated with the studied one. The same selection criteria were applied to simulated events. Then the cut was applied to the parameter and the correction coefficient was calculated:
| (2) |
where and are the number of events in experiment and simulation respectively selected without any cuts on the parameter under study; and are the number of events in experiment and simulation when the cut on the parameter was applied. As a rule, the error in the coefficient determination is connected with the uncertainty of background subtraction. This systematic error was estimated by varying other selection criteria.
The inaccuracy in distribution simulation (Fig.2) is the main source of uncertainty in the detection efficiency determination. The correction coefficient (Fig.15) was obtained by using data collected in the vicinity of the resonance. The error due to uncertainty in simulation of other parameters is estimated to be 1.7%. In the energy region MeV the additional selection criterion was applied. The uncertainty due to this cut was estimated to be 3%. The systematic error of the detection efficiency determination is 2.7% in the energy region MeV and is about 4.1% at . The detection efficiency after the applied corrections is shown in Table I.
IV Theoretical framework
In the framework of the vector meson dominance model, the cross section of the process is
| (3) |
where and are the and momenta, and are and pairs invariant masses. The form factor of the transition has the form
| (4) |
The first term in Eq.(4) takes into account the transition (Fig.16 a), which dominates in the process under study [28]. Here
where is the pair invariant mass, and are the neutral and charged pion masses, denotes the sign of the -meson ( pair) charge. The and transition coupling constants could be determined in the following way:
Experimental data [28] do not contradict to the equality of the coupling constants . In this case the and meson widths are related as follows:
| (5) |
In the subsequent analysis we assume that , and the width values were taken from the SND measurements [28]: MeV, MeV. The neutral and charged mesons masses were assumed to be equal and were also taken from the SND measurements [28] MeV. A factor takes into account the interaction of the and mesons in the final state [33] (Fig.16 d), parameter corresponds to the prediction of Ref.[33], where the concrete form of the function can be found. In experimental studies of the mass spectra in the process at [28] we had obtained . This result is consistent with zero, but also does not contradict to the prediction of Ref. [33].
The second term in Eq.(4) takes into account the possible transition (Fig.16 c). This term can be written as , where
In the analysis, the amplitude was assumed to be a real constant. From the mass spectra analysis, in the process at [28], it was found that MeV-2.
The third term in Eq.(4) takes into account the transition [3] (Fig.16 b). The polarization operator of the mixing satisfies [33, 34], where
| (6) |
so we have assumed in the subsequent analysis.
The process cross section can be written in the following form:
| (7) |
where
| (8) |
| (9) |
| (10) |
The phase space factors , and were calculated as follows:
| (11) |
| (12) |
| (13) | |||
| (14) |
Amplitudes of the transition have the form
| (15) |
where
Here denotes the final state of the vector meson decay, is the vector meson mass, . The meson mass and width were taken from the SND measurements MeV, MeV [27]. The following forms of the energy dependence of the vector mesons total widths were used
Here is a coupling constant of transition, , , , and are the meson, kaon, meson and pion momenta, is the phase space factor of the final state [35], and are the form factors which restrict too fast growth with energy of the partial widths, so that as . According to Ref.[36] these form factors can be written as follows
| (16) |
where is the momentum of the pseudoscalar meson, is the range parameter (its value was taken to be the same for all decays).
The relative probabilities of the decays were calculated as follows
In particular:
In further analysis we have used nb, nb, nb and nb obtained in the SND experiments [37, 27, 38].
is a relative interference phase between the vector meson and , so . Phases can deviate from or and their values can be energy dependent due to mixing between vector mesons. For example, the phase was found to be close to [27, 2] in agreement with the prediction [39] , where the function is defined in Ref.[39]. In Ref.[2] it was shown that and , so in this work these two phases were fixed on those values.
Taking into account the mixing, the and transition amplitudes can be written in the following way [3, 34]
| (17) |
where
The superscript denotes the coupling constants of the pure, unmixed state. The Eq.(17) can be rewritten as follows
where
If the transition proceeds only via mixing, that is , then and almost does not depend on energy, besides
V Cross section measurement
From the data in Table I, the cross section of the process can be calculated as follows:
| (19) |
where is the number of selected events, is the integrated luminosity, is the function which takes into account the detection efficiency and radiative corrections for the initial state radiation:
| (20) |
Here is the emitted photon energy, is the electron “radiator” function [40], is the detection efficiency of the process as a function of the emitted photon energy and the total energy in the center of mass system, is the theoretical energy dependence of the cross section given by the equation (7).
To obtain the values of at each energy point, the visible cross section of the process
was fitted by theoretical energy dependence
The following logarithmic likelihood function was minimized:
where is the energy point number, is the error of the visible cross section .
In the fit the , , meson parameters(the mass, width, branching ratios of main decays ) was fixed at their values obtained in the SND experiments [27, 2], other parameters were fixed as follows , , and . The Eq.(15) was written in the following form:
| (21) |
where is a complex constant.
The , and were the free parameters of the fit. The values were obtained from the approximation of the experimental data in several models:
-
1.
,
-
2.
and are free parameters,
-
3.
is a free parameter,
-
4.
, and are free parameters
The fits were also performed under the same assumptions, but with and .
The values of actually do not depend on the applied model. The largest model dependence, about , was found at from 800 to 840 MeV. Using the obtained values, the cross section of the process was calculated (Table III ). The systematic error of the cross section determination at each energy point is equal to
Here at MeV and at MeV, . They are systematic uncertainties in the detection efficiency and integrated luminosity, which are common for all energy points. The model uncertainty was obtained from the difference of values determined for the models mentioned above. The error takes into account the inaccuracy () of the background subtraction and depends on the beam energy.
VI The cross section analysis.
The cross section measured in this work (Table III) was analyzed together with the cross section measured by SND in the energy region from 980 up to 1380 MeV [27, 2] and with the DM2 results of the and cross sections measurements in the energy region from 1340 to 2200 MeV [25].
The cross section was fitted by the expression (7). The process cross section was written in the following way:
| (22) |
Here we have neglected the contribution. To calculate , we have assumed .
The cross sections of the and processes, measured by SND and DM2, were fitted together. The function to be minimized was
where
Here are the experimental cross sections, are their uncertainties, is a coefficient which take into account the relative systematic bias between SND and DM2 data. The errors include both the statistical and the systematic errors: . In Ref.[2] the coefficient was estimated to be . In the analysis that follows we have fixed this coefficient at 1 or 1.54.
In the fittings , , , , , , , , , , and were the free parameters. The approximations were performed under the following assumptions about the phase space factor for the final state:
-
1.
, ;
-
2.
, ;
-
3.
, MeV-2;
-
4.
, MeV-2.
The nonzero values of the amplitude are the upper limits imposed on the 90% confidence level by using the SND result reported in Ref.[28]. The approximations were also performed without taking into account the contribution from the process, i.e. by assuming . The difference in the fit results was included in the model uncertainty.
The fittings were performed under the following model parameters:
-
1.
, ;
-
2.
, and are free parameters;
-
3.
, is a free parameter.
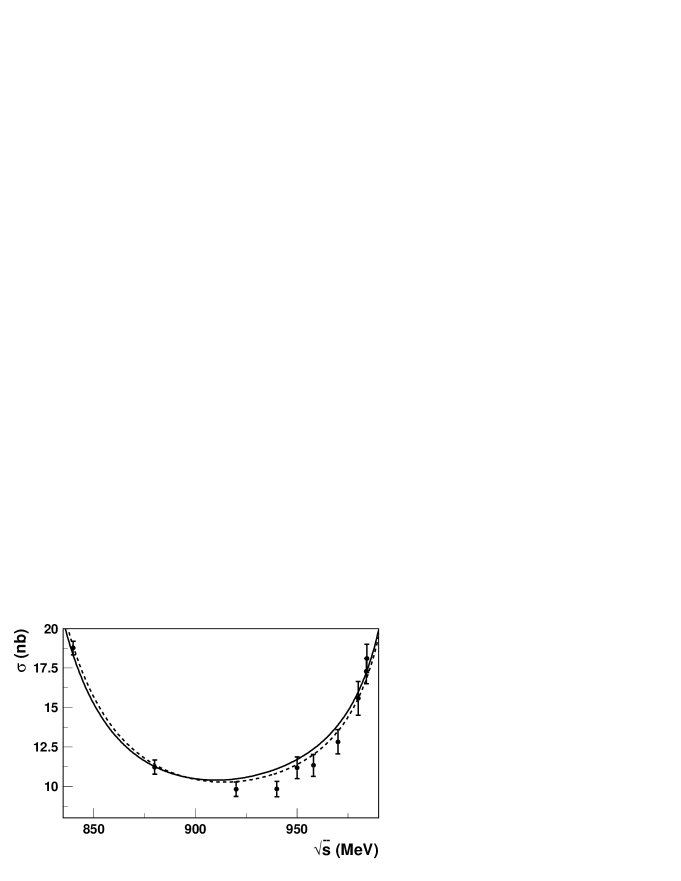
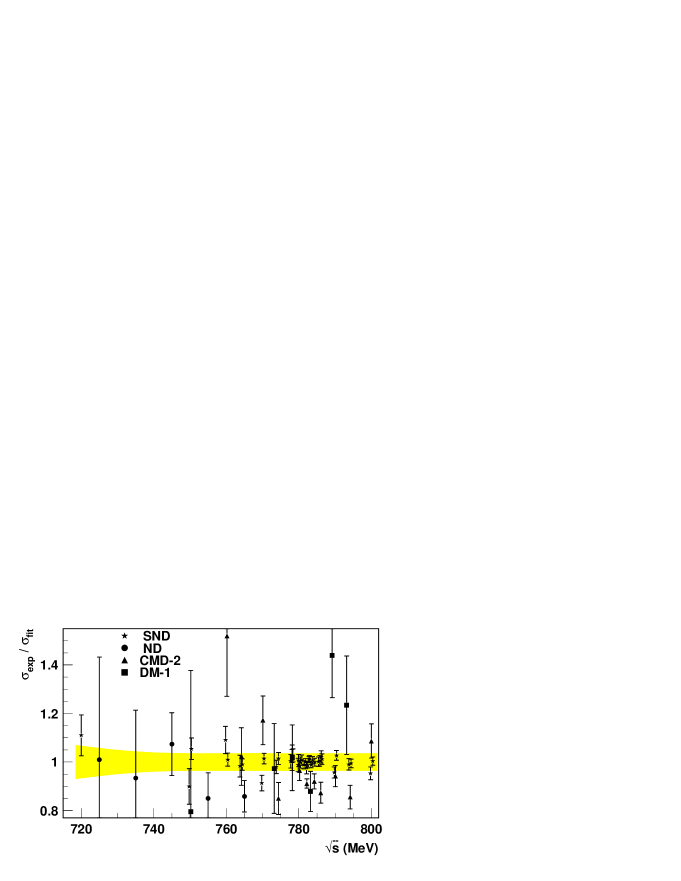
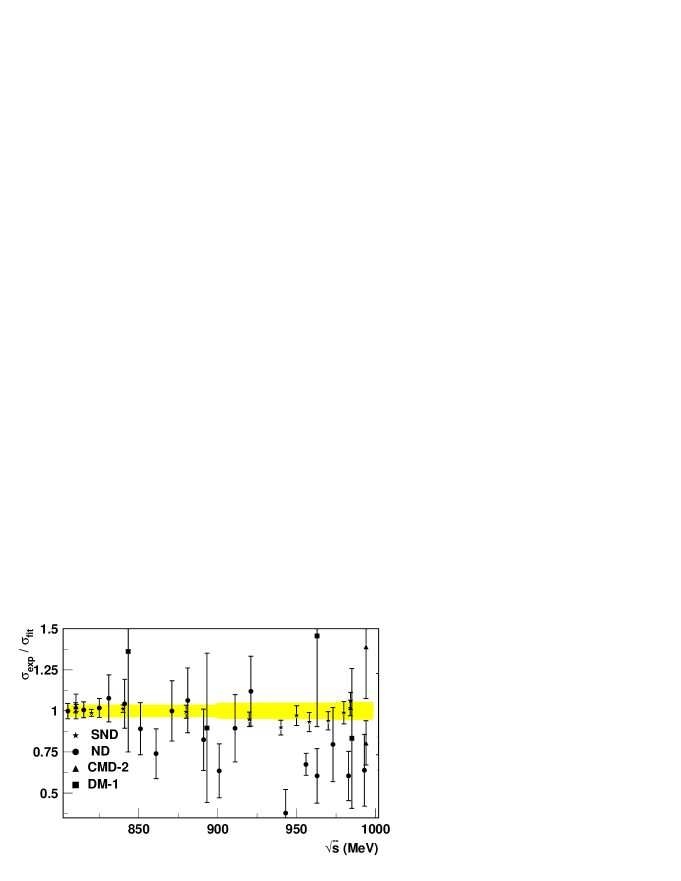
The results of the fits are shown in Table IV and in Fig.17, 18,19,20,21,22. In the Table IV, , () and denote the values for the energy regions below and above 970 MeV and in the energy range MeV. The values in the first model (column 1 in the Table IV) is too large and this model contradicts to the experimental data. The second and third models (columns 2 and 3 in Table IV) are in agreement with the experimental data. The value for the second model is less than for the third one. If , and are the free parameters in a fit, then they are found to be equal to nb, degree and GeV-1. In this case the value of the range parameter turns out to be rather small and consistent with zero. The value of for the second model is less than for the third one, and vice versa the for the third model is less than for the second. In the energy range MeV (Fig.20) the fitted curves for the second and third models exceed the experimental points in average by about 1.5 and 1 errors respectively. The difference between models 2 and 3 is also seen in the energy regions MeV and MeV (Fig.17 and 22). The for the third model increases by a factor of 2 in comparison with the second model. The results of the cross section fits are shown in Fig.23. In case when the form factors (16) are used, the theoretical curve poorly describes experimental points at the left slope of the resonance . The CMD2 results of the reaction studies [41] are also presented in Fig.23. These data agree better with the second model.
If the relative bias between SND and DM2 measurements is not assumed, the value is rather large: . Here is the number of fitted experimental points (Table IV). A rather large scale factor is required to concert the SND and DM2 data, and in this case . In order not to guess about relative systematics between the SND and DM2 experiments, the fits described above were redone assuming , but without taking into account cross section measured in DM2 experiments. (Table V). The parameters , and were obtained from the fitting to the cross section reported by DM2, and , , , were obtained by using SND data only. In this case the first model (column 1, Table V) agrees with experimental data, but agreement is significantly better if the fits are performed in the second or third models (columns 2 and 3 in Table V). The value for the third model is slightly bigger than for the second one. In this approach the fitted curve is in conflict with the DM2 measurenment of the cross section (Fig.24).
VII Discussion
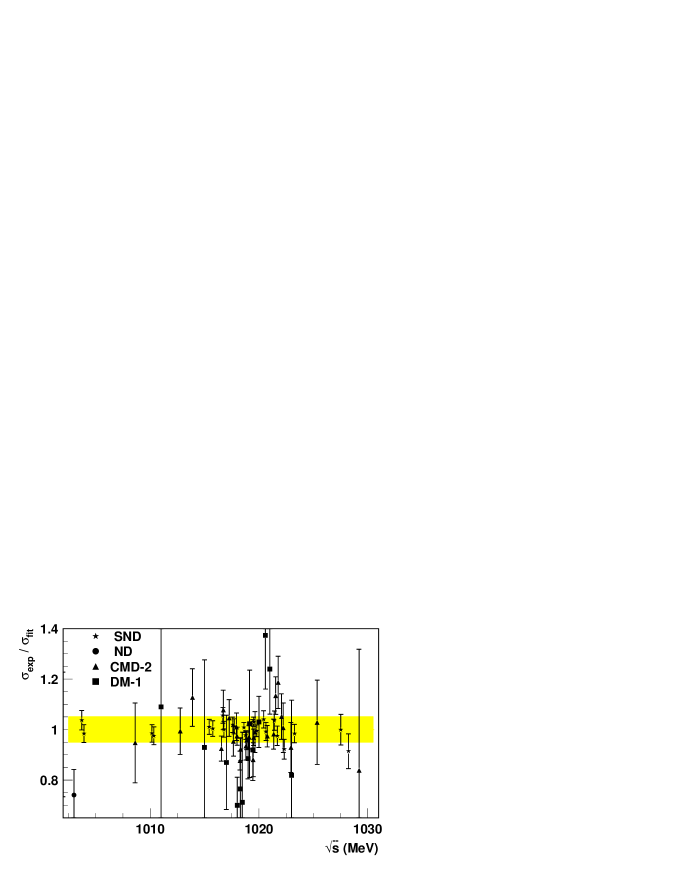
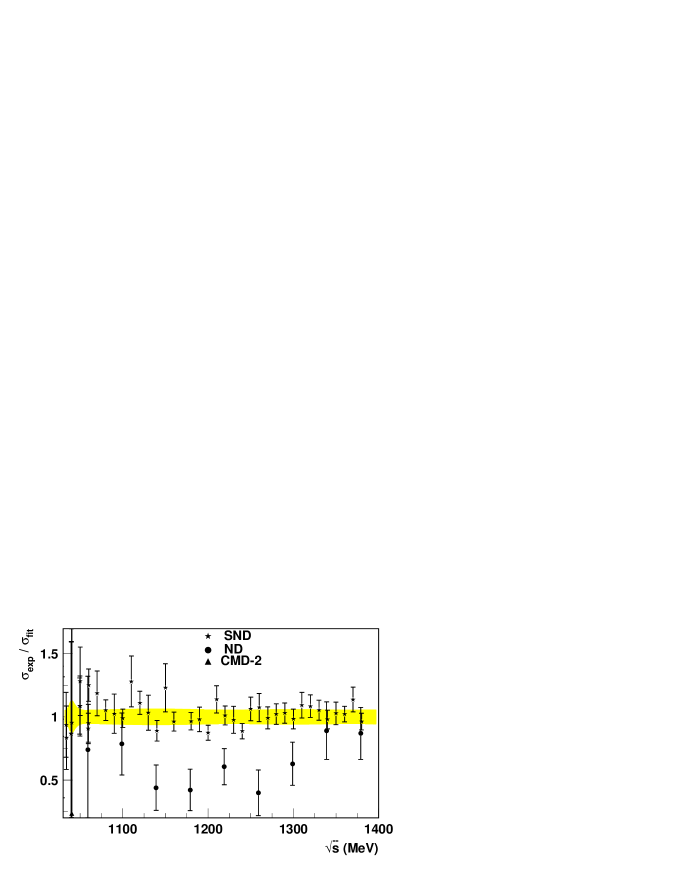
Comparison of the cross section obtained in SND experiments with other results [17, 8, 19, 10, 15, 16] is shown in Fig.25,26,27 and 28. The DM1 results [17] are in agreement with the SND measurements. The ND results [8, 19] agree with SND data in the energy region MeV, while for MeV ND points lay on about two errors lower than SND ones. In the vicinity of the resonance peak ( MeV) the SND cross section exceeds the CMD2 measurements [10], while in the meson energy region the SND and CMD2 results [15, 16] are in agreement.
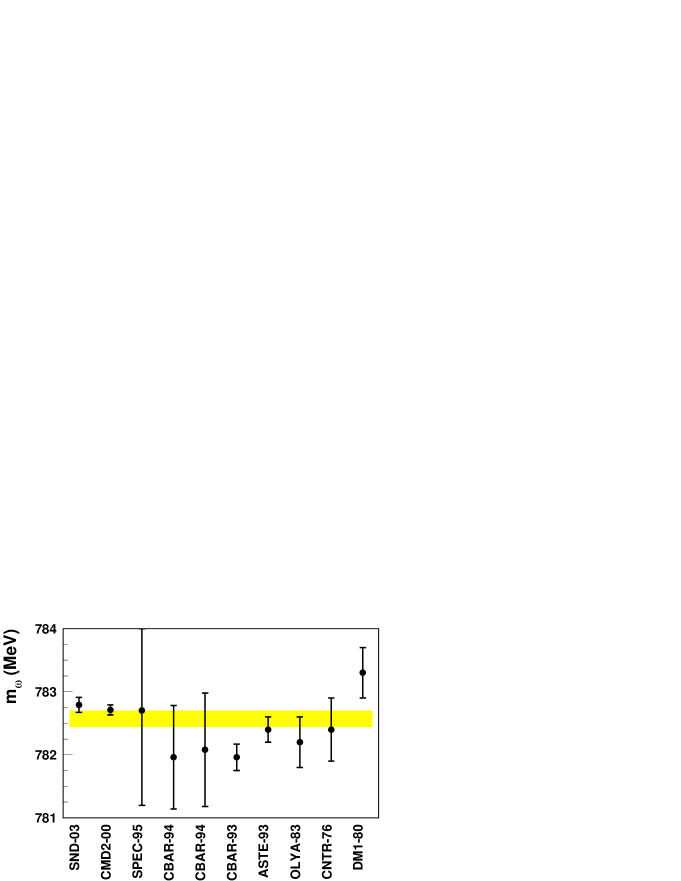
The meson parameters , , were measured through study of the cross section. The meson mass was found to be
Here the systematic error is related to the accuracy of the VEPP-2M energy scale calibration by resonant depolarization method, 0.04 MeV, and to the model uncertainty, 0.08 MeV. The SND measurement in comparison with the results of experiments [10, 42, 43, 6, 44, 17] and the world average value [1] is shown in Fig.29. SND result is in agreement with the CMD2 measurement [10], and differs from world average by about 1.3 standard deviations. The maximum difference, about 3.4 standard deviations is between the SND result and the Crystal Barrel measurement [43].
The following value of the meson width was obtained:
The systematic error is related to the model dependence and to the accuracy of energy determination. The comparison of this value with the results obtained in Ref.[10, 42, 7, 9, 6, 17, 5] and with PDG world average value [1] is shown in Fig.30. The SND result agrees with other measurements.
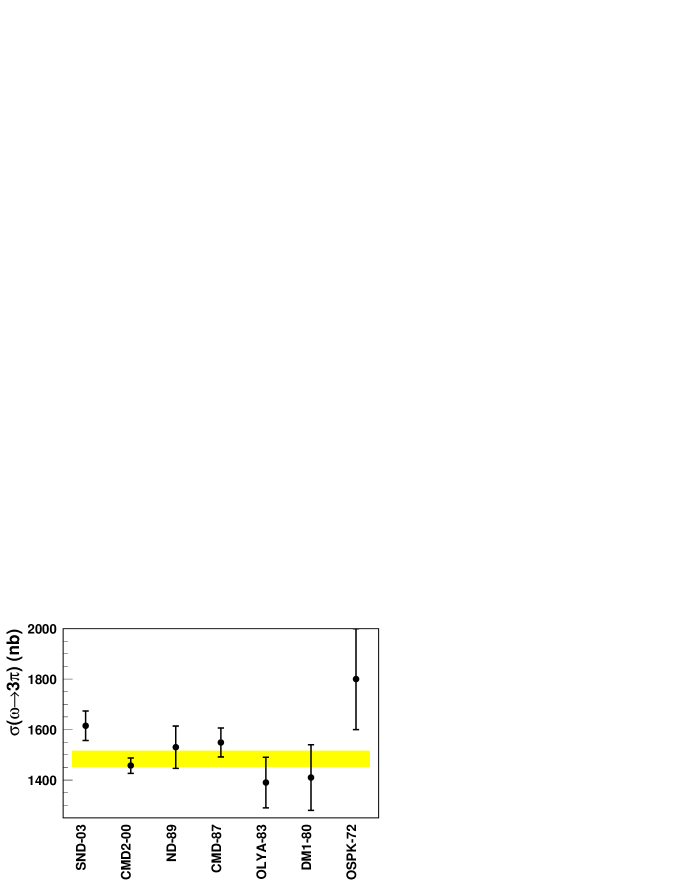
The parameter was found to be
The systematic error includes the systematic uncertainties in the detection efficiency and luminosity determinations, 55 nb in total, and the model dependence 13 nb. The comparison of the obtained value with other experimental results [10, 7, 9, 6, 17, 5] and with PDG world average [1] is shown in Fig.31. The SND result exceeds the central values of the majority of the previous measurements. It differs by less than one standard deviation from the results in Ref.[7, 9, 5], by about 1.4 standard deviations from the DM1 measurement [17], by 2 standard deviations from the OLYA result [6] and PDG world average nb. The difference from the most precise measurements, done by CMD2 [10] and SND, is about 2.5 standard deviations.
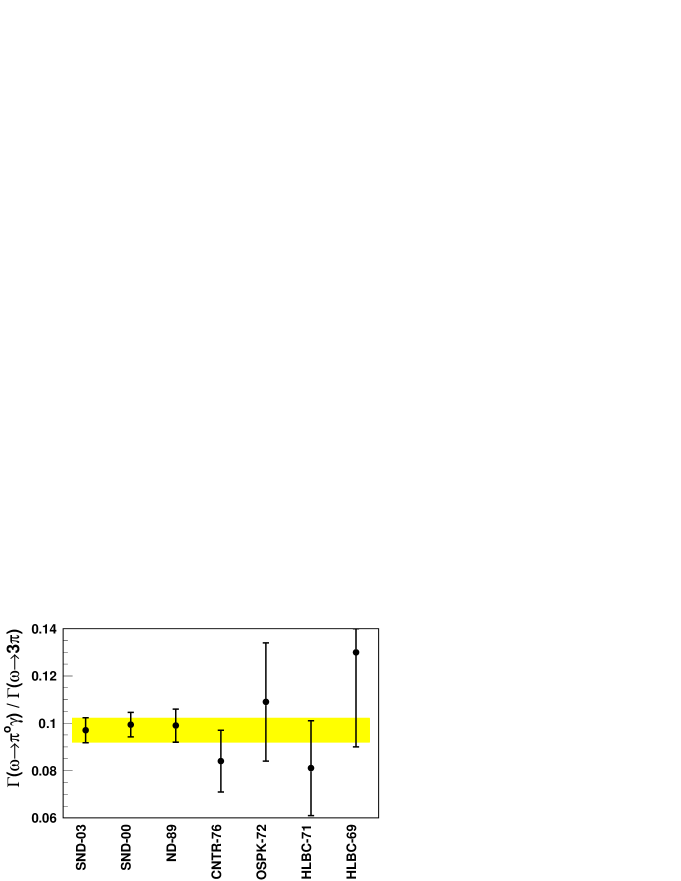
Using the SND result nb [37], the ratio of the partial widths of the and decays was calculated
This value agrees with PDG world average [1] and with other experimental results [45, 7, 44, 5, 46] (Fig.32).
Using , measured in this work, the SND result of the decay study [37] and PDG world average value [1], the partial width of the decay and the meson main decays branching ratios were obtained:
Comparison of these results with PDG data [1] is presented in Table .VI. The value of , calculated by using SND data, exceeds the world average by about 2 standard deviations (by 8%).
The and cross sections analysis show that the data cannot be described by a sum of , mesons and two , resonances (model 1). The data can be satisfactory described with the model 3, which takes into account form factors (16), with constrained partial widths growth with energy. The range parameter of this form factors was found to be
This agrees with expected vector meson effective “radius”: – GeV-1 [47]. The second error is due to model dependence. The model 2, which takes into account the transition, also satisfactory describes the experimental data. For parameters of this model, the following values were obtained:
Here the systematic error is due to model uncertainty. The above given value corresponds to the branching ratio . Assuming that the transition proceeds via the mixing mechanism, the following values of the process parameters are expected: and – nb. The value obtained in the analysis agrees with the expected one, while differs from the expected value by about two standard deviations.
In general, the model 2 seems to be more preferable than the model 3 due to the following considerations. The full data set for the and cross sections is in somewhat better agreement with the second model. Approximation of the cross section with the third model is poor (Fig.23). The phase value, obtained by the fit in the second model agrees with the theoretical prediction [39], while the phase , obtained by using the third model, exceeds the expected value (Fig.34). But, unfortunately, available experimental data are insufficient to make a strict conclusion about observation of the decay.
The parameter was found to be
The systematic error includes the systematic uncertainties in the detection efficiency and luminosity determinations, 33 nb in total, and the model dependence 17 nb. This value agrees with the results of our previous analysis [27, 2]. The SND result agrees also with other measurements [16, 15, 8, 18, 17, 14, 12, 11] and with PDG world average [48] (Fig.33).
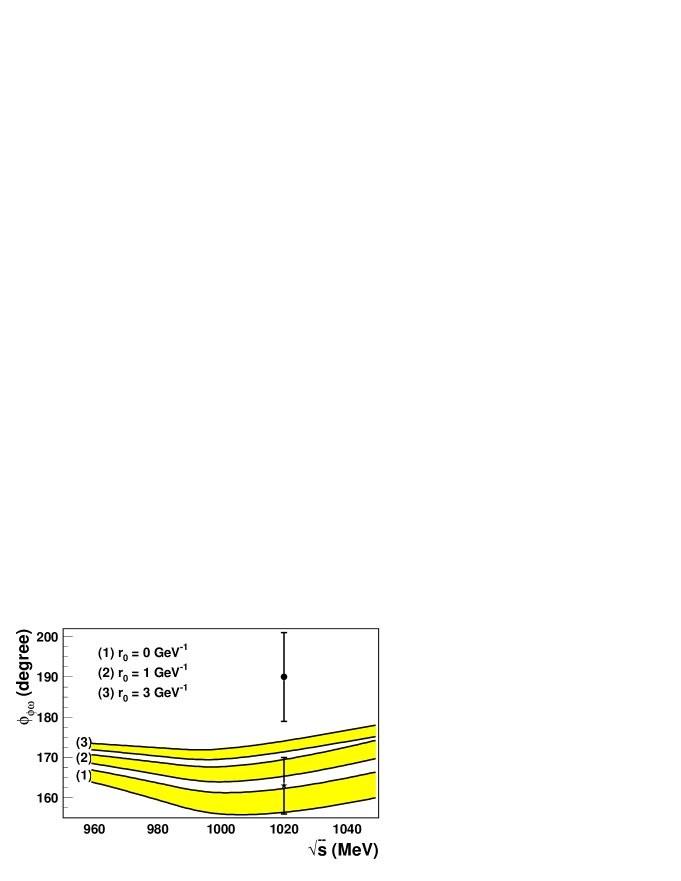
The fit within the models 2 and 1 (Tables IV and V) gave the result
The systematic error is related to model dependence. The obtained result is in agreement with the theoretical prediction (Fig.34) , which takes into account the mixing [39]. The fits with the model 3 (column 3 in Tables IV and V) gave the result degree, which exceeds the theoretical prediction.
The conventional view on the suppressed decay is that it proceeds through mixing, i.e. in the wave function of the -meson, which is dominated by quarks, there is an admixture of and quarks:
is mixing parameter. An alternative to the mixing is the direct decay. In Ref.[49, 36, 34, 50, 51] it was shown that there are no serious reasons to prefer the mixing to the direct transition, and methods of determination of the decay mechanism were suggested. In particular it was proposed in Ref.[51] to analyze the ratio. In this work the based mainly on the SND data was obtained, and in the Ref.[27] the was measured by SND. We performed the analysis of the and mesons lepton widths ratio based on the SND data only. To improve the accuracy of determination, the SND results of the decay studies [52] were used. The average of these measurements agrees with [27]. Assuming , one gets . The ratio of the leptonic widths is equal to
On the other hand this ratio can be written in the following form:
| (23) |
Using the obtained value, equation (23) and the nonrelativistic quark model prediction:
the mixing parameter was obtained. On the other hand, taking into account the equation , and assuming and , we found . Here and coupling constants were calculated by using the SND results obtained in this work and in Ref.[27], the phase space factors and were calculated assuming and . In this case the SND data agree with the mixing dominance in the decay.
The ratio is valid if wave function of the bound state at the origin behaves like , that is corresponds to the Coulomb-like nonrelativistic potential. But experimental data on the vector mesons , , , , leptonic widths support the behavior. Indeed, according to Ref.[53]:
where is the mean electric charge of the valence quarks inside the vector meson (, , , , ). In the case of , and in the absence of the mixing, the following ratios are expected:
| (24) | |||
| (25) |
Using the SND and values and the world average for the , and [1], we have found:
| (26) | |||
| (27) |
This ratios agree with the expected (24). If , then and by using Eq.(23) can be obtained. In this case the coupling constant of the direct decay is required to describe the experimental value of , indicating the direct transition as the main mechanism of the decay.
The following parameters were obtained from the fits (Table IV and V):
The decays mostly into and its electronic width is eV. The parameters were found to be
The resonance decays with approximately equal probability into and : , and it has the electronic width eV. The second errors shown above are due to the model uncertainty and possible bias between the SND and DM2 measurements. The and parameters, obtained in this work, are somewhat different from those obtained in our previous analysis [2]. In particular, the and full widths values decrease a little. This difference is attributed to the fact that a new data for the cross section below 1 GeV were added in the fits. Of cause, the obtained values are not precise measurements, they should be considered as rather approximate estimation of the and resonances main parameters.
In the energy region MeV, experimental points deviate from fitting curves (Fig.20). The difference can be attributed to inadequacy of the applied theoretical models, uncertainty of the and resonances contributions. Maybe more accurate consideration of the vector mesons mixing is required.
Analysis of the
Using the cross section, obtained with SND detector in this work and in Ref.[27, 2], the contribution to the anomalous magnetic moment of the muon, due to the intermediate state in the vacuum polarization, was calculated via dispersion integral:
where GeV, , is the QED kernel,
Here is the experimental cross section, and are corrections due to leptonic and hadronic vacuum polarizations. The was calculated according to Ref.[54] and was obtained by using total cross section.
The integral was evaluated by using the trapezoidal rule. To take into account the numerical integration errors, the correction method suggested in Ref.[55] was applied. As a result we obtained:
At present in BINP(Novosibirsk) the VEPP-2000 collider with the energy range from 0.36 to 2 GeV and luminosity up to cm-2s-1 (at GeV) is under construction [56]. The process studies in the energy region GeV will be continued in future experiments with SND detector at this new facility.
VIII Conclusion
The cross section of the process was measured in the SND experiment at the VEPP-2M collider in the energy region below 980 MeV. The measured cross section was analyzed in the framework of the generalized vector meson dominance model together with the and cross sections obtained by SND and DM2 in the energy region MeV. The -meson parameters: MeV, MeV and nb were obtained.
It was found that the experimental data cannot be described by a sum of , , and resonances contributions. This can be interpreted as manifestation of decay suppressed by -parity, with relative probability . The relative interference phase between the and mesons was found to be equal to: degree. These parameters of the decay are in agreement with the theoretical values expected from the mixing.
Analysis of the ratio and and coupling constants obtained in SND experiments indicates that the direct transition is preferable to mixing as the main mechanism of the decay.
Using the cross section, obtained with SND detector the contribution to the anomalous magnetic moment of the muon, due to the intermediate state in the vacuum polarization, was calculated:
acknowledgments
The authors are grateful to N.N.Achasov for useful discussions. The present work was supported in part by grant no. 78 1999 of Russian Academy of Science for young scientists and by Russian Science Support Foundation.
REFERENCES
- [1] K. Hagivara et al., Phys. Rev. D 66, 010001 (2002)
- [2] M.N. Achasov et al., Phys. Rev. D 66, 032001 (2002)
- [3] N.N. Achasov, A.A. Kozhevnikov, and G.N. Shestakov, Phys. Lett. 50B, 448 (1974) . N.N. Achasov, N.M. Budnev, A.A. Kozhevnikov, and G.N. Shestakov, Yad. Fiz. 23, 610 (1976) [Sov. J. Nucl. Phys. 23, 320 (1976)]; N.N. Achasov and G.N. Shestakov, Fiz. Elem. Chastits. At. Yadra 9, 48 (1978)
- [4] J.E. Augustin et al., Phys. Lett. B 28, 513 (1969)
- [5] D. Benaksas et al., Phys. Lett. B 42, 507 (1972)
- [6] L.M. Kurdadze, et al, JETP Lett. 36, 274 (1982) [Pisma Zh. Eksp. Teor. Fiz. 36, 221 (1982)]
- [7] V.M. Aulchenko et al., Phys. Lett. B 186, 432 (1987); S.I. Dolinsky et al., Z. Phys. C 42, 511 (1989)
- [8] S.I. Dolinsky et al., Phys. Rep. 202, 99 (1991)
- [9] L.M. Barkov et al., JETP Lett. 46, 164 (1987) [Pisma Zh. Eksp. Teor. Fiz. 46, 132 (1987)]
- [10] R.R. Akhmetshin et al., Phys. Lett. B 476, 33 (2000)
- [11] G. Cosme et al., Phys. Lett. B 48, 155 (1974)
- [12] G.Parrour et al., Phys. Lett. B 63, 357 (1976)
- [13] G.Parrour et al., Phys. Lett. B 63, 362 (1976)
- [14] A.D. Bukin et al., Yad. Fiz. 27, 976 (1978) [Sov. J. Nucl. Phys. 27, 516 (1978)]
- [15] R.R. Akhmetshin et al., Phys. Lett. B 364, 199 (1995)
- [16] R.R. Akhmetshin et al., Phys. Lett. B 434, 426 (1998)
- [17] A. Cordier et al., Nucl. Phys. B 172, 13 (1980)
- [18] L.M. Kurdadze et al., Preprint, Budker INP 84-7, Novosibirsk, 1984 (in Russian)
- [19] A.D. Bukin et al., Yad. Fiz. 50, 999 (1989) [Sov. J. Nucl. Phys. 50, 621 (1989)]
- [20] I.B. Vasserman et al., Yad. Fiz. 48, 753 (1988) [Sov. J. Nucl. Phys. 48, 480 (1988)]
- [21] G. Cosme et al., Nuc. Phys. B 152, 215 (1979)
- [22] B. Esposito et al., Lett. Nuovo Cim. 28, 195 (1980)
- [23] C. Bacci et al., Nuc. Phys. B 184, 31 (1981)
- [24] B. Delcourt et al., Phys. Lett 113B, 93 (1982)
- [25] A. Antonelli et al., Z. Phys., C 56, 15 (1992)
- [26] M.N. Achasov et al., Phys. Lett. B 462, 265 (1999)
- [27] M.N. Achasov et al., Phys. Rev. D 63, 072002 (2001)
- [28] M.N. Achasov et al., Phys. Rev. D 65, 032002 (2002)
- [29] M.N. Achasov et al., Nucl. Instr. and Meth. A 449, 125 (2000)
- [30] A.N. Skrinsky, in Proc. of Workshop on physics and detectors for DANE, Frascati, Italy, April 4-7, 1995, p.3
- [31] A.N. Skrinsky and Yu.M. Shatunov, Sov. Phys. Uspekhi 32 (1989) 548
- [32] M.N.Achasov et al., Phys. Lett. B 537, 201 (2002)
- [33] N.N. Achasov and A.A. Kozhevnikov, Phys. Rev. D 49, 5773 (1994) Yad. Fiz. 56, 191 (1993) [ Phys. Atom. Nucl. 56, 1261 (1993)] Int. J. Mod. Phys. A 9, 527 (1994)
- [34] N.N. Achasov and A.A. Kozhevnikov, Yad. Fiz. 55, 809 (1992) [Sov. J. Nucl. Phys. 55, 449 (1992)]; Int. J. Mod. Phys. A 7, 4825 (1992).
- [35] N.N. Achasov, A.A. Kozhevnikov, Phys. Rev. D 57, 4334 (1998) N.N. Achasov, A.A. Kozhevnikov, Yad. Fiz. 60, 2212 (1997) [Phys. At. Nucl. 60, 2029 (1997)]
- [36] N.N. Achasov et al., Yad. Fiz. 54, 1097 (1991) [Sov. J. Nucl. Phys. 54, 664 (1991)]; N.N. Achasov, et. al., Int. J. of Mod. Phys. A vol.7 No.14 3187 (1992)
- [37] M.N. Achasov et al., Phys. Lett. B 559, 171 (2003)
- [38] M.N. Achasov et al., Zh. Eksp. Teor. Fiz. 117, 22 (2000) [JETP 90, 17 (2000)]
- [39] N.N. Achasov, A.A. Kozhevnikov, Phys. Rev. D 61 054005 (2000) Yad. Fiz. 63, 2029 (2000) [ Phys. Atom. Nucl. 63, 1936 (2000)]
- [40] E.A. Kuraev, V.S. Fadin, Yad. Fiz. 41, 733 (1985) [Sov. J. Nucl. Phys. 41, 466 (1985)]
- [41] R.R.Akhmetshin et al., Phys. Lett. B 489, 125 (2000)
- [42] R. Wurzinger et al., Phys. Rev. C 51 443 (1995)
- [43] C. Amsler et al., Phys. Lett. B 327 425 (1994) C. Amsler et al., Phys. Lett. B 311 362 (1993) P. Weidenauer et al., Z. Phys C 59 387 (1993)
- [44] J. Keyne et al., Phys. Rev. D 14 28 (1976)
- [45] V.M. Aulchenko et al., Zh. Eksp. Teor. Fiz. 117, 1067 (2000) [V.M. Aulchenko et al., JETP 90, 927 (2000)]
- [46] A.B. Baldin et al., Yad. Fiz. 13, 1318 (1971) [Sov. J. Nucl. Phys. 13, 758 (1971)] F. Jacquet et al., Nuovo Cim. A 63 743 (1969)
- [47] T.Ericson and W.Wise, Pions and Nuclei, Clarendon Press, Oxford, 1988.
- [48] D.E. Groom et al., Eur. Phys. J. C 15, 1 (2000).
- [49] N.N. Achasov, A.A. Kozhevnikov, Phys. Lett. B 233, 474 (1989)
- [50] N.N. Achasov, A.A. Kozhevnikov, Yad. Fiz. 55, 3086 (1992) [ Sov. J. Nucl. Phys. 55, 1726 (1992)] Part. World 3, 125 (1993)
- [51] N.N. Achasov, A.A. Kozhevnikov, Phys. Rev. D 52 3119 (1995); Yad. Fiz. 59, 153 (1996) [Phys. Atom. Nucl., 59, 144 (1996)]
- [52] M.N. Achasov et al., Phys. Lett B 456, 304 (1999) Phys. Rev. Lett. 86, 1698 (2001)
- [53] Van Royan, V.F. Weisskopf, Nuovo Cim A 50, 617 (1967)
- [54] A.B. Arbuzov et al., JHEP 9710:001 (1997)
- [55] N.N. Achasov, A.V.Kiselev, Pisma Zh. Eksp. Teor. Fiz. 75, 643 (2002) [JETP Lett. 75, 527 (2002)]
- [56] Yu.M.Shatunov et al, Project of a new electron-positron collider VEPP-2000, in Proc. of the 2000 European Particle Acc. Conf., Vienna (2000), p.439
| (MeV) | (nb-1) | ||||
|---|---|---|---|---|---|
| 970 | 271.42.7 | 0.25440.0082 | 800 34 | 337 | 0.905 |
| 958 | 249.02.5 | 0.25440.0082 | 658 29 | 275 | 0.918 |
| 950 | 276.82.7 | 0.25400.0086 | 727 32 | 326 | 0.927 |
| 940 | 505.24.5 | 0.25850.0075 | 1203 41 | 5310 | 0.937 |
| 920 | 510.14.1 | 0.26990.0075 | 1292 42 | 52 8 | 0.96 |
| 880 | 397.63.6 | 0.32680.0032 | 1596 49 | 6119 | 1.094 |
| 840 | 711.06.1 | 0.33410.0029 | 5928 88 | 9615 | 1.356 |
| 820 | 329.03.0 | 0.33760.0022 | 5478 84 | 7413 | 1.491 |
| 810.40 | 223.72.1 | 0.33840.0019 | 5989 86 | 27 5 | 1.463 |
| 809.79 | 67.80.8 | 0.34120.0012 | 1899 48 | 5 1 | 1.464 |
| 800.40 | 235.62.2 | 0.33990.0014 | 11694121 | 4010 | 1.319 |
| 799.79 | 53.60.7 | 0.34350.0013 | 2679 57 | 6 2 | 1.308 |
| 794.40 | 160.81.6 | 0.34080.0012 | 13757129 | 19 4 | 1.165 |
| 793.79 | 54.80.7 | 0.34480.0010 | 5066 78 | 8 1 | 1.148 |
| 790.40 | 136.31.4 | 0.34140.0011 | 20228157 | 15 4 | 1.036 |
| 789.79 | 58.80.7 | 0.34580.0010 | 9054104 | 7 1 | 1.015 |
| 786.40 | 177.61.7 | 0.34200.0010 | 51265251 | 27 5 | 0.895 |
| 786.18 | 20.40.4 | 0.34500.0037 | 6226 88 | 3 1 | 0.887 |
| 785.79 | 76.90.9 | 0.34660.0010 | 24876175 | 10 1 | 0.874 |
| 785.40 | 222.42.1 | 0.34220.0010 | 75531304 | 33 7 | 0.861 |
| 784.40 | 285.32.7 | 0.34240.0010 | 111828371 | 34 5 | 0.830 |
| 783.79 | 78.10.9 | 0.34700.0010 | 33325201 | 7 3 | 0.814 |
| 783.40 | 288.52.6 | 0.34240.0010 | 122114387 | 8010 | 0.804 |
| 782.90 | 122.31.2 | 0.34770.0012 | 54830261 | 40 7 | 0.794 |
| 782.79 | 85.20.9 | 0.34730.0010 | 37956217 | 16 3 | 0.792 |
| 782.40 | 300.92.7 | 0.34260.0010 | 127682397 | 3614 | 0.785 |
| 782.13 | 15.10.3 | 0.35340.0037 | 6452 89 | 4 2 | 0.781 |
| 781.79 | 372.53.3 | 0.34750.0010 | 155515436 | 4917 | 0.777 |
| 781.40 | 220.42.1 | 0.34270.0010 | 85611324 | 8510 | 0.773 |
| 780.40 | 169.21.6 | 0.34290.0010 | 56031262 | 10 1 | 0.767 |
| 778.11 | 20.90.4 | 0.35340.0031 | 4344 72 | 8 4 | 0.767 |
| 780.79 | 131.91.3 | 0.34770.0010 | 48230241 | 42 6 | 0.769 |
| 779.90 | 114.71.2 | 0.34570.0014 | 34860207 | 14 5 | 0.766 |
| 779.79 | 44.70.6 | 0.34780.0010 | 13099126 | 1 1 | 0.766 |
| 778.40 | 159.61.6 | 0.34320.0011 | 34568207 | 21 3 | 0.767 |
| 777.79 | 79.20.9 | 0.34830.0010 | 14700134 | 10 4 | 0.768 |
| 774.40 | 162.21.6 | 0.34390.0012 | 14157131 | 21 6 | 0.779 |
| 773.79 | 65.10.8 | 0.34920.0010 | 4952 78 | 10 1 | 0.781 |
| 770.40 | 253.52.3 | 0.34450.0013 | 10959116 | 33 7 | 0.792 |
| 769.79 | 45.90.6 | 0.35000.0011 | 1656 44 | 10 1 | 0.794 |
| 764.40 | 222.82.1 | 0.34550.0015 | 4242 71 | 31 7 | 0.806 |
| 763.79 | 40.20.6 | 0.35120.0013 | 724 30 | 5 1 | 0.808 |
| 760.40 | 208.22.0 | 0.34610.0017 | 2658 57 | 19 6 | 0.814 |
| 759.79 | 43.50.6 | 0.35200.0014 | 576 28 | 7 3 | 0.815 |
| 750.40 | 174.61.7 | 0.34790.0021 | 1008 37 | 26 7 | 0.826 |
| 749.79 | 52.20.7 | 0.35410.0018 | 251 18 | 14 5 | 0.828 |
| 720 | 584.15.0 | 0.35630.0069 | 652 30 | 60 8 | 0.848 |
| 690 | 174.41.6 | 0.35260.0069 | 58 11 | 21 5 | 0.860 |
| 660 | 281.12.5 | 0.35750.0070 | 40 11 | 29 4 | 0.862 |
| 630 | 120.11.2 | 0.35320.0068 | 0 5 | 14 3 | 0.865 |
| 600 | 90.60.9 | 0.32980.0066 | -2 6 | 15 4 | 0.868 |
| 580 | 12.70.2 | 0.35610.0069 | 2 4 | 2 1 | 0.867 |
| 560 | 11.20.2 | 0.33690.0068 | -1 1 | 1 1 | 0.867 |
| 540 | 12.10.2 | 0.31560.0067 | -4 2 | 4 2 | 0.867 |
| 520 | 7.20.2 | 0.28660.0065 | 0 | 0 | 0.861 |
| 500 | 8.00.2 | 0.22780.0060 | 0 1 | 1 1 | 0.856 |
| 480 | 13.40.2 | 0.20300.0058 | 0 | 0 | 0.852 |
| 440 | 6.20.1 | 0.01830.0019 | 0 | 0 | 0.820 |
| (MeV) | ||
|---|---|---|
| 750 | 135042 | 0.9950.034 |
| 720 | 70032 | 0.9990.054 |
| 690 | 6611 | 0.9560.209 |
| 660 | 1710 | 2.5621.114 |
| (MeV) | (nb) | (nb) | (nb) | (nb) | (nb) |
|---|---|---|---|---|---|
| 970.00 | 12.82 0.70 | 0.32 | 0.05 | 0.58 | 0.66 |
| 958.00 | 11.33 0.64 | 0.28 | 0.05 | 0.51 | 0.58 |
| 950.00 | 11.17 0.62 | 0.29 | 0.06 | 0.50 | 0.58 |
| 940.00 | 9.83 0.41 | 0.26 | 0.05 | 0.44 | 0.52 |
| 920.00 | 9.82 0.39 | 0.24 | 0.04 | 0.44 | 0.50 |
| 880.00 | 11.22 0.36 | 0.26 | 0.03 | 0.38 | 0.46 |
| 840.00 | 18.77 0.33 | 0.18 | 0.21 | 0.64 | 0.70 |
| 820.00 | 32.93 0.58 | 0.27 | 0.34 | 1.12 | 1.20 |
| 810.40 | 53.84 1.01 | 0.15 | 0.41 | 1.83 | 1.88 |
| 809.79 | 55.81 1.60 | 0.09 | 0.42 | 1.90 | 1.95 |
| 800.40 | 110.42 1.82 | 0.23 | 0.42 | 3.75 | 3.78 |
| 799.79 | 111.09 2.98 | 0.15 | 0.41 | 3.78 | 3.80 |
| 794.40 | 215.25 3.91 | 0.18 | 0.31 | 7.32 | 7.33 |
| 793.79 | 233.54 5.48 | 0.22 | 0.32 | 7.94 | 7.95 |
| 790.40 | 419.31 8.24 | 0.19 | 0.56 | 14.26 | 14.27 |
| 789.79 | 437.9110.55 | 0.20 | 0.37 | 14.89 | 14.89 |
| 786.40 | 943.6319.81 | 0.30 | 1.45 | 32.08 | 32.12 |
| 786.18 | 998.9224.90 | 0.29 | 0.61 | 33.96 | 33.97 |
| 785.79 | 1068.3923.36 | 0.26 | 0.86 | 36.33 | 36.34 |
| 785.40 | 1154.2922.45 | 0.30 | 1.91 | 39.25 | 39.29 |
| 784.40 | 1382.6921.80 | 0.25 | 2.44 | 47.01 | 47.08 |
| 783.79 | 1514.9722.99 | 0.19 | 0.74 | 51.51 | 51.51 |
| 783.40 | 1542.5817.29 | 0.61 | 2.16 | 52.45 | 52.50 |
| 782.90 | 1627.5618.88 | 0.71 | 0.32 | 55.34 | 55.34 |
| 782.79 | 1624.7720.43 | 0.41 | 0.47 | 55.24 | 55.25 |
| 782.40 | 1584.2117.63 | 0.27 | 2.59 | 53.86 | 53.93 |
| 782.13 | 1552.8540.68 | 0.58 | 0.46 | 52.80 | 52.80 |
| 781.79 | 1550.8021.87 | 0.29 | 0.44 | 52.73 | 52.73 |
| 781.40 | 1470.9425.52 | 0.88 | 2.49 | 50.01 | 50.08 |
| 780.79 | 1369.1128.77 | 0.72 | 0.51 | 46.55 | 46.56 |
| 780.40 | 1261.0628.76 | 0.14 | 2.18 | 42.88 | 42.93 |
| 779.90 | 1146.8928.79 | 0.28 | 0.43 | 38.99 | 39.00 |
| 779.79 | 1098.8530.58 | 0.05 | 0.40 | 37.36 | 37.36 |
| 778.40 | 822.8121.45 | 0.30 | 1.52 | 27.98 | 28.02 |
| 778.11 | 765.4120.01 | 0.85 | 0.23 | 26.02 | 26.04 |
| 777.79 | 693.0819.36 | 0.28 | 0.23 | 23.56 | 23.57 |
| 774.40 | 325.90 7.86 | 0.29 | 0.69 | 11.08 | 11.11 |
| 773.79 | 278.72 7.87 | 0.34 | 0.08 | 9.48 | 9.48 |
| 770.40 | 158.58 3.36 | 0.29 | 0.37 | 5.39 | 5.41 |
| 769.79 | 129.74 4.55 | 0.47 | 0.06 | 4.41 | 4.44 |
| 764.40 | 68.48 1.58 | 0.30 | 0.26 | 2.33 | 2.36 |
| 763.79 | 63.43 2.87 | 0.26 | 0.06 | 2.16 | 2.17 |
| 760.40 | 45.38 1.18 | 0.19 | 0.13 | 1.54 | 1.56 |
| 759.79 | 46.14 2.34 | 0.34 | 0.06 | 1.57 | 1.61 |
| 750.40 | 20.12 0.78 | 0.31 | 0.08 | 0.68 | 0.76 |
| 749.79 | 16.40 1.22 | 0.55 | 0.04 | 0.56 | 0.78 |
| 720.00 | 3.69 0.19 | 0.20 | 0.01 | 0.13 | 0.24 |
| 690.00 | 1.10 0.21 | 0.24 | 0.00 | 0.04 | 0.24 |
| 660.00 | 0.46 0.13 | 0.20 | 0.00 | 0.02 | 0.20 |
| 630.0 | (90% CL) | ||||
| 600.0 | (90% CL) | ||||
| 580.0 | (90% CL) | ||||
| 560.0 | (90% CL) | ||||
| 540.0 | (90% CL) | ||||
| 520.0 | (90% CL) | ||||
| 500.0 | (90% CL) | ||||
| 480.0 | (90% CL) | ||||
| 440.0 | (90% CL) |
| 1 | 2 | 3 | |
|---|---|---|---|
| MeV | 782.750.08 | 782.720.08 | 782.710.08 |
| MeV | 8.600.040.01 | 8.730.040.02 | 8.630.04 |
| nb | 160971 | 1624105 | 16107 3 |
| , nb | 64564 | 64576 | 65887 |
| , degree | 16124 | 1634 | 18746 |
| , GeV-1 | 2.60.2 | ||
| , MeV | 13582045 | 146070 | 14103060 |
| , MeV | 50080 | 1120200 | 6174095 |
| , nb | 5.70.5 | 3.70.70.4 | 5.00.20.4 |
| , MeV | 180820 | 17605040 | 1750206 |
| , MeV | 807213 | 54050 | 3735015 |
| , nb | 1.480.400.46 | 2.40.70.9 | 2.70.41.3 |
| , nb | 1.540.300.45 | 1.80.40.5 | 2.20.30.4 |
| nb | 0.130.02 | ||
| , degree | -1377 | ||
| (80120)/49 | (5662)/49 | (4550)/49 | |
| (2146)/6 | (13.616.4)/6 | (7.311.3)/6 | |
| (6692)/67 | (4956)/67 | (5867)/67 | |
| (2237)/18 | (2244)/18 | (2742)/18 | |
| (1115)/18 | 10/18 | (2326)/18 | |
| (182260)/152 | (137170)/152 | (156180) /152 |
| 1 | 2 | 3 | |
|---|---|---|---|
| MeV | 782.760.08 | 782.720.08 | 782.740.08 |
| MeV | 8.630.040.01 | 8.710.040.01 | 8.650.04 |
| nb | 160871 | 1618102 | 161272 |
| , nb | 65364 | 65285 | 665108 |
| , degree | 16633 | 16534 | 19565 |
| , GeV-1 | 2.30.2 | ||
| , MeV | 127328 | 138660 | 13003030 |
| , MeV | 40573 | 827186 | 5955050 |
| , nb | 6.90.40.7 | 5.01.00.5 | 5.60.30.5 |
| , MeV | 181932 | 177312 | 1758205 |
| , MeV | 679121 | 50535 | 3455010 |
| , nb | 5.62.01.1 | 5.71.70.6 | 7.61.61.6 |
| , nb | 1.20.30.2 | 1.50.20.1 | 1.70.20.1 |
| nb | 0.0830.009 | ||
| , degree | -1348 | ||
| (6063)/49 | (5255)/49 | (4042)/49 | |
| (1016.6)/6 | (11.913)/6 | (4.66.3)/6 | |
| (6974)/67 | (5152)/67 | (5256)/67 | |
| – | – | – | |
| (1114)/18 | 10/18 | 23/18 | |
| (139149)/134 | (112118)/134 | (115120) /134 |
| SND | PDG-2002 | |
|---|---|---|