Measurement of the Branching Fractions for the Exclusive Decays of
and to
B. Aubert
R. Barate
D. Boutigny
J.-M. Gaillard
A. Hicheur
Y. Karyotakis
J. P. Lees
P. Robbe
V. Tisserand
A. Zghiche
Laboratoire de Physique des Particules, F-74941 Annecy-le-Vieux, France
A. Palano
A. Pompili
Università di Bari, Dipartimento di Fisica and INFN, I-70126 Bari, Italy
J. C. Chen
N. D. Qi
G. Rong
P. Wang
Y. S. Zhu
Institute of High Energy Physics, Beijing 100039, China
G. Eigen
I. Ofte
B. Stugu
University of Bergen, Inst. of Physics, N-5007 Bergen, Norway
G. S. Abrams
A. W. Borgland
A. B. Breon
D. N. Brown
J. Button-Shafer
R. N. Cahn
E. Charles
C. T. Day
M. S. Gill
A. V. Gritsan
Y. Groysman
R. G. Jacobsen
R. W. Kadel
J. Kadyk
L. T. Kerth
Yu. G. Kolomensky
J. F. Kral
G. Kukartsev
C. LeClerc
M. E. Levi
G. Lynch
L. M. Mir
P. J. Oddone
T. J. Orimoto
M. Pripstein
N. A. Roe
A. Romosan
M. T. Ronan
V. G. Shelkov
A. V. Telnov
W. A. Wenzel
Lawrence Berkeley National Laboratory and University of California, Berkeley, CA 94720, USA
T. J. Harrison
C. M. Hawkes
D. J. Knowles
R. C. Penny
A. T. Watson
N. K. Watson
University of Birmingham, Birmingham, B15 2TT, United Kingdom
T. Deppermann
K. Goetzen
H. Koch
B. Lewandowski
M. Pelizaeus
K. Peters
H. Schmuecker
M. Steinke
Ruhr Universität Bochum, Institut für Experimentalphysik 1, D-44780 Bochum, Germany
N. R. Barlow
J. T. Boyd
N. Chevalier
W. N. Cottingham
C. Mackay
F. F. Wilson
University of Bristol, Bristol BS8 1TL, United Kingdom
C. Hearty
T. S. Mattison
J. A. McKenna
D. Thiessen
University of British Columbia, Vancouver, BC, Canada V6T 1Z1
P. Kyberd
A. K. McKemey
Brunel University, Uxbridge, Middlesex UB8 3PH, United Kingdom
V. E. Blinov
A. D. Bukin
V. B. Golubev
V. N. Ivanchenko
E. A. Kravchenko
A. P. Onuchin
S. I. Serednyakov
Yu. I. Skovpen
E. P. Solodov
A. N. Yushkov
Budker Institute of Nuclear Physics, Novosibirsk 630090, Russia
D. Best
M. Chao
D. Kirkby
A. J. Lankford
M. Mandelkern
S. McMahon
R. K. Mommsen
W. Roethel
D. P. Stoker
University of California at Irvine, Irvine, CA 92697, USA
C. Buchanan
University of California at Los Angeles, Los Angeles, CA 90024, USA
D. del Re
H. K. Hadavand
E. J. Hill
D. B. MacFarlane
H. P. Paar
Sh. Rahatlou
U. Schwanke
V. Sharma
University of California at San Diego, La Jolla, CA 92093, USA
J. W. Berryhill
C. Campagnari
B. Dahmes
N. Kuznetsova
S. L. Levy
O. Long
A. Lu
M. A. Mazur
J. D. Richman
W. Verkerke
University of California at Santa Barbara, Santa Barbara, CA 93106, USA
J. Beringer
A. M. Eisner
C. A. Heusch
W. S. Lockman
T. Schalk
R. E. Schmitz
B. A. Schumm
A. Seiden
M. Turri
W. Walkowiak
D. C. Williams
M. G. Wilson
University of California at Santa Cruz, Institute for Particle Physics, Santa Cruz, CA 95064, USA
J. Albert
E. Chen
M. P. Dorsten
G. P. Dubois-Felsmann
A. Dvoretskii
D. G. Hitlin
I. Narsky
F. C. Porter
A. Ryd
A. Samuel
S. Yang
California Institute of Technology, Pasadena, CA 91125, USA
S. Jayatilleke
G. Mancinelli
B. T. Meadows
M. D. Sokoloff
University of Cincinnati, Cincinnati, OH 45221, USA
T. Abe
T. Barillari
F. Blanc
P. Bloom
P. J. Clark
W. T. Ford
U. Nauenberg
A. Olivas
P. Rankin
J. Roy
J. G. Smith
W. C. van Hoek
L. Zhang
University of Colorado, Boulder, CO 80309, USA
J. L. Harton
T. Hu
A. Soffer
W. H. Toki
R. J. Wilson
J. Zhang
Colorado State University, Fort Collins, CO 80523, USA
D. Altenburg
T. Brandt
J. Brose
T. Colberg
M. Dickopp
R. S. Dubitzky
A. Hauke
H. M. Lacker
E. Maly
R. Müller-Pfefferkorn
R. Nogowski
S. Otto
K. R. Schubert
R. Schwierz
B. Spaan
L. Wilden
Technische Universität Dresden, Institut für Kern- und Teilchenphysik, D-01062 Dresden, Germany
D. Bernard
G. R. Bonneaud
F. Brochard
J. Cohen-Tanugi
Ch. Thiebaux
G. Vasileiadis
M. Verderi
Ecole Polytechnique, LLR, F-91128 Palaiseau, France
A. Khan
D. Lavin
F. Muheim
S. Playfer
J. E. Swain
J. Tinslay
University of Edinburgh, Edinburgh EH9 3JZ, United Kingdom
D. Bettoni
C. Bozzi
R. Calabrese
L. Piemontese
A. Sarti
Università di Ferrara, Dipartimento di Fisica and INFN, I-44100 Ferrara, Italy
E. Treadwell
Florida A&M University, Tallahassee, FL 32307, USA
F. Anulli
Also with Università di Perugia, Perugia, Italy
R. Baldini-Ferroli
M. E. Biagini
A. Calcaterra
R. de Sangro
D. Falciai
G. Finocchiaro
P. Patteri
I. M. Peruzzi
Also with Università di Perugia, Perugia, Italy
M. Piccolo
A. Zallo
Laboratori Nazionali di Frascati dell’INFN, I-00044 Frascati, Italy
A. Buzzo
R. Contri
G. Crosetti
M. Lo Vetere
M. Macri
M. R. Monge
S. Passaggio
F. C. Pastore
C. Patrignani
E. Robutti
A. Santroni
S. Tosi
Università di Genova, Dipartimento di Fisica and INFN, I-16146 Genova, Italy
S. Bailey
M. Morii
Harvard University, Cambridge, MA 02138, USA
G. J. Grenier
S.-J. Lee
U. Mallik
University of Iowa, Iowa City, IA 52242, USA
J. Cochran
H. B. Crawley
J. Lamsa
W. T. Meyer
S. Prell
E. I. Rosenberg
J. Yi
Iowa State University, Ames, IA 50011-3160, USA
M. Davier
G. Grosdidier
A. Höcker
S. Laplace
F. Le Diberder
V. Lepeltier
A. M. Lutz
T. C. Petersen
S. Plaszczynski
M. H. Schune
L. Tantot
G. Wormser
Laboratoire de l’Accélérateur Linéaire, F-91898 Orsay, France
R. M. Bionta
V. Brigljević
C. H. Cheng
D. J. Lange
D. M. Wright
Lawrence Livermore National Laboratory, Livermore, CA 94550, USA
A. J. Bevan
J. R. Fry
E. Gabathuler
R. Gamet
M. Kay
D. J. Payne
R. J. Sloane
C. Touramanis
University of Liverpool, Liverpool L69 3BX, United Kingdom
M. L. Aspinwall
W. Bhimji
D. A. Bowerman
P. D. Dauncey
U. Egede
I. Eschrich
G. W. Morton
J. A. Nash
P. Sanders
G. P. Taylor
University of London, Imperial College, London, SW7 2BW, United Kingdom
J. J. Back
P. F. Harrison
H. W. Shorthouse
P. Strother
P. B. Vidal
Queen Mary, University of London, E1 4NS, United Kingdom
G. Cowan
H. U. Flaecher
S. George
M. G. Green
A. Kurup
C. E. Marker
T. R. McMahon
S. Ricciardi
F. Salvatore
G. Vaitsas
M. A. Winter
University of London, Royal Holloway and Bedford New College, Egham, Surrey TW20 0EX, United Kingdom
D. Brown
C. L. Davis
University of Louisville, Louisville, KY 40292, USA
J. Allison
R. J. Barlow
A. C. Forti
P. A. Hart
F. Jackson
G. D. Lafferty
A. J. Lyon
J. H. Weatherall
J. C. Williams
University of Manchester, Manchester M13 9PL, United Kingdom
A. Farbin
A. Jawahery
D. Kovalskyi
C. K. Lae
V. Lillard
D. A. Roberts
University of Maryland, College Park, MD 20742, USA
G. Blaylock
C. Dallapiccola
K. T. Flood
S. S. Hertzbach
R. Kofler
V. B. Koptchev
T. B. Moore
S. Saremi
H. Staengle
S. Willocq
University of Massachusetts, Amherst, MA 01003, USA
R. Cowan
G. Sciolla
F. Taylor
R. K. Yamamoto
Massachusetts Institute of Technology, Laboratory for Nuclear Science, Cambridge, MA 02139, USA
D. J. J. Mangeol
M. Milek
P. M. Patel
McGill University, Montréal, QC, Canada H3A 2T8
A. Lazzaro
F. Palombo
Università di Milano, Dipartimento di Fisica and INFN, I-20133 Milano, Italy
J. M. Bauer
L. Cremaldi
V. Eschenburg
R. Godang
R. Kroeger
J. Reidy
D. A. Sanders
D. J. Summers
H. W. Zhao
University of Mississippi, University, MS 38677, USA
C. Hast
P. Taras
Université de Montréal, Laboratoire René J. A. Lévesque, Montréal, QC, Canada H3C 3J7
H. Nicholson
Mount Holyoke College, South Hadley, MA 01075, USA
C. Cartaro
N. Cavallo
G. De Nardo
F. Fabozzi
Also with Università della Basilicata, Potenza, Italy
C. Gatto
L. Lista
P. Paolucci
D. Piccolo
C. Sciacca
Università di Napoli Federico II, Dipartimento di Scienze Fisiche and INFN, I-80126, Napoli, Italy
M. A. Baak
G. Raven
NIKHEF, National Institute for Nuclear Physics and High Energy Physics, 1009 DB Amsterdam, The Netherlands
J. M. LoSecco
University of Notre Dame, Notre Dame, IN 46556, USA
T. A. Gabriel
Oak Ridge National Laboratory, Oak Ridge, TN 37831, USA
B. Brau
T. Pulliam
Ohio State University, Columbus, OH 43210, USA
J. Brau
R. Frey
M. Iwasaki
C. T. Potter
N. B. Sinev
D. Strom
E. Torrence
University of Oregon, Eugene, OR 97403, USA
F. Colecchia
A. Dorigo
F. Galeazzi
M. Margoni
M. Morandin
M. Posocco
M. Rotondo
F. Simonetto
R. Stroili
G. Tiozzo
C. Voci
Università di Padova, Dipartimento di Fisica and INFN, I-35131 Padova, Italy
M. Benayoun
H. Briand
J. Chauveau
P. David
Ch. de la Vaissière
L. Del Buono
O. Hamon
Ph. Leruste
J. Malcles
J. Ocariz
M. Pivk
L. Roos
J. Stark
S. T’Jampens
Universités Paris VI et VII, Lab de Physique Nucléaire H. E., F-75252 Paris, France
P. F. Manfredi
V. Re
Università di Pavia, Dipartimento di Elettronica and INFN, I-27100 Pavia, Italy
L. Gladney
Q. H. Guo
J. Panetta
University of Pennsylvania, Philadelphia, PA 19104, USA
C. Angelini
G. Batignani
S. Bettarini
M. Bondioli
F. Bucci
G. Calderini
M. Carpinelli
F. Forti
M. A. Giorgi
A. Lusiani
G. Marchiori
F. Martinez-Vidal
Also with IFIC, Instituto de Física Corpuscular, CSIC-Universidad de Valencia, Valencia, Spain
M. Morganti
N. Neri
E. Paoloni
M. Rama
G. Rizzo
F. Sandrelli
J. Walsh
Università di Pisa, Dipartimento di Fisica, Scuola Normale Superiore and INFN, I-56127 Pisa, Italy
M. Haire
D. Judd
K. Paick
D. E. Wagoner
Prairie View A&M University, Prairie View, TX 77446, USA
N. Danielson
P. Elmer
C. Lu
V. Miftakov
J. Olsen
A. J. S. Smith
E. W. Varnes
Princeton University, Princeton, NJ 08544, USA
F. Bellini
Università di Roma La Sapienza, Dipartimento di Fisica and INFN, I-00185 Roma, Italy
G. Cavoto
Princeton University, Princeton, NJ 08544, USA
Università di Roma La Sapienza, Dipartimento di Fisica and INFN, I-00185 Roma, Italy
R. Faccini
University of California at San Diego, La Jolla, CA 92093, USA
Università di Roma La Sapienza, Dipartimento di Fisica and INFN, I-00185 Roma, Italy
F. Ferrarotto
F. Ferroni
M. Gaspero
E. Leonardi
M. A. Mazzoni
S. Morganti
M. Pierini
G. Piredda
F. Safai Tehrani
M. Serra
C. Voena
Università di Roma La Sapienza, Dipartimento di Fisica and INFN, I-00185 Roma, Italy
S. Christ
G. Wagner
R. Waldi
Universität Rostock, D-18051 Rostock, Germany
T. Adye
N. De Groot
B. Franek
N. I. Geddes
G. P. Gopal
E. O. Olaiya
S. M. Xella
Rutherford Appleton Laboratory, Chilton, Didcot, Oxon, OX11 0QX, United Kingdom
R. Aleksan
S. Emery
A. Gaidot
S. F. Ganzhur
P.-F. Giraud
G. Hamel de Monchenault
W. Kozanecki
M. Langer
G. W. London
B. Mayer
G. Schott
G. Vasseur
Ch. Yeche
M. Zito
DAPNIA, Commissariat à l’Energie Atomique/Saclay, F-91191 Gif-sur-Yvette, France
M. V. Purohit
A. W. Weidemann
F. X. Yumiceva
University of South Carolina, Columbia, SC 29208, USA
D. Aston
R. Bartoldus
N. Berger
A. M. Boyarski
O. L. Buchmueller
M. R. Convery
D. P. Coupal
D. Dong
J. Dorfan
D. Dujmic
W. Dunwoodie
R. C. Field
T. Glanzman
S. J. Gowdy
E. Grauges-Pous
T. Hadig
V. Halyo
T. Hryn’ova
W. R. Innes
C. P. Jessop
M. H. Kelsey
P. Kim
M. L. Kocian
U. Langenegger
D. W. G. S. Leith
S. Luitz
V. Luth
H. L. Lynch
H. Marsiske
S. Menke
R. Messner
D. R. Muller
C. P. O’Grady
V. E. Ozcan
A. Perazzo
M. Perl
S. Petrak
B. N. Ratcliff
S. H. Robertson
A. Roodman
A. A. Salnikov
R. H. Schindler
J. Schwiening
G. Simi
A. Snyder
A. Soha
J. Stelzer
D. Su
M. K. Sullivan
H. A. Tanaka
J. Va’vra
S. R. Wagner
M. Weaver
A. J. R. Weinstein
W. J. Wisniewski
D. H. Wright
C. C. Young
Stanford Linear Accelerator Center, Stanford, CA 94309, USA
P. R. Burchat
T. I. Meyer
C. Roat
Stanford University, Stanford, CA 94305-4060, USA
S. Ahmed
M. S. Alam
J. A. Ernst
F. R. Wappler
State Univ. of New York, Albany, NY 12222, USA
W. Bugg
M. Krishnamurthy
S. M. Spanier
University of Tennessee, Knoxville, TN 37996, USA
R. Eckmann
H. Kim
J. L. Ritchie
R. F. Schwitters
University of Texas at Austin, Austin, TX 78712, USA
J. M. Izen
I. Kitayama
X. C. Lou
S. Ye
University of Texas at Dallas, Richardson, TX 75083, USA
F. Bianchi
M. Bona
F. Gallo
D. Gamba
Università di Torino, Dipartimento di Fisica Sperimentale and INFN, I-10125 Torino, Italy
C. Borean
L. Bosisio
G. Della Ricca
S. Dittongo
S. Grancagnolo
L. Lanceri
P. Poropat
L. Vitale
G. Vuagnin
Università di Trieste, Dipartimento di Fisica and INFN, I-34127 Trieste, Italy
R. S. Panvini
Vanderbilt University, Nashville, TN 37235, USA
Sw. Banerjee
C. M. Brown
D. Fortin
P. D. Jackson
R. Kowalewski
J. M. Roney
University of Victoria, Victoria, BC, Canada V8W 3P6
H. R. Band
S. Dasu
M. Datta
A. M. Eichenbaum
H. Hu
J. R. Johnson
P. E. Kutter
H. Li
R. Liu
F. Di Lodovico
A. Mihalyi
A. K. Mohapatra
Y. Pan
R. Prepost
S. J. Sekula
J. H. von Wimmersperg-Toeller
J. Wu
S. L. Wu
Z. Yu
University of Wisconsin, Madison, WI 53706, USA
H. Neal
Yale University, New Haven, CT 06511, USA
Abstract
Abstract
We report the observation of 82357 and 97065 decays
to doubly charmed final states , where
and are fully reconstructed and is either a or
a . We use a sample of million events
collected between 1999 and 2002 with the BABAR detector at the PEP-II storage
ring at the Stanford Linear Accelerator Center.
The 22 possible decays to are reconstructed
exclusively and the corresponding branching fractions or limits are
determined. The branching fractions of the and of the to
are found to be
,
.
A search for decays to orbitally excited states,
()
is also performed.
The inconsistency between the measured rate and the
rate of semileptonic decays has been a long-standing problem in
physics.
Until 1994, it was believed that the transition was
dominated by decays , with some smaller contributions
from decays to charmonium states and to charmed strange baryons. Therefore,
the branching fraction was computed from the inclusive
, , and branching
fractions, leading to
browder2 .
Theoretical calculations are unable to simultaneously describe this low
branching fraction and the semileptonic branching fraction of the
meson bigi .
As a possible explanation of this problem, it has been
conjectured buchalla that is
larger and that decays of the type
(where can be either a , , , or )
could contribute significantly to the decay rate.
This might also include possible decays to orbitally-excited mesons,
, followed by .
Experimental evidence in support of this picture has been published in the
past few years. This evidence includes the measured branching fraction for
wrong-sign production, averaged over charged and neutral mesons,
by CLEO cleoupv [], and
the observation of a small number of fully reconstructed decays
, both by CLEO cleoddk and ALEPH alephddk . More recently,
BABARbabarddk and Belle belleddk have reported some
preliminary results on the evidence for transitions
with much larger data sets.
decays can proceed through two different amplitudes: external
-emission amplitudes and internal -emission amplitudes (also called
color-suppressed amplitudes). Some decay modes proceed purely through one
of these amplitudes while others can proceed through
both. Figure 1 shows
the possible types for decays. In BABAR, the large
data sets now available allow comprehensive investigations of these
transitions. In this paper, we present measurements
of or limits on the branching fractions for all the possible
and
decay modes, using events in
which both mesons are fully reconstructed. Charge conjugate reactions
are assumed throughout this paper and branching fractions are averaged
accordingly.
Figure 1: Top: internal -emission diagram for the decays
.
Bottom: external -emission diagram for the decays
.
II The BABAR detector and dataset
The study reported here uses 75.9 of data collected at the
resonance
with the BABAR detector at the PEP-II asymmetric-energy factory,
corresponding to
pairs.
The BABAR detector is a large-acceptance solenoidal
spectrometer (1.5)
described in detail elsewhere ref:babar .
The analysis described below makes use of charged track and
reconstruction and charged particle identification.
Charged particle trajectories are measured by a 5-layer double-sided
silicon vertex tracker (SVT) and a 40-layer drift chamber (DCH), which also
provide ionization measurements () used for particle
identification. For charged tracks with , the measured transverse momentum
with respect to the beam axis () has a resolution
such that
(1)
where is measured in .
Photons and electrons are measured in the electromagnetic
calorimeter (EMC). The EMC consists of 6580 Thallium-doped CsI crystals,
which instrument the barrel and forward endcap; the crystals are
arranged
in a quasi-projective geometry. The electromagnetic
calorimeter resolution can be expressed as
(2)
where the energy is measured in .
Charged particle identification is provided by the average energy loss ()
in the tracking devices and by an internally reflecting ring-imaging Cherenkov
detector (DIRC). The DIRC comprises 144 quartz bars, divided into 12
sectors, which transport the Cherenkov light to a water-filled
expansion volume equipped with
10751 photomultiplier tubes. A separation better than four standard
deviations is achieved for momenta below 3.
III candidate selection
The and mesons are reconstructed in a sample of hadronic events
for all the possible modes, namely
,
, and
,
, .
mesons are reconstructed only from the decays .
To eliminate the background from
continuum events, we require that the ratio of
the second to zeroth Fox-Wolfram moments of the event ref:fox
be less than 0.45.
The candidates are reconstructed from two oppositely charged tracks
consistent with coming from a common vertex and having an invariant mass
within of the nominal mass. For most of the channels
involving a , we require that the vertex be displaced from the
interaction point for the event by at least 0.2 in the plane
transverse to the beam axis direction.
The candidates are reconstructed from pairs of photons, each with
energy greater than 30, which are required to have an invariant mass
. The from a decay must
have momentum between 70 and 450 in the frame,
while the from must have energy
greater than 200 in the laboratory frame.
The candidates are reconstructed in the decay modes
, , , and
. A interval around the nominal mass
difference is used to select mesons,
where is the measured mass difference resolution and is equal to
for and decays,
for decays, and for
decays. The mode is used only
in the reconstruction of decays and
.
The and mesons are reconstructed in the decay modes
, , , and
, by selecting track
combinations with invariant mass within of the average
measured mass. The average mass and the mass resolution
used in this selection are fitted from the data itself,
using a large inclusive sample of decays. The resolution is
equal to for decays, for decays,
for decays, and for
decays.
For modes involving two mesons, at least one of them is required to
decay to , except for the decay modes ,
, and , which have lower background and
for which all combinations are accepted.
All and tracks are required to be well
reconstructed in the tracking detectors and to originate from a common vertex.
Charged kaon identification, based on the measured Cherenkov angle in the DIRC
and the measurements in the drift chamber and the vertex tracker, is
used for most decay modes, as well as for the from the
meson decay.
candidates are reconstructed by combining one , one
and one candidate. A mass-constrained kinematic fit is applied to all
intermediate
particles (, , , , , ).
Since the mesons are produced via , the energy of the meson in the rest frame
is given by the beam energy in the center-of-mass frame, ,
which is known much more
precisely than the energy of the candidate. Therefore, to isolate the
meson signal, we use two kinematic variables: the difference
between the reconstructed energy of the candidate and the beam energy in
the center of mass frame (), and the beam energy substituted mass (),
defined as
(3)
where is the momentum of the reconstructed in
the frame. Signal events have close to the nominal meson mass,
5.279, and close to 0. Due to imperfect modeling of the
charged energy loss in the detector material, the central value of is slightly shifted away from 0 by an amount ,
which is fitted from the data themselves
(Figs. 2 (a), 2 (b)).
When several candidates are selected in the same event,
only the candidate with the lowest
value is considered (“best candidate”).
From Monte Carlo studies, this algorithm is found to give the best
reconstruction efficiency and the lowest cross-feed rate between the different
modes; it is found to introduce no bias
on the signal extraction, since the latter is performed from the spectra only. However, in Fig. 2, to avoid the bias on
inherent to this method, spectra are shown without applying
this selection.
IV Evidence for
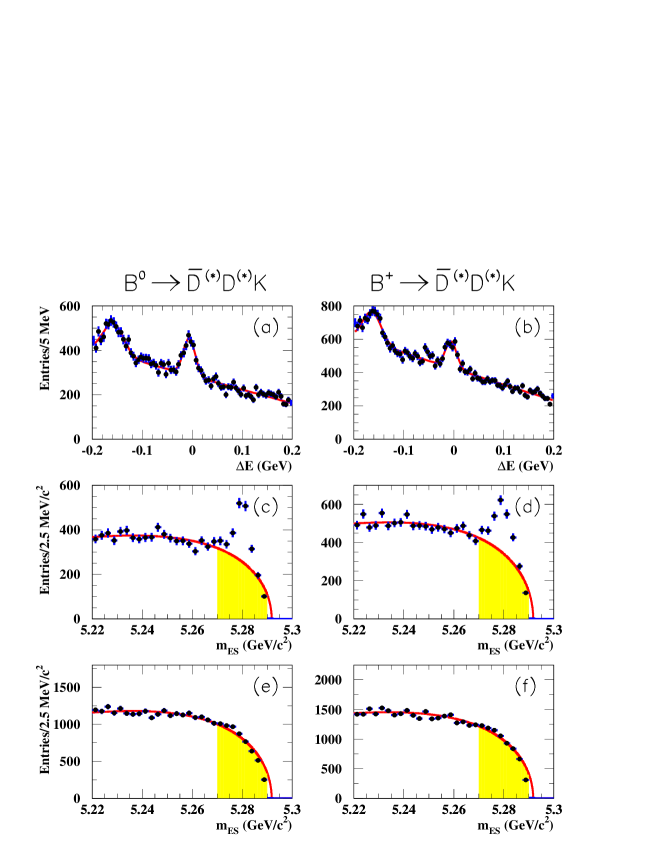
Figure 2: The and spectra (a,c,e) for the sum of all
the modes and (b,d,f) for the sum of all the
modes.
(a,b): for .
(c,d): for
.
(e,f): for (background control region).
The curves superimposed on the spectra correspond to the
background fits described in the text and the shaded regions
represent the background in the signal region .
The and spectra of the selected events are shown in
Fig. 2 for the sum of all the decay modes, separately for
and . The spectra are shown for
events in the signal region defined by .
Signal events appear in the peak near 0 when reconstructed correctly,
while the peak around is due to
and decays reconstructed as
and to decays reconstructed as
or .
The spectra for the signal region are shown for events with within
of the central value for the signal. The
resolution is determined from the data and is equal to
9.9 for events involving no and 11.3 for events involving
one . For events with two candidates, the resolution is
estimated from
the Monte Carlo simulation to be 13.8. As explained above,
only the candidate with the lowest
appears in the spectra in case of multiple candidates.
Both the spectra for the signal region and
the spectra show clear evidence of a signal.
On the contrary, the spectra for the background control region
do not contain any excess of events in the signal
region as expected.
When fitting the spectra, the combinatorial background component is
empirically described by a threshold function ref:argus (henceforth
referred to as the ARGUS distribution),
where represents the kinematic upper limit and is held fixed at the
center-of-mass beam energy , and is a
normalization factor. The function depends on a free parameter
that is determined from a fit to the spectrum
of the background control region. The number of combinatorial background
events in the signal region is then estimated by normalizing the ARGUS
distribution to the region in the slice
containing the signal (Figs. 2(c), 2(d)) and
extrapolating it to the signal region .
The fitted ARGUS distributions are overlaid on the spectra of
Fig. 2.
The number of background events predicted in the signal region by the fit
is 188924 for neutral mesons and 251227 for charged mesons,
while 2712 and 3482 events are observed, giving an excess of 82357 and 97065 events in the signal region.
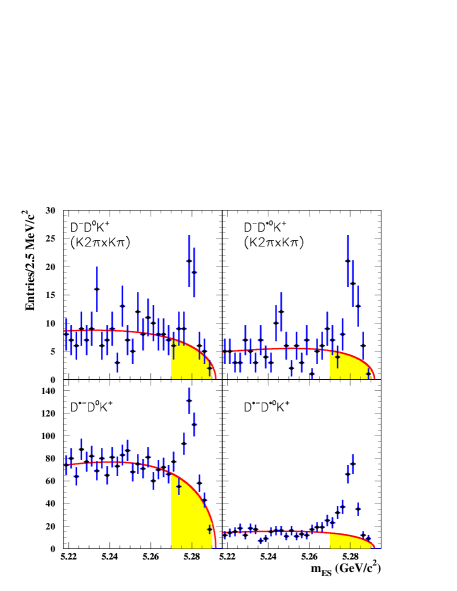
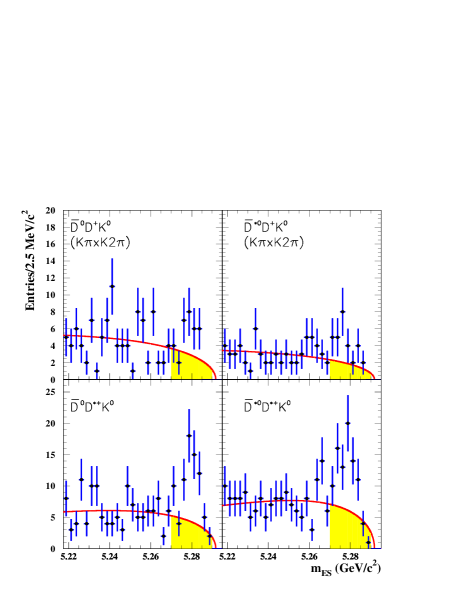
Figure 3: The spectra of the ten
modes. For each mode, all the
decay submodes used in the analysis have been summed, except for
modes for which the decay mode is listed
explicitly on the plot.
The curves correspond to the background fits described in the text and the
shaded regions represent the background in the signal region.
Upper left: pure external -emission (spectator)
decays .
Upper right: external+internal -emission decays
.
Lower left: pure internal -emission (color-suppressed) decays .
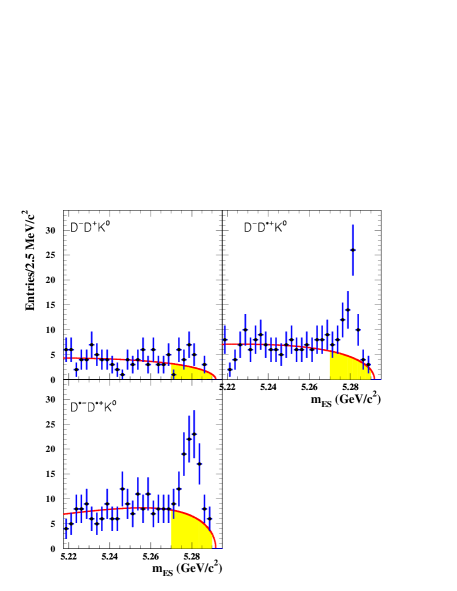
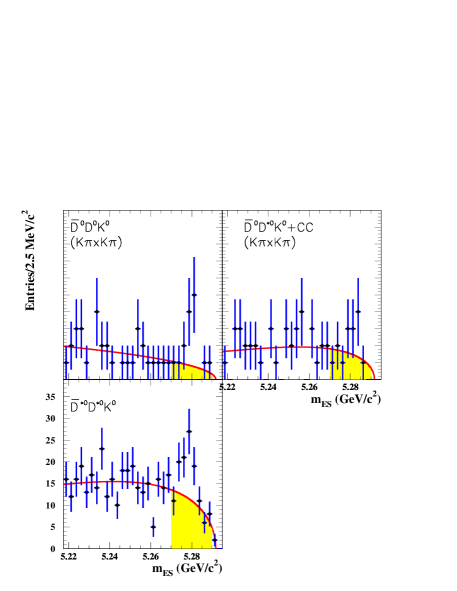
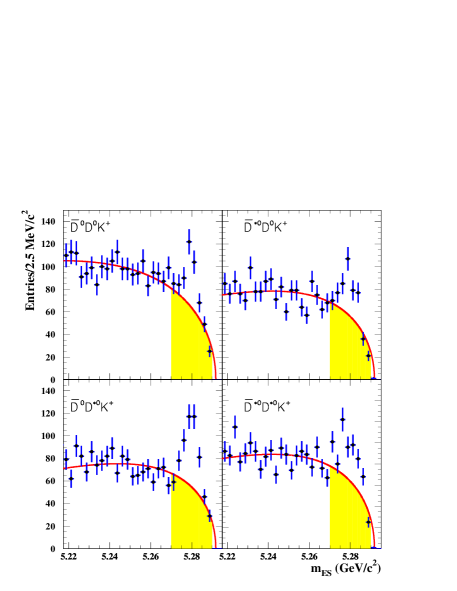
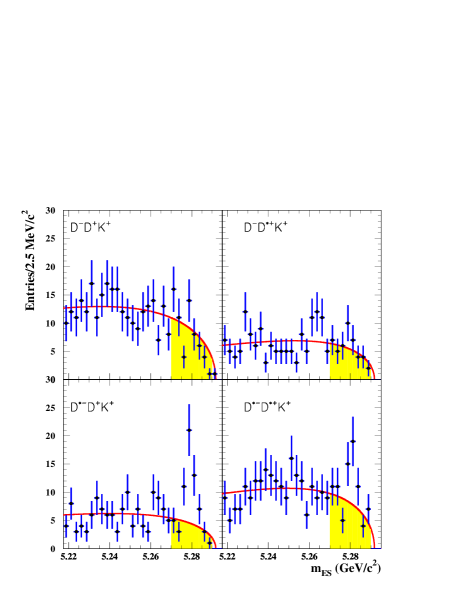
Figure 4: The spectra of the twelve
modes.
For each mode, all the decay submodes used in the analysis have been
summed, except for modes for which the decay mode
is listed explicitly on the plot.
The curves correspond to the background fits described in
the text and the shaded regions represent the background in the signal region.
Upper left: pure external -emission (spectator)
decays .
Upper right: external+internal -emission decays
.
Lower left: pure internal -emission (color-suppressed) decays
.
V Determination of branching fractions
Table 1: Number of events and branching fractions for each mode.
The excess (column 4) is the
difference between the total yield observed in the signal region
and the
combinatorial background. It includes the contribution from the signal
itself and from the
cross-feed from the other modes. The number of
cross-feed events,
computed from the cross-feed matrix and from the measured
branching fractions,
is given in column 5. When omitted, the predicted number of cross-feed
events is smaller than 5 and has been
neglected in the branching fraction calculations, as explained in the text.
The first error on each branching fraction is the statistical uncertainty
and the second
one is the systematic uncertainty. For the decay modes with a significance
smaller than 4, a 90% confidence level (C.L.) upper limit is also
derived. Here, is the sum of the combinatorial background and of
cross-feed, while
, where is the total yield in the signal region. The decay mode
has a large number of signal events but its
significance is lower than 4 because of the large cross-feed from
and . The fractional statistical error on
the branching fractions cannot be directly related to the fractional statistical error on
the excess since the different decay submodes of the pair (not detailed in the table)
enter with different statistical weights in the branching fraction calculation, while the yields
given here are a raw sum over all the decay submodes.
The statistical uncertainty on the background, dominated by the uncertainty on
the ARGUS shape parameter , is incorporated in the systematic error on
the branching fractions.
Total yield
Estimated
Excess =
Branching
90% C.L.
decay
in the
combinatorial
Signal +
cross-
fraction
upper
mode
signal region
background
cross-feed
feed
limit
decays through external -emission amplitudes
599
47912
12027
-
468
33710
13124
-
584
39911
18527
-
289
845
20518
-
decays through external+internal -emission amplitudes
26
192
75
-
84
343
5010
-
116
484
6811
-
decays through internal -emission amplitudes
175
1737
215
-
248
2258
2318
-
123
816
4213
19.8
decays through external -emission amplitudes
367
3179
5021
-
216
1757
4116
9.6
77
313
469
-
89
434
4610
9.0
decays through external+internal -emission amplitudes
627
46911
15827
-
552
41111
14126
75.3
623
40211
22127
37.1
675
46815
20730
66.6
decays through internal -emission amplitudes
64
654
-19
-
45
394
68
-
64
323
329
-
83
604
2310
-
In the following, the subscript will be used to identify the different
decay modes (i.e., , , …).
The subscript will be used to identify the different decay submodes of the
pair (i.e., =, ,
, …). The subscript will therefore refer to
mode decaying into submode .
The spectra obtained after a selection on
for all the different modes are shown in
Fig. 3 ( decay modes) and Fig. 4
( decay modes).
The corresponding event yields, computed as explained below, are given in
Table 1. In Figs. 3 and 4
and in Table 1, for a given decay mode the signals
from the different decay submodes have been summed.
However, to take advantage of the different signal-to-background ratios
of the various submodes, the information from each submode is entered
separately in a likelihood function used to calculate the
branching fractions.
As a first step, the ARGUS distribution shape parameter of each submode,
, is determined from a maximum likelihood fit to the spectra
of the background control region . An ARGUS distribution with
the shape parameter fixed to this value is then fitted
to the distribution for the signal region
,
excluding from the fit events with .
The factor is calculated so that the function is normalized
to the total number of background events and
the number of background events, , in the signal region
for this submode is calculated as
(5)
If submodes are used for a given mode, the branching fraction for
that mode is then extracted by maximizing the following likelihood:
(6)
where and are the observed and predicted number of events,
respectively, in the signal region.
is the sum of three contributions:
•
the predicted signal , which is the product of
the (unknown) branching fraction of decay mode ,
the reconstruction efficiency , the intermediate branching
fractions
, and the number of events, , assuming
that the number of meson pairs produced at the resonance
is equal to the number of pairs:
(7)
•
the number of combinatorial background events, ,
determined as described above (Eq. 5);
•
the peaking background from other decay
modes. The cross-feed between different decay submodes is found to
be negligible and is therefore calculated as
(8)
where is the cross-feed matrix element that represents
the probability for mode to be reconstructed as mode
for decay submode . The only
significant cross-feed is observed between decay modes where a fake
replaces a real or a real , for instance between
and , or between and
.
The branching fractions for the sets of decay modes that have
significant cross-feed are simultaneously fit, by maximizing the product
of the corresponding likelihood functions.
The and branching fractions used in the branching fraction
calculation are summarized in Table 2ref:pdg .
Branching fractions for decay modes reconstructed with a are calculated
for neutral mesons, including .
The selection efficiencies and the cross-feed matrices for each mode are
obtained from a detailed Monte Carlo simulation, in which the detector
response is modeled with the Geant4 program ref:geant4 .
The simulated event samples of decays used for the efficiency
calculation are generated according to a phase space model.
For each decay submode, samples of about 15000 signal events
have been produced. In addition, data are used whenever
possible to determine detector performance: tracking efficiencies are
determined by identifying tracks in the silicon vertex detector and measuring
the fraction that is well reconstructed in the drift chamber; the kaon
identification efficiency is estimated from a sample of
, decays; the
and efficiencies are measured by comparing the ratio of events,
,
to the published branching fractions cleotau .
Typical efficiencies range from 20%
for with both mesons decaying to , to less than 1%
for (, )
with mesons decaying to or .
Table 2: Submode branching fractions used in the analysis ref:pdg .
The errors on and
correlated to the error on are indicated
separately with the subscript .
Mode
(%)
VI Systematic studies
Table 3: Fractional systematic uncertainties
on efficiencies and branching fractions.
Item
Fractional uncertainty on efficiency or branching fraction
Charged track reconstruction
0.8% per track for tracks with more that 12
hits required in the Drift
Chamber
1.2% per track for tracks without Drift Chamber
requirement
reconstruction
2.5% per , added in quadrature to the
track reconstruction error
reconstruction
5.1% per
from
5.1% per (correlated with the
systematic)
identification
2.5% per
Vertex
1.3% per 2 track vertex
reconstruction
3.1% per 3 track vertex
5.7% per 4 track vertex
2% for modes with zero or one
5% for modes with two ’s
Background description
5% to 20% (ARGUS shape parameter , mode dependent)
3.5% (end point )
Monte Carlo statistics
2% to 10% per submode
(mode and submode dependent)
Due to the large number of mesons and to the large track multiplicities involved in
the decays , the dominant systematic uncertainties come from our level
of understanding of the charged kaon identification and of the charged-particle
tracking efficiencies. Both systematic uncertainties are estimated for each track
and are given in Table 3. Another important systematic is
the uncertainty linked to the background description. One of its components is from the
uncertainty on the number of background events and is dominated by the
uncertainty on the ARGUS shape parameter . The relative error on the
branching fractions associated with this component varies from 5% up to 20%
depending on the mode and is uncorrelated from one mode to another.
The other component is from the end point of the ARGUS distribution. Changing by
results in a change of the fitted combinatorial background. The
associated fractional error on each branching fractions is estimated to be
in average and is correlated between all the modes.
Other systematic uncertainties are due to uncertainties on the and branching
fractions, the reconstruction efficiencies, the vertex fit quality
requirements, and the resolution used to define the
signal box, as well as the statistical uncertainty on the efficiency due to the finite
size of the Monte Carlo simulation samples and the uncertainty on
the number of events in the data sample. The different contributions
to the systematic uncertainties on the branching fractions
are summarized in Table 3.
Possible decay model dependences of the efficiencies were also studied by
generating the decays and
(,
where is the narrow (, ) orbitally
excited state of the system and is a wide
(, )
resonance. The efficiency for reconstructing these
modes was compared to the efficiency found for
decays generated with a phase-space model.
We found no statistically significant difference in efficiencies; we assign
a systematic uncertainty equal to the statistical error
of the ratio (5%).
VII search for resonant substructure
decay modes are used to probe the
possible presence of intermediate resonances decaying
into , where are P-wave
excitations of the system. In the heavy-quark (charm) mass limit,
the spin of the heavy quark decouples, and both the spin of the meson and
the total angular momentum (spin plus orbital) of the light quark become
good quantum numbers ref:rosner ; ref:isgur . There are four P-wave
states with the following spin-parity and
light-quark angular momenta: (), (),
(), (). The two states can only
undergo D-wave decay, and therefore have narrow widths. The remaining
states decay via S-waves and are expected to be quite broad. Their masses are
predicted to be () and
(), while their widths are predicted to be a few hundred
ref:godfrey . However, the recent observation by the BABAR collaboration of a narrow state decaying to , with a mass of
(statistical error only) ref:dsj2517 , would
contradict these predictions and could indicate that the state has
a mass lower than the
threshold; if this interpretation is confirmed, the state would
therefore not contribute to the final state.
In the analysis described below, the two narrow resonances,
and , are considered. The full Dalitz plot for the decay is also examined.
VII.1
is the most probable resonance to contribute to
decays. It has already been observed and its measured
parameters are , , ,
and ref:pdg . Because of conservation of
parity and angular momentum, only the decays
are allowed. In this analysis, a search is made for the in
the final state in the four decay
modes , , , and . This resonance is not
reconstructed in the final state due to its lower reconstruction
efficiency.
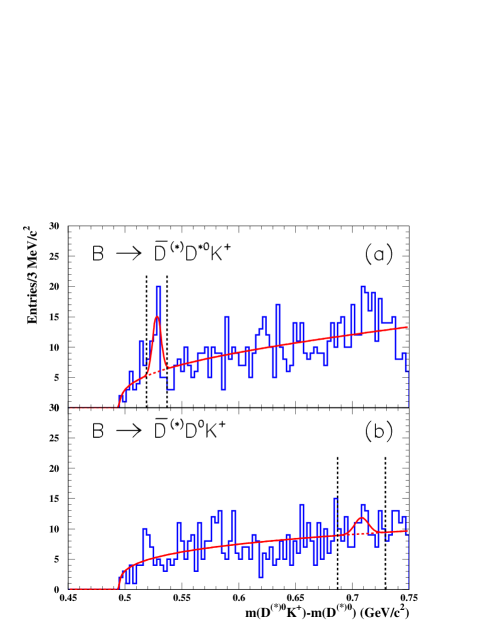
Figure 5: (a) distribution
for events reconstructed in the signal
regions. (b)
distribution for events reconstructed in the
signal regions.
Figure 5(a) shows the distribution of the variable
for
the events reconstructed in the signal region
() for
these four decay modes. The distribution is fitted with a Gaussian
function describing the signal. The combinatorial background is
represented by a threshold function defined as
(9)
The parameters of the Gaussian function (mean value and
standard deviation ) are fixed to the values obtained
from a fit to the same distribution resulting from the reconstruction of
inclusive decays in a large sample of
events. This procedure yields an estimated signal of
events out
of events.
In order to extract upper limits on the contribution of to
decays,
the same method is applied to the four individual decay modes, as
shown in Fig. 6(a). The region ,
illustrated by the dashed lines in Fig. 5(a), is defined as
the signal region and the number of combinatorial background events in this
region is estimated from the fit by integrating the background function
defined in Eq. 9. The total number of events observed
in the signal box is compared to the expected combinatorial background when
extracting the limits. Table 4 summarizes the results obtained
and gives a 90 % confidence level (C.L.) upper limit on the quantity ,
(10)
where and
are the observed number of signal events.
Using the branching fraction measurements of
Table 1, these results can be compared to the only existing
measurement of inclusive production in decays,
at 90%
C.L. ref:cleo2536 .
Table 4: contributions to
decays.
Total yield
decay mode
in
Estimated
90% C.L.
signal region
background
upper limit
16
13
12
20
VII.2
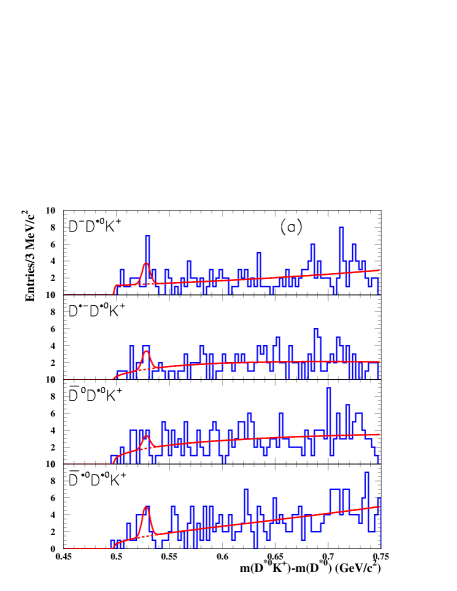
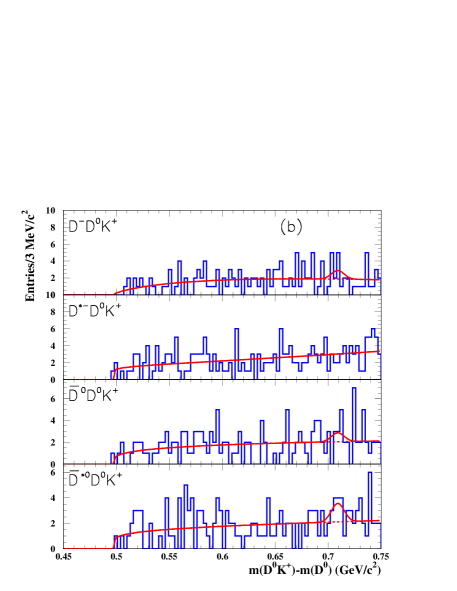
Figure 6: (a)
distributions of the events reconstructed in the four
decay modes, with .
(b)
distributions of the events reconstructed in the four
decay modes, with . These distributions are fit with
the sum of a threshold function (Eq. 9) for the
background components and a Gaussian function for the
and components.
The mean value and standard deviation of the Gaussian distributions have been
fixed to the values obtained from a fit to the inclusive and
samples, as described in the text.
The contribution of the resonance to decays
is also studied. This resonance is thought to be the other narrow state in
the orbitally excited doublet, together with
the . The world average values of its mass and width
are and
ref:pdg .
Its spin-parity has not been measured but its natural width and decay
properties are consistent with a state ref:pdg . If it is
indeed a spin-2 resonance, it cannot be obtained with a -mediated tree
diagram but might still be reached through final state interactions.
The allowed decay modes of the are and , both
proceeding through a D-wave. Because of the limited phase space, the latter
is highly suppressed ref:godfrey . In this analysis, a search is made
for the in the decay mode , in the four
channels , , ,
and .
The method developed for the study is applied.
Figure 5 (b) shows the distribution for the events reconstructed in all
four decay modes. The mean value
and the standard deviation of the Gaussian component of the fit function
are fixed, respectively, to and , which are the values derived from a large inclusive
data sample. The fitted yield of
decays is events out
of events.
Defining the signal region ,
C.L. upper limits on the contribution of
to decays are set for each of the four
individual decay modes (Fig. 6(b)). The number of events
observed in the signal box, the number of background events expected from the
fits, and the resulting limits are given in Table 5.
is defined here as
(11)
Table 5: contributions to
decays.
Total yield
decay mode
in
Estimated
90% C.L.
signal region
background
upper limit
25
41
38
37
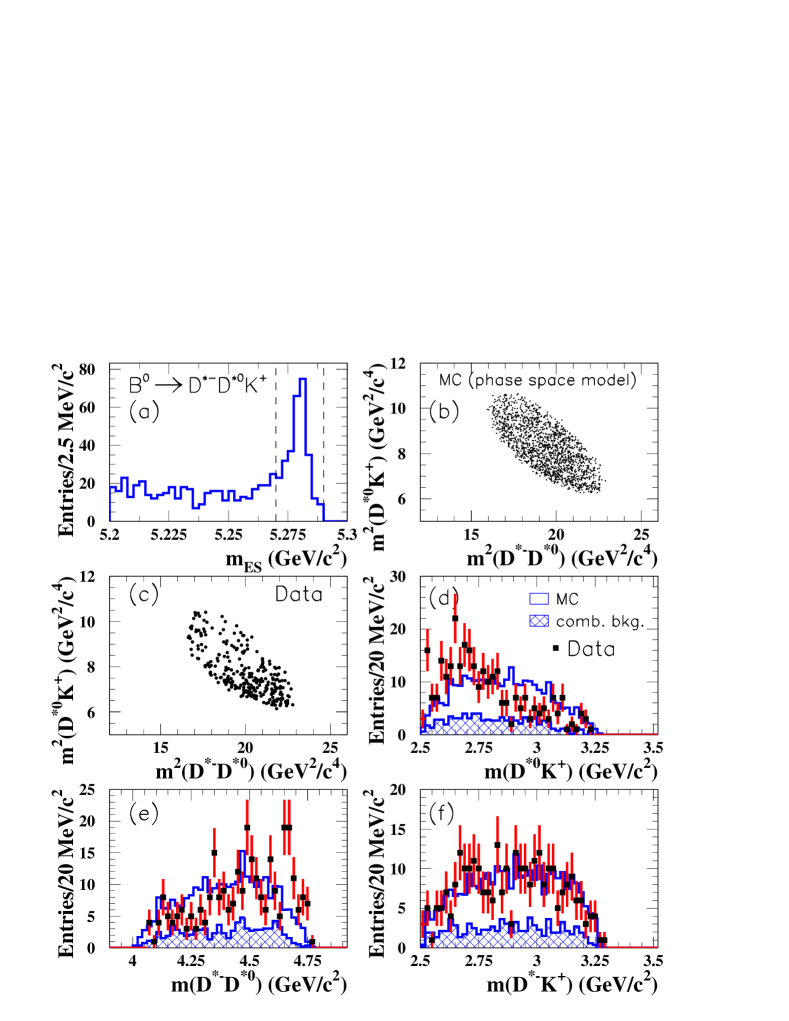
VII.3 Dalitz-plot analysis of the decay
Figure 7: Dalitz plots and projections for the decay
. The content of the different plots is discussed in the text.
As suggested in Ref. ref:colangelo2 , the study of decays could be
used to search for evidence of the yet undiscovered broad
states, if the decays are allowed by the
available phase space. The decay mode , which has the
largest number of reconstructed events and also has the largest purity, is
used for this search. The results are shown in Fig. 7.
The upper right plot (Fig. 7 (b)) is the Dalitz plot
vs. expected for three-body
decays generated with a phase
space model. The Dalitz plot vs. for
data events in the signal region
(Fig. 7 (a))
is shown in Fig. 7 (c). The next three plots
(Figs. 7 (d), 7 (e), 7 (f)) show the
projections , , and
for the same events. The hatched histograms show the
contribution expected from the combinatorial background; their shapes are
derived from the events with .
The open histograms show the contribution expected for three-body
decays generated with a phase-
space model. The density of events in the lower region of the Dalitz plot
(i.e., for small values of and large values of
) is significantly larger in the data
( Fig. 7 (c)) than in the simulation
with no resonance ( Fig. 7 (b)).
It could be interpreted as the presence of a broad resonance decaying to
, like the , state predicted by Heavy Quark
Symmetry models ref:rosner ; ref:isgur ; ref:godfrey . However,
more events are necessary to confirm this hypothesis and to estimate
the resonance properties such as mass and width.
As previously discussed (Sec. VI), the hypothetical presence of broad resonances
in the decay chain is accounted for by a 5% relative systematic error on all the branching
fraction measurements described in this paper.
VIII Conclusions
A measurement of the branching fractions for the 22 modes
is given in Table 1. For the decay modes for which
is smaller than 4, a 90% C.L. upper limit
is also derived (here, is the sum of the combinatorial background and
the cross-feed background from other modes
and , where is the total yield in the signal region).
This is the first complete measurement of all
possible channels. The measured branching fractions
are in good agreement with earlier measurements made with smaller data sets
for some of these modes cleoddk ; alephddk ; babarddk ; belleddk .
The existence of the decays and , which are an admixture
of even and odd eigenstates, has been demonstrated.
These decay modes could be used in the future, with
larger event samples, to also determine and
ref:browderddk ; ref:colangelo ; ref:charles .
A significant signal for the color
suppressed decay mode has also been observed.
One of the motivations of this analysis is to understand whether decays
can explain the
wrong-sign -meson rates in decays and reconcile the
total rate
with the predictions of Ref. buchalla . After
summing over all submodes, the branching
fractions of the and of the to are found to be
(12)
(13)
This study shows that a significant fraction of the transitions
proceed
through the decays . These decay modes account for
about one half of the wrong-sign production rate in decays,
cleoupv ; however, because of
the large statistical error on the latter measurement, it is not yet clear
whether they saturate it.
A search for resonant substructures shows that the
contribution to decays is small. No evidence
for a contribution to decays is
found. Finally, a simple Dalitz-plot analysis of the decays
shows that the three-body phase-space decay
model does not give a satisfactory description of these decays.
IX Acknowledgments
We are grateful for the
extraordinary contributions of our PEP-II colleagues in
achieving the excellent luminosity and machine conditions
that have made this work possible.
The success of this project also relies critically on the
expertise and dedication of the computing organizations that
support BABAR.
The collaborating institutions wish to thank
SLAC for its support and the kind hospitality extended to them.
This work is supported by the
US Department of Energy
and National Science Foundation, the
Natural Sciences and Engineering Research Council (Canada),
Institute of High Energy Physics (China), the
Commissariat à l’Energie Atomique and
Institut National de Physique Nucléaire et de Physique des Particules
(France), the
Bundesministerium für Bildung und Forschung and
Deutsche Forschungsgemeinschaft
(Germany), the
Istituto Nazionale di Fisica Nucleare (Italy),
the Foundation for Fundamental Research on Matter (The Netherlands),
the Research Council of Norway, the
Ministry of Science and Technology of the Russian Federation, and the
Particle Physics and Astronomy Research Council (United Kingdom).
Individuals have received support from
the A. P. Sloan Foundation,
the Research Corporation,
and the Alexander von Humboldt Foundation.
References
(1)
T. Browder, Proceedings of the 1996 Warsaw ICHEP Conference,
edited by Z. Ajduk and A.K. Wroblewski (World Scientific, 1997), p. 1139.
(2) I. I. Bigi, B. Blok, M. Shifman, and A. Vainshtein,
Phys. Lett. B 323, 408 (1994).
(3) G. Buchalla, I. Dunietz, and H. Yamamoto,
Phys. Lett. B 364, 188 (1995).
(4) CLEO Collaboration, T. E. Coan et al.,
Phys. Rev. Lett. 80, 1150 (1998).
(6) ALEPH Collaboration, R. Barate et al.,
Eur. Phys. Jour. C 4, 387 (1998).
(7)BABAR Collaboration, B. Aubert et al., SLAC-PUB-8924, hep-ex/0107056,
presented at the 20th International Symposium on Lepton and Photon Interactions at High Energies, Rome, Italy (2001).
(8) Belle Collaboration, K. Abe et al., BELLE-CONF-0104,
presented at the 20th International Symposium on Lepton and Photon Interactions at High Energies, Rome, Italy (2001).
(9)BABAR Collaboration, B. Aubert et al.,
Nucl. Instr. Meth. A 479, 1 (2002).
(10)
G.C. Fox and S. Wolfram, Nucl. Phys. B 149, 413 (1979).
(11)
ARGUS Collaboration, H. Albrecht et al., Phys. Lett. B 241, 278 (1990).
(12)
Particle Data Group, K. Hagiwara et al., Phys. Rev. D 66, 010001 (2002).
(13)
The Geant4 Collaboration, CERN-IT-2002-003,
submitted to Nucl. Instrum. Methods (2002).
(14) CLEO Collaboration, M. Procario et al., Phys. Rev. Lett. 70,
1207 (1993).
(15) J. L. Rosner, Comm. Nucl. Part. Phys. 16, 109 (1986) and
references therein.
(16) N. Isgur and M. B. Wise, Phys. Rev. Lett. 66, 1130 (1991).
(17) S. Godfrey and R. Kokoski, Phys. Rev. D 43, 1679 (1991).
(18) CLEO Collaboration, M. Bishai et al., Phys. Rev. D 57,
3847 (1998).
(19)BABAR Collaboration, B. Aubert et al., SLAC-PUB-9711, hep-ex/0304021, submitted to Phys. Rev. Lett. .
(20) P. Colangelo and F. De Fazio, Phys. Lett. B 532, 193 (2002).
(21) J. Charles, A. Le Yaouanc, L. Oliver, O. Pene, and J. C. Raynal,
Phys. Lett. B 425, 375 (1998)
[Erratum-ibid. B 433, 441 (1998)].
(22) P. Colangelo, F. De Fazio, G. Nardulli, N. Paver and Riazuddin,
Phys. Rev. D 60, 033002 (1999).
(23) T. E. Browder, A. Datta, P. J. O’Donnell and S. Pakvasa, Phys. Rev. D 61, 054009 (2000).