SLAC–PUB–9735
April 2003
Optical Properties of the DIRC Fused Silica Cherenkov Radiator***Work supported by Department of Energy contract DE–AC03–76SF00515.
J. Cohen-Tanugi†††Present address: Università di Pisa, Scuola Normale Superiore and INFN, I-56010 Pisa, Italy., M. Convery, B. Ratcliff, X. Sarazin ‡‡‡Present address: Laboratoire de l’Accélérateur Linéaire, F-91898 Orsay, France., J. Schwiening and J. Va’vra
Stanford Linear Accelerator Center, Stanford University, Stanford, CA 94309, USA
Abstract
The DIRC is a new type of Cherenkov detector that is successfully operating as the hadronic particle identification system for the B A B AR experiment at SLAC. The fused silica bars that serve as the DIRC’s Cherenkov radiators must transmit the light over long optical pathlengths with a large number of internal reflections. This imposes a number of stringent and novel requirements on the bar properties. This note summarizes a large amount of R&D that was performed both to develop specifications and production methods and to determine whether commercially produced bars could meet the requirements. One of the major outcomes of this R&D work is an understanding of methods to select radiation hard and optically uniform fused silica material. Others include measurement of the wavelength dependency of the internal reflection coefficient, and its sensitivity to surface contaminants, development of radiator support methods, and selection of good optical glue.
Submitted to Nuclear Instruments and Methods A
1 Introduction
The Detector of Internally Reflected Cherenkov light (DIRC) [1] is a new type of Cherenkov ring imaging detector that has been operating successfully at the B A B AR experiment at SLAC [2] for over three years. The device uses synthetic fused silica bars (colloquially called quartz bars), which serve both as the Cherenkov radiator and as light guides transmitting the photons to an array of 11,000 photomultiplier tubes (PMT).
Figure 1 illustrates the principle of the DIRC. A fraction of the Cherenkov photons produced by tracks passing through the bars is trapped by total internal reflection and propagates down the bars with very little loss and with the Cherenkov angle preserved (up to reflection ambiguities). A mirror at the far end reflects those photons that were originally traveling away from the detection end of the bar. At the detector end of the bar, photons pass through a fused silica wedge that allows photons to begin to expand into the detector region, while reflecting those photons that would otherwise miss the PMTs back into the photon detectors. Photons then pass through a window that separates the box holding the bars from the detection region. Water is the optical coupling medium between the bars and the PMT detector. The distance between the bar box window and the PMT detector is about 1.1 m.
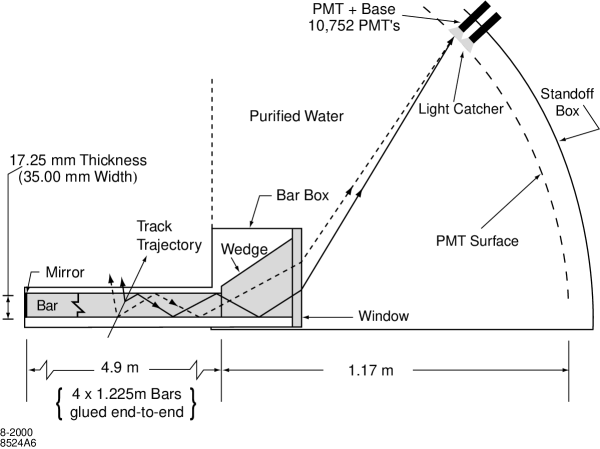
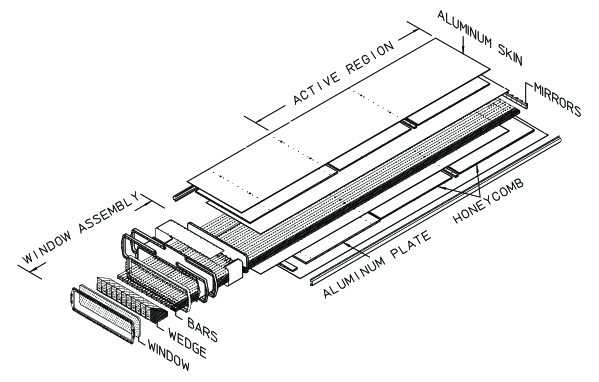
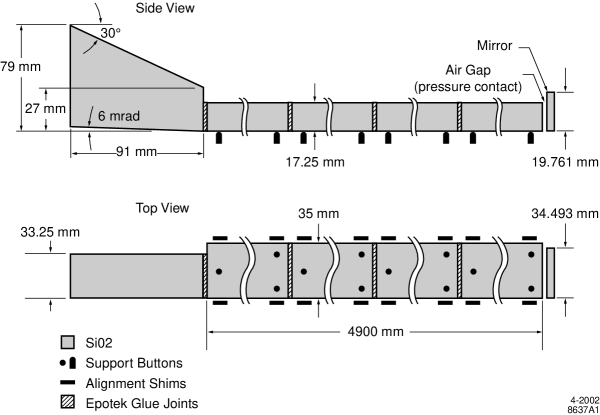
Figure 2 shows a single bar box with 12 bars. There are 12 such boxes in the B A B AR detector. Each bar, schematically shown in Figure 3, measures 4.9 m in length and is made of four short segments glued together with Epotek 301-2 optical epoxy [3]. Each short segment has the following design specifications: length 1225 mm, width 35.0 mm, and thickness 17.2 mm. The 122535.0 mm surface of the bar is called the “face”, the 122517.2 mm surface is the “side”, and the 35.017.2 mm surface is the “end”. To preserve the image resolution properties, the original specification was that any bar face-to-side angle be within 0.25 mrad of 90∘ (see section 6 for the final compromise). The bars must have sharp edges without too many chips to limit photon losses (specifications required less than 6 mm2 of damaged surface per bar). To check that the mechanical specifications are within our tolerances, we built a digital microscope system with image reconstruction software.
Since the trapped Cherenkov photons must typically bounce several hundred times before they exit the bar, the internal reflection coefficient must be close to one – less than 0.999 is unacceptable. Losses as small as 10-4 per bounce must be measured during the quality assurance process. Since such small losses are difficult to measure in a single bounce, we developed a method to measure the reflection coefficient by combining 50 bounces in a single measurement. The high surface reflectivity must be maintained for the expected ten-year lifetime of the experiment. Therefore, we studied the possible influence of contamination of the fused silica surfaces on the reflectivity coefficient.
The bulk transmission of the fused silica must also be very good. Attenuation lengths must be 100 meters. This high transmission must be maintained after exposure to high levels of ionizing radiation. This is because the B A B AR detector operates at a high luminosity machine that has a considerable gamma ray background. The optical glues must be similarly radiation hard. The luminosity of PEP II is currently 5 cm-2sec-1 and should exceed 1034 cm-2sec-1 in one to two years.
2 Basic Properties of Fused Silica
2.1 Types of Fused Silica
The crystalline form of Silicon Dioxide (SiO2) is called quartz and is the second most abundant mineral on earth. Quartz crystals are birefringent and are not suitable for use in the DIRC. An amorphous form of SiO2, which we will call natural fused silica, may be formed by crushing and melting natural quartz in a hydrogen flame. Optical grades of this material possess many of the properties required by the DIRC, such as long transmission length and good polishability. However, it suffers from the high level of impurities typically found in the natural quartz used to produce it, which can lead to significant sensitivity to ionizing radiation. A third material, which we will call synthetic fused silica, has been commercially produced for the past few decades. It is formed artificially by burning silicon tetra-chloride (SiCl4), or other feedstock in an oxygen atmosphere. This material can be made very pure and is widely used in the fiber optics industry. All of these forms of SiO2 are colloquially called quartz, but, strictly speaking, this term only applies to the crystalline form.
Both natural fused silica and synthetic fused silica may be obtained from a number of manufacturers. We have tested a number of brands of natural fused silica, including Vitreosil-F [4], and a number of brands of synthetic fused silica, including Suprasil [5], Spectrosil 2000 and Spectrosil B [6].


2.2 Refractive Index
To account for various effects in the DIRC, it is necessary to know the refractive index of the optical components of the DIRC. Figure 4 shows the refractive index for fused silica [7], water [8] and Epotek 301-2 [9], the optical glue used for joining the bars and other optical components. Figure 5 shows the calculated Fresnel reflection coefficients at an incidence angle of 0∘ for the boundaries of fused silica/water and fused silica/Epotek 301-2. Due to a good match of the fused silica and glue refraction indices, the reflection coefficient is small (less than 0.5%) and almost independent of wavelength above 300 nm [10].

2.3 Optical Bandwidth of DIRC
Figure 6 shows the optical bandwidth of the DIRC detector for a typical Cherenkov photon emitted by a particle at 90∘ polar angle in B A B AR [10]. Contributions to the bandwidth include: bar and water transmission, mirror reflectivity, internal reflection coefficient (assuming 365 bounces), glue (Epotek 301-2) transmission and PMT quantum efficiency (ETL 9125FLB17 PMT [11]) and window transmission. One can see that the bandwidth is cut at 300 nm, mainly due to the Epotek 301-2 glue transmission properties. This is actually advantageous for the DIRC because it reduces the chromatic error contributions to the overall Cherenkov angle and timing resolution. In addition, it makes the DIRC sensitive mainly in the visible and near-visible UV wavelength regions adding many practical advantages from a construction point of view.
2.4 Optical Homogeneity of the Synthetic Fused Silica Material
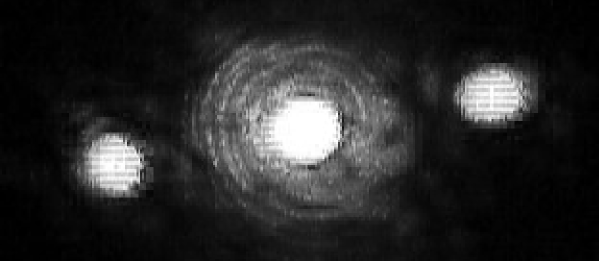
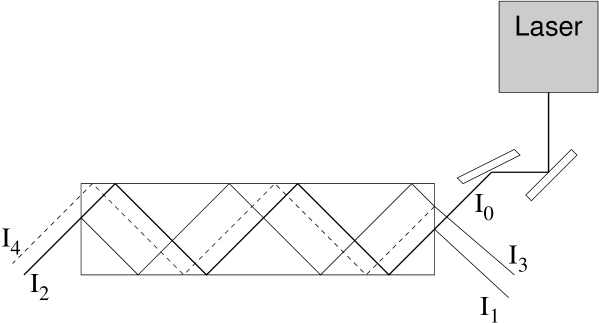
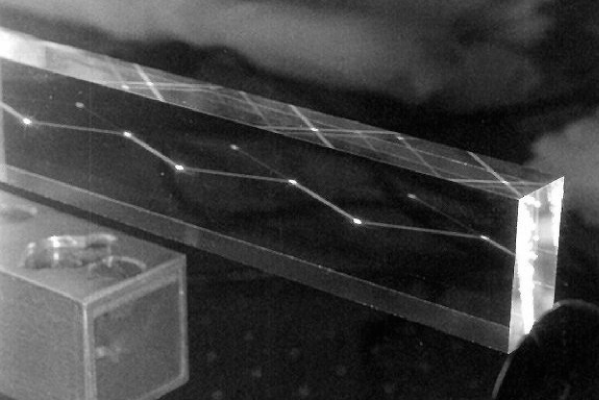
One unexpected feature of the synthetic fused silica used in the DIRC is that it possesses an observable periodic optical non-homogeneity in its volume [12]. This effect was initially discovered while shining a laser beam at non-zero angles relative to the bar axis and observing that some light was scattered into a diffraction-like pattern, called “lobes” (see Figure 7). This effect is observed in both types of synthetic fused silica considered for use in the DIRC: Heraeus Suprasil and QPC Spectrosil.
This “lobe effect” must be taken very seriously because it can cause photon losses or image distortion of the Cherenkov light. A few additional features of the lobe effect are:
-
•
The lobes are produced over a range of incident angles typically greater than 45 degrees (or less than 135∘) relative to the bar axis.
-
•
Bars that produce lobes for incident angles less than 90 degrees relative to the bar axis do not produce lobes for angles greater than 90 degrees, and vice-versa.
-
•
Some bars produced no lobes at all.
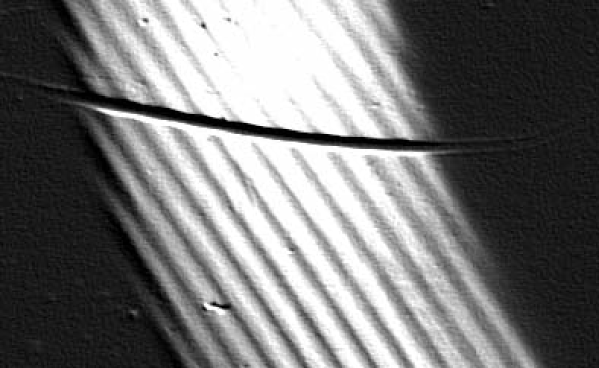
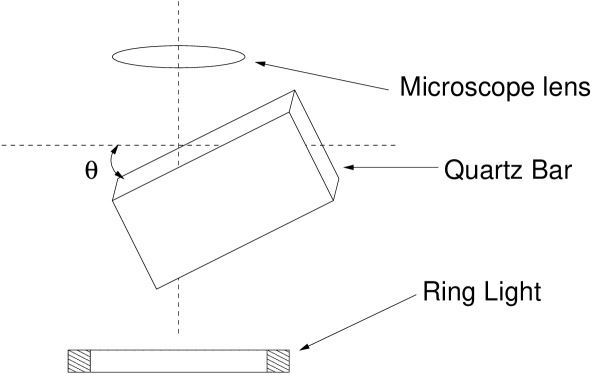
The lobe pattern is suggestive of diffraction from a periodic structure in the fused silica [13]. Furthermore, a clear periodic pattern could also be directly observed using ordinary white light (Figure 8) with an optical digital microscope configured as shown in Figure 9. The same “directionality” was observed as for lobe production - i.e. if the pattern was observed for it was not for . Also, the pattern persisted after removing 2 mm of material from each surface of the bar, thereby establishing that the pattern is in the volume of the fused silica material.
Although the lobe effect was initially observed in Heraeus Suprasil fused silica, it is also present, although at lower intensity and at larger angles relative to the bar axis, in QPC Spectrosil. Figure 10 shows the output of a photodiode as it is scanned across the lobe patterns of the two types of fused silica measuring the relative intensity. Evidently, the intensity of the lobes from QPC Spectrosil fused silica material () is much smaller than from Heraeus Suprasil ().

Figure 11 shows a model of the structure of the optical inhomogeneity, where it is assumed that there are curved “layers” of varying index of refraction within the fused silica ingots from which the bars are produced. If a laser beam is traveling tangent to these layers, then it would, in effect, see a “diffraction grating” formed by the alternating layers of high and low refraction index, thereby producing lobes. If however, the beam is traveling perpendicular to the layers, no lobes would be produced. This explains the “directionality” described above. Furthermore, we would expect that the opening angle of the lobes would be given by , where is the wavelength of light and is the spacing of the layers. Also, the phase change produced by the inhomogeneity would be , where is the amplitude of the inhomogeneity () and R is the radius of curvature of the layers, which we assume are circular. The fraction of the power in the lobes () is proportional to the square of the phase change, .

Measuring the lobes with two different light wavelengths can test the model. Figure 12 shows the results of the scans with a HeCd laser (442 nm) and a HeNe laser (633 nm). Table 1 shows the ratio of opening angles and lobe powers predicted by the model to those observed. The good agreement between the model and the measurements gives us confidence that the basic features of the model are correct. Converting the measured power in the lobes to an inhomogeneity amplitude, a, we find a = 6 for Heraeus Suprasil and 1 for QPC Spectrosil. More detailed measurements can also determine the shape of the layers in the fused silica.
| Predicted | Measured | |
|---|---|---|
| 0.70 | 0.69 0.03 | |
| 2.05 | 2.58 0.40 |

This model is also consistent with the direct observation of structure shown in Figure 8. This observation could be explained as a modulation of the refraction angle of light rays as they enter the fused silica.
Because of its bright lobes and the angular range over which they are produced, Heraeus Suprasil was rejected for use in the DIRC. QPC Spectrosil fused silica was deemed acceptable both because of its lower lobe power and also since the lobes in the QPC fused silica are only produced at angles close to perpendicular to the bar axis, which are not relevant for the photons detected in the DIRC. In practice, many QPC Spectrosil ingots have no discernible lobes at all. Based on these observations of optical inhomogeneity, QPC Spectrosil 2000 was chosen as the material for the DIRC bars.
It is interesting to note that, at our level of sensitivity, no such lobes have been observed in any of our samples of natural fused silica, nor in the synthetic fused silica windows used for the CRID TPC detectors and liquid radiators [14]. For all of these materials, the SiO2 material is deposited onto a stationary template to form a “boule”. What makes the DIRC’s synthetic material special is that it is produced in a long ingot form, where the SiO2 material is deposited layer-by-layer while the ingot is rotating. The details of this process are proprietary, and so not directly accessible to us, but it seems plausible that inhomogeneity amplitudes of a few times could easily be produced by it. We should also point out that in most applications of synthetic fused silica, such as windows or optical fibers, the light is expected to travel only at angles close to parallel with the “bar axis”. The DIRC may be one of the few applications where light must propagate at large angles with respect to this axis, and thus be sensitive to the “lobe effect”.
3 Transmission and Internal Reflection Coefficient of Fused Silica Bars
For the measurement of the transmission and the coefficient of total internal reflection of the DIRC bars we use two methods. A manual method is able to measure the absolute value of while an automated setup, used primarily for the quality assurance measurements during DIRC bar production, determines the transmission as well as the relative difference between a reference bar and the tested bar.
3.1 Measurement Technique
The internal reflection coefficient is measured absolutely with a “calorimetric” method [15]. As shown in Figure 13, this method measures five light intensities ( and ) and uses the number of light bounces, the bar dimensions and the bulk attenuation as inputs.
The fraction of the light transmitted as it propagates down the bar one time (), may be written as a combination of reflection losses and bulk attenuation:
| (1) |
where N is the number of bounces, L is the length of the fused silica bar, b is the width of the fused silica bar, and is the bulk attenuation length.
We can then relate the five measured intensities as:
| (2) |
This can be simplified to:
| (3) |
The solution, of this equation can then be used to calculate the . To do so, we need to know the attenuation length, , which is not easy to measure at long wavelengths. In our calculations, we use the value§§§This value is obtained by combining manual measurements done on a 5 meter long bar with the measurements on 1.2 meter bars using the automated method described below. m measured at 442 nm, and scale it to other wavelengths by , assuming Rayleigh scattering. This dependence gives m at 633 nm, which would be impossible to measure with good accuracy using a 1.2 m long bar.
A further improvement in accuracy is found by adding another term in equation 3, which can be calculated from the measured intensities by integrating the infinite sum of higher order contributions:
| (4) |
where the correction term reduces to:
| (5) |
This correction increases the coefficient typically by 0.0003.
Another small improvement in the accuracy is a correction for photodiode response due to the finite size of the laser beam. As the beam size for each intensity changes, the correction is different for each component. These corrections vary from 1.006 () to 1.03 ().
All intensities are measured by hand with a single
photodiode (Hamamatsu Co. [16] silicon photodiode
S1337-101BQ).
The photodiode is equipped with
a UV diffuser to improve the uniformity of its response.
However, it is still necessary to move the diode by hand in
order to find a consistent maximum value.
We call this procedure “peaking”.
We use a second photodiode to monitor the laser intensity.
The two photodiodes were synchronized during the readout.
The laser used is a HeCd laser, Liconix [17] 200 series,
model 4214NB.
It operates at two wavelengths, is equipped with multimode optics,
and provides a vertically polarized beam with a wavelength of 442 or
325 nm.
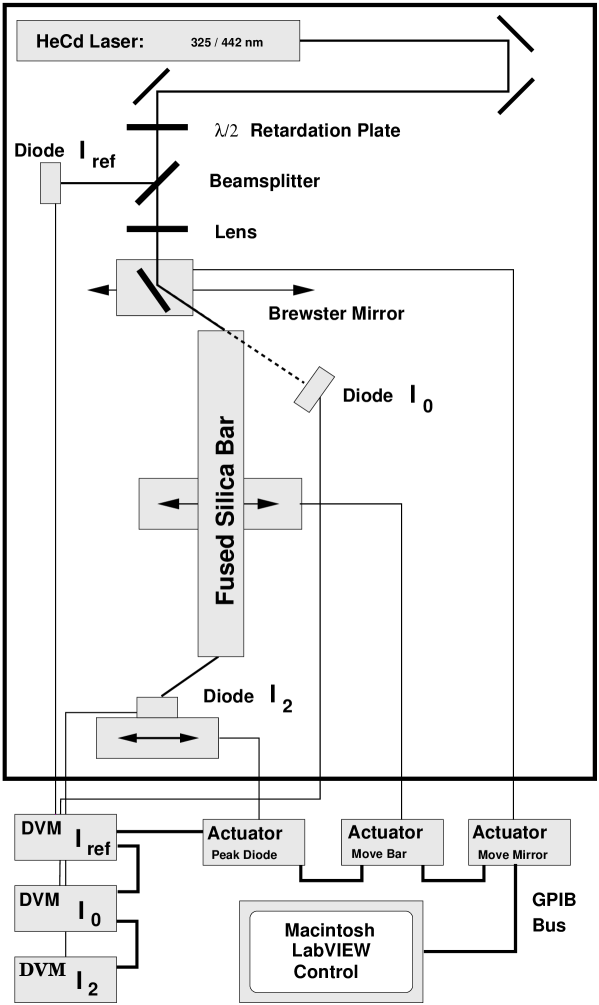
The calorimetric method described above is too time-consuming to be used for quality assurance measurements of many bars, or for measurements of multiple points of a single bar. For these types of measurements, we developed an automated setup, shown in Figure 14 [18], which makes use of the vertical polarization of the Liconix 4214NB HeCd laser beam. The bar can be scanned through the laser beam using an actuator controlled by a Macintosh computer running LabView. The transmission is measured along the axis of the bar. The reflection coefficient is measured using typically 53 bounces within the bar (see Figure 15).
A /2 retardation plate converts the vertical polarization into horizontal polarization so that, when the laser enters the bar at the Brewster angle (see Figure 14), the intensity of the reflected beam image is close to zero. This simplifies the overall problem by allowing the measurement of only two intensities () rather than the five required in the absolute measurement. Another advantage of the automatic method is that it allows a scan of about 75 grid-points across a large surface area in less than one hour.
The computer-controlled setup measures the relative internal reflection coefficient, which can be normalized by comparison with a reference bar whose absolute reflection coefficient has been measured manually by the calorimetric method described above.
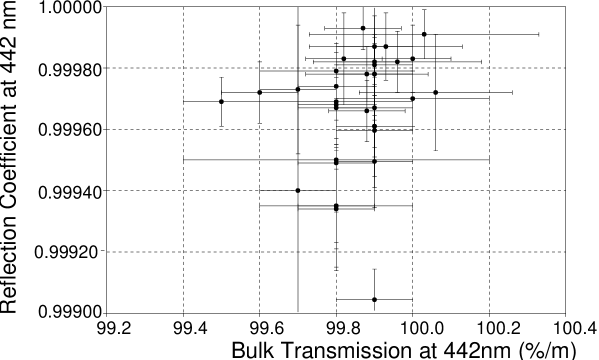
Prior to the reflection coefficient measurements reported in this section all bar surfaces were thoroughly cleaned using alumina powder. This was done by gently rubbing the bar surfaces with 0.3m alumina powder, which was mixed with clean water in a 1:10 ratio, ensuring that surface chemical contamination was minimized. Cleaning was essential for optimum results. The reflection coefficient of a randomly picked bar was measured before and after being cleaned with the alumina powder method. The value of the reflection coefficient increased by 0.0005 after the cleaning. During DIRC production we found that the bar manufacturer, Boeing Co. [19], usually delivered the bars to SLAC with very clean surfaces. Therefore a simpler cleaning method, where the bars were swiped with acetone and alcohol, was sufficient to restore the optimum reflection coefficient. Throughout the construction phase we monitored the bar cleanliness using the relative measurements of the reflection coefficient [20, 21] normalized to selected reference bars. The average relative internal reflection coefficient of the bars used in the DIRC construction is 0.99970.0001, the average transmission is 99.90.1%/meter at 442 nm, and 98.90.2% at 325 nm. Figure 16 shows an example of measurement results at 442 nm [20].
3.2 Wavelength Dependence of the Reflection Coefficient
To measure the dependence of on the wavelength, we used five laser wavelengths which are provided by four different lasers (266 nm Nanolase solid state YAG laser [22], 325 nm and 442 nm Liconix HeCd 4210N [17], 543 nm Uniphase 1135 green, and 633 nm Uniphase red [23]). The intensity of the lasers is different, influencing the relative accuracy for each measurement (for example, the Hamamatsu photodiode currents are 500-600A at 442 nm, 20-25mA at 325 nm, 10-15A at 266 nm, 20-25A at 543 nm, and 500-550A at 633 nm). Similarly, laser stability varies, with the 266 nm Nanolase being least stable.

| Contaminant Candidate | Test Length | Temperature | Humidity | Relevance to DIRC |
|---|---|---|---|---|
| Epotek 301-2 epoxy | 1 day | room | dry | Used for all optical joints |
| Gluing Station | 2 days | room | dry | Exposure to fumes during bar gluing |
| Bar box buttons | 3 days | room | dry | Used in bar box construction |
| Matheson pressure regulator | 10 days | room/ 60∘ C | dry/wet | Used in B A B AR gas system |
| DP-190 Epoxy (translucent) | 31 days | room | dry | Used as secondary glue to seal bar boxes |
| DP-190 Epoxy (gray) | 31 days | room | dry | Used during construction of bar boxes |
| Wet Hysol 1C-LV Epoxy | 42 days | room | dry | Used as primary glue to seal bar boxes |
| Wet SES-403 RTV | 54 days | room | dry | Not used in DIRC |
| Cured SES-403 RTV | 74 days | room | dry | Not used in DIRC |
| Packing foam for bars | 74 days | room | dry | Used to ship bars from Boeing Co. |
| EPDM Gasket | 74 days | room | dry | Used in gaskets for water seal |
| Disogrin O-rings | 75 days | room/ 60∘ C | dry/wet | Used in B A B AR gas system |
| DIRC gas system at B A B AR | 90 days | room | dry | Complete check of B A B AR gas system |
| Wet Dow Corning 3145 RTV | 116 days | room | dry | Construction of DIRC construction clean room |
| Teflon sample | 116 days | room | dry | Not used in DIRC |
| Prototype bar box | 117 days | room / 60∘ C | dry | Initial test of bar box cleanliness |
Figure 17 shows the result, plotted as (1-Reflection coefficient) vs. wavelength. The plotted errors are based on the of ten repetitive trials for each intensity component . There are many sources of systematic error that are difficult to evaluate. They depend on many factors, such as surface quality variation, surface contamination (especially in the far UV region), the method of the photodiode “peaking”, dust, background light in the room, the lobe effect due to the refraction index variation, etc. To evaluate at least some of these systematic errors, the measurements are repeated many times, while varying the measurement conditions, such as laser entrance point into the bar, the laser path within the bar, the number of bounces N (by a few), avoiding bright spots observed when hitting either chips or the bar supporting buttons, etc. After a lot of practice, one can obtain quite repeatable results with an estimated systematic (repeatability) error of about 0.0003 to each measurement. Figure 17 also shows three curves based on scalar reflection theory [24], assuming the fused silica surface finish of 5, 10, and 15 Å. The internal reflection coefficient is consistent with a surface finish between 5 and 8 Å () in the wavelength region between 450 and 650 nm. The direct measurement by the bar manufacturer Boeing Co. [19] found that the surface finish was better than 5 Å for all bars, consistent with our measurement of . However, the measured reflection coefficient falls significantly below 350 nm, more than predicted by scalar theory. This discrepancy is not well understood, although a considerable amount of time has been spent checking the experimental results at 266 and 325 nm. A possible explanation for the discrepancy in the UV region could be chemical contamination, or near surface humidity. Figure 17 also shows a polynomial fit to data. This fit is used to evaluate the DIRC efficiency and mean wavelength response, which is shown in Figure 6 [10].
3.3 Bar Surface Contamination Tests
Extensive contamination tests are performed to see if the internal reflection coefficient can be degraded by materials used for the construction of the DIRC bar boxes, gluing, during general handling procedures, or the DIRC gas system [25]. In these tests sample bars are exposed for extended periods of time to potential contaminants at room and elevated temperatures with and without added humidity. The bar reflection coefficient is either measured continuously throughout the tests or at regular intervals if the bar is not accessible during the test. None of the materials, summarized in Table 2, causes any significant decrease of the internal reflection coefficient with a measurement precision of about 0.0003.
4 Radiation Hardness of Fused Silica and Optical Glues
It is expected that the DIRC will be exposed to 0.5-1 krad/year during normal operation in its 10 year lifetime. Since additional radiation exposure can occur during machine tuning, it seems reasonable to require that both the fused silica and the optical glue be resistant up to at least 10-15 krad.
4.1 Study of Radiation Damage of Fused Silica
The initial DIRC prototype tests [26, 27] used Vitreosil-F [4], which is a natural fused silica material, produced from naturally occurring crystalline quartz. Although the optical performance of this material is excellent, radiation damage tests show that it lost 80% of transmission per meter at 325 nm after a radiation dose of only 7 krad [15] (see Figure 18). Two other natural fused silica materials (JGS3-IR [28] and T-08 [29]) demonstrate similarly rapid deterioration. With the Vitreosil-F sample, tests were done to determine whether the radiation damage could be “cured” with photo-bleaching¶¶¶Photo bleaching is the use of a high intensity UV laser or lamp to restore the lost transmission due to the radiation damage [30]., and/or a heat treatment. Figure 18 shows that a UV laser causes recovery of some of the transmission, but only in a region close to the beam [15]. A strong UV lamp is able to cure the transmission loss over a larger region. However, several days are required for this process. Since such a “curing procedure” would be highly impractical to implement in B A B AR, we use the more radiation-resistant, but also more expensive, synthetic materials.

We conduct two types of radiation damage studies on the natural and synthetic fused silica samples: (a) using short samples (10-20 cm), where the transmission is typically measured with a monochromator, and (b) using long samples (1 m), where the transmission is measured with a HeCd laser (Liconix 4214NB). In the first type of tests, the transmission can be measured over a wide range of wavelengths, but with limited precision. The second type of test gives more precise measurements, but at only two discrete wavelengths (325 and 442 nm).
4.1.1 Radiation Source
We use the Co60 source facility available at SLAC to irradiate the bars [15, 31]. Its activity is about 14.1 Curie. A short sample (30 cm) can be placed very close to the source and be irradiated with a dose up to 50-60 krad per day. The Co60 source produces two major photon emission lines, 1.173 and 1.333 MeV. There are some Compton electrons coming from the well concrete walls; they contribute about 10% to the total dose. The radiation dose was estimated using TLD dosimeters. The measurement is calibrated using (a) a theoretical estimate based on the geometry and known source activity corrected for its lifetime, (b) an ion chamber measurement, and (c) an opti-chromic dosimeter measurement. The measurements agree to within 10 %.
4.1.2 Monochromator Transmission Studies of Natural Fused Silica
The transmission of the fused silica samples is measured as a function of wavelength in a monochromator, before and after exposure to the radiation source. A correction is made for the Fresnel reflections at the entrance and exit surfaces. Since the polish of these surfaces, performed at SLAC, is of moderate quality, some additional light (typically 2%) is lost due to scattering. However, the scattered light should be roughly the same before and after irradiation, so this does not effect the accuracy of the radiation damage measurements. Figure 19 shows the results of the monochromator studies of radiation damage for the three types of natural fused silica that were studied. These measurements have systematic errors at a level of 2-3%. For all three types, the transmission is seriously degraded after a dose of only 20 krad. The DIRC with the 5-meter long bars would not function at all given such transmission losses.

| Material | Manufacturer | Type | Visual Change | Radioluminescence | Transmission Loss |
| Vitreosil-F | TSL | Natural | No (100 krad) | No (100 krad) | Severe (7 krad) |
| T-08 | Heraeus Amersil | Natural | Yellow (330 krad) | Yes (330 krad) | Severe (10 krad) |
| JGS3-IR | Beijing Institute | Natural | Brown (400 krad) | No (400 krad)) | Severe (20 krad) |
| Suprasil | Heraeus Amersil | Synthetic | No (280 krad) | Yes (280 krad) | Small (280 krad) |
| JGS1-UV | Beijing Institute | Synthetic | No (650 krad) | No (650 krad) | No (650 krad) |
| Spectrosil 2000 | TSL | Synthetic | No (180 krad) | No (180 krad) | Small (180 krad) |
| Spectrosil B | TSL | Synthetic | No (254 krad) | Yes (254 krad) | Small (254 krad) |
In addition to transmission loss, visual changes and radio-luminescence were also observed as consequences of radiation damage. Table 3 summarizes these observations. The radio-luminescence observed in the T-08 sample caused monochromator singles rates to increase by a factor of 37 after a dose of 10 krad, and by a factor of 8500 after a dose of 334 krad. Such radio-luminescence is a known property of quartz and fused silica [32]. Neither Vitreosil-F nor JGS3-IR samples showed any noticeable radio-luminescence after the irradiation. However, these measurements are not sensitive to radio-luminescence with a very short time constant, since the first measurements are usually done at least 30-60 minutes after the sample is removed from the radiation well.
4.1.3 Monochromator Transmission Studies of Synthetic Fused Silica
It is clear that natural fused silica is not a good candidate for the B A B AR experiment, and therefore, we have studied the properties of synthetic fused silica material. We have tested four short synthetic fused silica samples. Spectrosil B [6] (2 cm dia. x 20 cm long sample), JGS1-UV [33] (2 cm x 2 cm x 10 cm sample), Suprasil Standard [5] (2 cm dia. x 20 cm long sample), Spectrosil 2000 [6] (2 cm x 2 cm x 20.7 cm long sample). Figure 20 shows the results of these studies.

Figure 20(a) shows that Spectrosil B is radiation hard above 280 nm. In the far UV region below 240 nm, we observe some radiation sensitivity. However it is still within acceptable levels for the B A B AR experiment. This sample showed strong radio-luminescence after radiation exposure, as one can see in Figure 21(a). The photonic activity was estimated with the monochromator’s PMT, and was about 100 times more than normal after 12 krad, and was decaying at a rate of about 10% after 2-3 minutes. The time interval between the end of the irradiation and the beginning of the transmission measurement was typically 30-40 minutes.
JGS1-UV synthetic material (Figure 20(b)) is very radiation resistant. In fact, it is among the best samples we have tested. This sample did not show any radio-luminescence after radiation exposure.
Suprasil Standard synthetic (Figure 20(c)) material shows the largest radiation damage for all synthetic materials we tested. The material is radiation hard for small doses up to 10-20 krad. However, when the dose is increased to 280 krad, we see a substantial transmission loss below 340 nm. Furthermore, Figure 21(b) shows that this particular material produced radio-luminescence after radiation exposure.

Figure 20(d) shows the transmission of the Spectrosil 2000 sample for several irradiation doses. This particular synthetic material shows good resistance to radiation. The material lost 2-3 %/meter of transmission above 260 nm after a dose of 17 krad. In the far UV region below 240 nm, we observe larger losses. However, it is well within the requirements of the B A B AR experiment. This sample did not show any radio-luminescence after radiation exposure. Table 3 summarizes all radiation damage tests for all of the types of fused silica that we tested.
4.1.4 Study of Radiation Damage of Long Synthetic Fused Silica Samples
In order to verify the results obtained in the monochromator with short samples (20 cm) of synthetic fused silica, similar measurements were done with long ( 100 cm) samples. These measurements use the laser scanning system described in section 3 [21]. This setup is capable of measuring the average transmission with a systematic error of about 0.2%.
We have tested two synthetic fused silica materials: (a) a Suprasil Standard rod, 100 cm long and 26 mm in diameter, and (b) a Spectrosil 2000 rod, 137 cm long and 55 mm diameter [31].
The long fused silica samples are irradiated using a Co60 source (1400 Curie) at LBNL. The bar is placed perpendicular to the geometric axis of the source. At a distance of 1 meter from the source, one can achieve a dose of 38 kR per day. The radiation dose was measured with a Victoreen dosimeter measuring the exposure in Roentgen units (R)∥∥∥In Roentgen units (R), 1 R = 2.58 Coul kg-1. The TLD dosimeter measures the absorbed dose in Rad units. The conversion between rad and R depends on the material. In tissue, it is 1 rad = 1.139 R .. Therefore, in the following, the radiation doses will be given in terms of exposure dose, using Roentgen units.

Figure 22(a) shows the transmission measurements for Spectrosil 2000. The material loses 0.5%/m of transmission at 325 nm after 15 kR. Increasing the dose further does not result in additional transmission loss. No effect is observed at 442 nm for all radiation doses. Figure 22(b) shows the transmission measurements for Suprasil Standard. No significant transmission loss is observed at 325 nm or 442 nm. This result is consistent with the radiation damage observed in the small samples, but does not extend into the UV.
Based on the radiation test results, we have found that the QPC Spectrosil 2000 fused silica material satisfies requirements for the radiation hardness needed to operate successfully for 10 years at B A B AR.
It is interesting to note that the same samples of fused silica described in this section were used in subsequent test performed during R&D for the E158 experiment at SLAC. The Spectrosil 2000 material used in DIRC was found to be radiation hard to photon doses of several Mrad and neutron doses of more than 30 krad [34].
4.2 Study of Radiation Damage in Optical Glues
It is also necessary to test the radiation hardness of the optical glues, which could fail either due to radiation or background induced light in the bar. We have tested five glue candidates: (a) Epotek 301-2 optical epoxy, which is the glue actually used for gluing of all DIRC fused silica bars, (b) SES-403 RTV, (c) SES-406 RTV, (d) KE-108 RTV [35], and (e) Rhodorsil-141 RTV [36]. All optical glue samples are tested using the SLAC Co60 source facility.
The following procedure is used: a glue sample is placed between two small fused silica plates, each 4mm thick. This particular fused silica is radiation resistant up to at least 70 krad. It cuts the transparency at around 170 nm, so that it does not influence the glue studies in this note. The glue samples are placed in the monochromator to check the initial transmission, then irradiated with a dose of about 60-70 krad, and then rechecked for transmission.
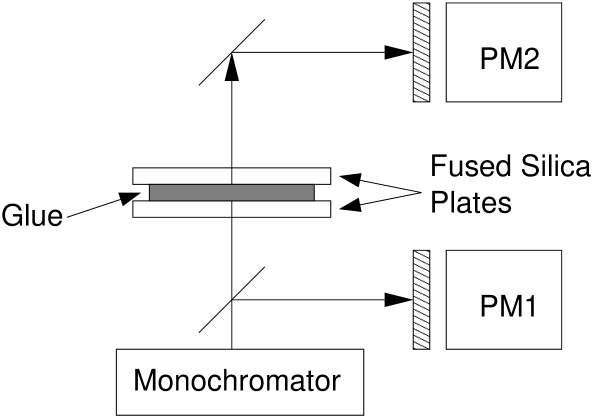
Figure 23 shows the experimental setup used for the glue transmission studies. Figure 24(a) shows all the results for all the glues that were tested. Figure 24(b) shows the detailed results for Epotek 301-2 epoxy, which is an optical epoxy with a UV cut-off edge at 280 nm. One can see a slight transmission loss of about 1%, between 300 and 350 nm, after a dose of 70 krad. The thickness of the Epotek sample,25m, is the same thickness typically used for gluing bars together.

Based on these tests, Epotek 301-2 epoxy satisfies requirements to operate successfully for 10 years at B A B AR, and was chosen to glue the DIRC bars together.
In addition, glue samples were exposed to a strong photon flux. No discoloration nor any loss of transmission is observed.
5 Reflection from the Fused Silica Bar Supporting Shims and Mirrors
The mirror [37] at the end of each bar is an important part of the DIRC enabling the capture of the Cherenkov light going forward into B A B AR (the DIRC PMT readout is on the backward end of the detector). As a check of the manufacturer’s data, we have measured the reflectivity of these mirrors using a laser and photodiode setup similar to that described in section 3. Figure 25 shows the DIRC mirror reflectivity as a function of wavelength. The manufacturer s data are consistent with our data, which are taken at laser wavelengths of 266, 325, and 442 nm.

Another important requirement of the DIRC is that the bars must held fixed within the bar box. This is done with a number of “buttons” that support the bars and “shims” that keep the bars separated from each other. The materials used for these supports should ideally have high reflectivity. Furthermore, since there can be relative motion between the bars and the bar box, the button material should not scratch the surface of the fused silica.
The reflectivity of a number of different potential shim materials is measured using a setup similar to that described in section 3. Table 4 shows the results of these measurements and indicates that, for example, Nylon creates substantial reflection losses. This is true for all of the soft plastic materials tested such as Teflon or Rubber. The harder plastic materials, such as Kapton or Mylar, perform better. Metals, such as Aluminum, perform even better. Table 4 indicates that the reflectivity of any material depends on the pressure with which the material is pressed against the fused silica bar. To quantify this better, we constructed a shim press, which is calibrated to express the force per area in psi units. Figure 26(a) shows the reflection losses with Aluminum shim foils as a function of the load. One can see that the loss is less than 1% for typical practical loads. For comparison, Figure 26(b) shows that the uncoated Kapton or Mylar shims would be a poor choice.
| Material | Reflectivity | |
|---|---|---|
| Contact Pressure | ||
| Light | Firm | |
| Kapton | 1.000 | 0.994 |
| Mylar | 1.000 | 0.985 |
| Gloves (rubber) | 0.985 | 0.938 |
| Nylon button | 0.989 | 0.949 |
| Al (shiny) | 1.000 | 0.990 |
| Al (non-shiny) | 1.000 | 0.990 |
| Fused Silica (polished) | 1.000 | 0.996 |

There is an interesting physical explanation of these tests: a portion of the internally reflecting wave extends beyond the fused silica boundary and probes the medium on other side. As a result, the wave may not be totally internally reflected. This effect gets larger as the laser wavelength decreases and is also sensitive to the proximity to the critical angle. This effect is used for commercial pollution studies, usually in the infrared wavelength region. In our case, as the force on the shim gets larger, this effect increases, resulting in the reflection coefficient decrease. Based on these tests, we chose Aluminum as the material for shims between the bars.
To select the material for the supporting buttons separating the bars and aluminum bar box we performed tests in which buttons were rubbed several thousand times across the bar surface. Since the area in which the support buttons are in contact with the bar surface is very small, the single bounce reflectivity of the material is less important than avoiding scratching the bars. Therefore, Nylon is chosen as button material because it does not damage the surface of the bar.
6 Fused Silica Bar Mechanical Properties
The mechanical bar properties, such as the orthogonality between bar surfaces and edge damage or chips can clearly influence the quality of the Cherenkov angle image or the number of photons detected. The primary goals of our setup are to validate the manufacturer’s [19] bar measurement procedures, and to provide independent measurements of a subset of bars to verify stability in the quality assurance (QA) process. To perform these QA checks at SLAC, we use a digital microscope [38] and several image-treating analysis programs based on NIH Image software [39].
The first method is based on manual operation, where an operator follows an edge of the bar visually on the microscope screen, clicking on several points along the edge to digitize its coordinates. Such points are then used in a fit to find a straight line. Using two straight lines one could then define the orthogonality of two surfaces of the bar.


The second, algorithmic, approach uses software to analyze a digital picture of the bar taken with the microscope. Each picture consists of an array of 640 by 480 pixels, each of which has 8 bits of gray-scale information. The microscope magnification is such that each pixel represents an area of about 5 microns by 5 microns. For each picture, the bar edges are found by stepping through each row and column of the pixel matrix and looking for the transition between black and white with a simple threshold algorithm looking at the gray scale information. This method is used to measure the fused silica bar angles by making an image that includes two edges. A typical bar edge consists of several hundred points that are used to define the edges. A special line-fitting algorithm is needed to reject those points lying on “chips”. We achieve resolution on the edge position of about 1 micron.
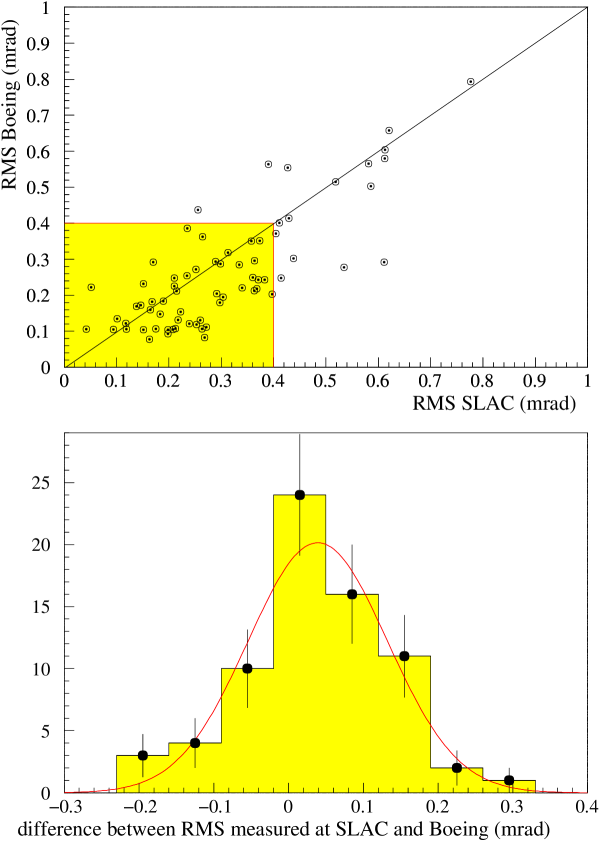
The manufacturer uses a micrometer-based fixture to measure bar angles, and this method was occasionally calibrated with an auto-collimator (this method yields a precision of approximately 50 rad). Comparing differences in side-to-end and face-to-end angle measurements using our method and the Boeing method yielded a fitted error of less than 0.15 mrad, which gave us confidence that the two methods are consistent and can be used to reject bars that are out of tolerance. The face-to-side angle measurement comparison gives adequate, but somewhat worse agreement of about 0.23 mrad. We accept bars to be used in the DIRC using the following statistical procedure: using all four face-to-side angles on both sides of the bar, we calculate the of the eight values. The production tolerance is 0.4 mrad for the of eight values, with a goal of 0.25 mrad in each angle. Figure 27 shows an example of the good agreement between measurements by Boeing Co. and SLAC, which gave us confidence in the manufacturer s data.
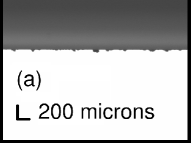
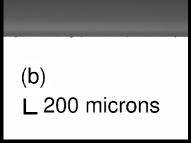
Finally, the digital treatment of the entire image allows a quantitative analysis to be performed on the quality of the edges. Figure 28 shows an example of a good and bad bar edge as seen by the microscope and the corresponding software. Once bar production began, all of the bars easily passed the requirement that the total area of edge chips be less than 6 mm2.
7 Conclusions
The results presented in this paper demonstrate the importance of the extensive R&D and QA conducted during DIRC development and construction. It is apparent that without this program, the DIRC would not have performed as well as required.
Perhaps the most fundamental results are related to the choice of material:
-
•
Natural fused silica materials, when exposed to a radiation dose as low as 5-10 krad, suffer from serious radiation damage, resulting in substantial transmission losses in the blue and UV. All synthetic fused silica samples, however, were found to be sufficiently radiation hard for B A B AR.
-
•
Some synthetic fused silica materials, made in the form of ingots, show periodic optical inhomogeneities. This effect can be sufficiently large to make the DIRC inoperable.
Acknowledgments
We would like to thank H. Krüger for important contributions during his 1996 summer stay at SLAC. We also thank R. Reif, M. McCulloch, and M. Schneider for their excellent technical help.
References
- [1] B. Ratcliff, SLAC-PUB-6047, January 1993.
- [2] B. Aubert et al. [BABAR Collaboration], “The B A B AR detector,” Nucl. Instr. Meth. A 479, 1 (2002).
- [3] Epotek is a trademark of Epoxy Technology, Inc., 14 Fortune Drive, Billerica, MA 01821, USA.
- [4] Vitreosil-F is a trademark of TSL Group PCL, Wallsend, Tyne on Wear, NE28 6DG, England; Sold in the USA by Quartz Products Co., 160 W. Lee Street, Louisville, Kentucky 40201.
- [5] Suprasil is a trademark of Heraeus Amersil Inc., 3473 Satellite Blvd. 300, Duluth, Georgia 30136
- [6] Spectrosil is a trademark of TSL Group PCL, Wallsend,Tyne on Wear, NE28 6DG, England; Sold in the USA by Quartz Products Co., 160 W. Lee Street, Louisville, Kentucky 40201.
- [7] This parameterization of the fused silica refraction index comes from the Melles-Griot Company s catalog, which is taken from I. H. Malitson, Journal of the Optical Society of America, Vol. 55, No. 10, October 1965, pp. 1205-1209. The quoted accuracy of index is .
- [8] The refraction index data for water come from N.I. Koshkin, M.G. Shirkevich, Handbook of Elementary Physics, 1982.
-
[9]
J. Va’vra, “Measurement of EPOTEK 301-2 Optical Glue
Refraction Index and Reflectivity from EPOTEK 301-2/Fused
Silica Interface,” B A B AR DIRC Note444
Copies of DIRC Notes can be requested at
http://www.slac.stanford.edu/BFROOT/www/Detector/DIRC/notes.html . #140, July 2001. - [10] J. Va’vra, “Quartz absolute internal reflection coefficient, water transmission, mirror reflectivity, mean wavelength response, mean refraction index, and their effect on the expected number of photoelectrons and N0,” B A B AR DIRC Note44footnotemark: 4 #129, April 2000; see also Nucl. Instr. Meth. A 453 (2000)262-278.
- [11] Electron Tubes Limited, Bury Street, Ruislip, Middlesex HA4 7TA, England.
- [12] M. Convery, B. Ratcliff, J. Schwiening and J. Va’vra, “Measurement of Periodic Structure in Synthetic Quartz,” B A B AR DIRC Note44footnotemark: 4 #130, April 2000.
- [13] S. Yellin, “Diffraction from an Oscillating Refractive index,” B A B AR DIRC Note44footnotemark: 4 #75, April 1999.
- [14] K. Abe et al., Nucl. Instr. Meth. A 343 (1994) 74-86.
- [15] H. Krüger, M. Schneider, R. Reif and J. Va’vra, “Initial Measurements of Quartz Transmission, Internal Reflection Coefficient and the Radiation Damage,” B A B AR DIRC Note44footnotemark: 4 #18, January 1996.
- [16] Hamamatsu Co., 250 Wood Ave, Middlesex, New Jersey 08846.
- [17] Melles Griot Laser Group, 2051 Palomar Airport Rd., 200, Carlsbad, CA 92009.
- [18] H. Krüger, R. Reif, X. Sarazin, J. Schwiening and J. Va’vra, “The Optical Scanning System for the Quartz Bar Quality Control,” B A B AR DIRC Note44footnotemark: 4 #54, October 1996.
- [19] Boeing Optical Fabrication, 2511 C Broadbend Parkway NE, Albuquerque, New Mexico 87107.
- [20] J. Cohen-Tanugi, M. Convery, J. Schwiening and J. Va’vra, “The First DIRC Bar Box,” B A B AR DIRC Note44footnotemark: 4 #122, April 1999.
- [21] H. Krüger, R. Reif, X. Sarazin, J. Schwiening and J. Va’vra, “Measuring the Optical Quality of Quartz Bars and the Coupling of RTV to the Window,” B A B AR DIRC Note44footnotemark: 4 #40, May 1996.
- [22] Nanolase, JDS Uniphase, 31 Chemin du Vieux Chene, 38240 Meylan, France.
- [23] JDS Uniphase Corporation, 1768 Automation Parkway, San Jose, CA 95131 USA.
- [24] J. M. Elson, H. E. Bennett, and J. M. Bennett, Scattering from Optical Surfaces, Applied Optics and Optical Engineering, Vol. VII, Chapter 7, Academic Press, Inc., ISBN 0-12-408607-1979.
- [25] J. Cohen-Tanugi, M. Convery, J. Schwiening and J. Va’vra, “Study of the Internal Reflection Coefficient of DIRC bars as a Function of Quartz Surface Pollution”, B A B AR DIRC Note44footnotemark: 4 #131, April 2000.
- [26] I. Adam et al., IEEE Trans. Nucl. Sci. 45 (1998) 657-664.
- [27] R. Aleksan et al., Nucl. Instr. Meth. A 397 (1997) 261.
- [28] Natural fused silica material JGS3-IR was made by the Institute of Technology, Beijing 100081, P.R. China.
- [29] T-08 is a trademark of Heraeus Amersil Inc., 3473 Satellite Blvd. 300, Duluth, Georgia 30136
- [30] C.E. Barnes, IEEE Trans. Nucl.Sci., Vol. Ns-29, No.6, Dec. 1982, p. 1479.
- [31] X. Sarazin, M. Schneider, J. Schwiening, R. Reif and J. Va’vra, “Radiation Damage of Synthetic Quartz and Optical Glues,” B A B AR DIRC Note44footnotemark: 4 #39, October 1996.
- [32] S.W.S. McKeever, “Thermo-luminescence of solids,” Cambridge Solid State Science Series, Cambridge University press, p. 187, 1988 edition.
- [33] Synthetic fused silica material JGS1-UV was made by the Institute of Technology, Beijing 100081, P.R. China.
- [34] B. Mayer, D. Lhullier, Private Communication.
- [35] Optical RTV glues SES-403 RTV, SES-406 RTV, and KE-108 RTV are trademarks of Shin-Etsu Silicones of America, Inc., 1150 Damar Street, Akron, Ohio 44305-1201.
- [36] Optical RTV glue Rhodorsil-141 is a trademark of Rhodia USA, 259 Prospect Plains Road CN 7500, Cranbury, NJ 08512-7500.
- [37] The DIRC mirrors were manufactured by Custom Optical Elements Inc., 51 N. Pecos #105, Las Vegas, Nevada 89101.
- [38] J. Cohen-Tanugi, M. Convery, M. McCulloch, R. Reif, J. Schwiening and J. Va’vra, “Development of a Digital Microscope for the DIRC Quartz bar Quality Control,” B A B AR DIRC Note44footnotemark: 4 #132, May 2000.
- [39] NIH Image is a public domain image processing program developed at the U.S. National Institutes of Health and available on the internet at http://rsb.info.nih.gov/nih-image/.