Atmospheric neutrino oscillations from upward throughgoing muon multiple scattering in MACRO
Abstract
The energy of atmospheric neutrinos detected by MACRO was estimated
using multiple coulomb scattering of upward throughgoing muons.
This analysis allows a test of atmospheric neutrino oscillations,
relying on the distortion of the muon energy distribution.
These results have been combined with those coming from the upward throughgoing muon
angular distribution only. Both analyses are independent of the neutrino
flux normalization and
provide strong evidence, above the 4 level, in favour of neutrino
oscillations.
PACS: 14.60Lm,14.60.Pq, 25.30.Mr
1 Introduction
00footnotetext: Also INFN Milano, 20133 Milano, ItalyAlso IASF/CNR, Sez. di Bologna, Italy
Also Department of Physics, Pennsylvania State University, University Park, PA 16801, USA
Also Università di Trieste and INFN, 34100 Trieste, Italy
Also U. Minn. Duluth Physics Dept., Duluth, MN 55812
Also Dept. of Physics, MIT, Cambridge, MA 02139
Also Intervideo Inc., Torrance CA 90505 USA
Also Department of Physics, SLIET,Longowal,India
Also Dipartimento di Fisica dell’Università della Calabria, Rende (Cosenza), Italy
Also RPD, PINSTECH, P.O. Nilore, Islamabad, Pakistan
Also Institute for Space Sciences, 76900 Bucharest, Romania
Also Università della Basilicata, 85100 Potenza, Italy
Also Dip. di Energetica, Universit‘a di Roma, 00185 Roma, Italy.
Also Dipartimento di Scienze e Tecnologie Avanzate, Università del Piemonte Orientale, Alessandria, Italy
Also Resonance Photonics, Markham, Ontario, Canada
Corresponding authors: SCAPPARONE@BO.INFN.IT,
SIOLI@BO.INFN.IT
The results obtained by experiments looking for neutrinos coming from natural or artificial far sources gave the first indication of physics beyond the standard model. Neutrino flavor changing is in fact the most straightforward explanation for electron and muon neutrino disappearance and for the evidence of non electron neutrinos from the sun. In this scenario, the study of atmospheric neutrinos plays an important role to improve our understanding of the neutrino oscillation mechanism.
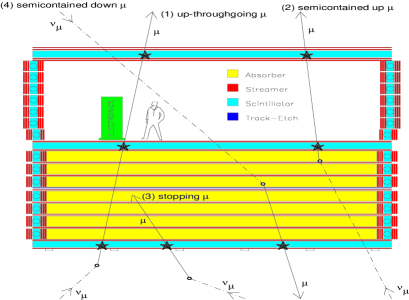
The MACRO detector studied [1, 2, 3] three categories of events as shown in Fig. 1: (1) upward throughgoing muons, (2) upward semicontained muons, and (3+4) upward stopping muons plus downward semicontained muons. The (3+4) categories cannot be separated experimentally, because the events have only one time measurement. However, upward stopping muons and downward semicontained muons have similar parent neutrino energy.
An atmospheric muon neutrino deficit was found in all of the three categories and an angular distribution distortion was found in category (1). Such results are explained by the neutrino oscillation hypothesis with parameters and =1, in good agreement with the Super-Kamiokande results [4]. A detailed study of the upward throughgoing muon angular distribution by MACRO [3] and by Super-Kamiokande [5] allowed the exclusion at the 99C.L. of the muon neutrino into sterile neutrino oscillation mechanism, compared to the muon neutrino into the tau neutrino.
Considering a two flavor neutrino oscillation, the probability for a to oscillate to is given by:
| (1) |
where (km) is the distance between the neutrino production and interaction points and () is the neutrino energy. The different categories of events quoted above have median energy from to , which provides evidence of the dependence on neutrino energies, as required by the oscillation hypothesis. In this paper we address for the first time the estimate of the upward throughgoing muon energy by using multiple scattering. The implementation of this method to the MACRO data is discussed in Section 2. Two different analysis were performed. The first one, using the tracking system in digital mode, is described in Section 3. Section 4 shows the results obtained with the streamer tube in drift mode, where electronic readout of the hit time was used to improve the position resolution and thereby the range of muon energies that could be estimated.
2 The muon energy estimate
The MACRO detector was extensively described in [7]. The detector consisted of a lower half (the lower detector) and an upper half (the “Attico”). The lower detector had 10 horizontal planes of streamer tubes separated by either crushed rock absorbers () or (at its top and bottom) a plane of scintillator counters. The had 4 horizontal planes of streamer tubes separated into two groups with a plane of scintillator counters between them.
Upward throughgoing muons are mainly produced in neutrino deep inelastic scattering (DIS) in the rock below the detector. The recoil hadrons are lost and the muon energy is degraded in the propagation to the detector. Nevertheless, Monte Carlo simulations show a linear relation between the parent neutrino energy and the muon residual energy at detector level.
The momentum resolution obtainable from multiple coulomb scattering (MCS) measurements is the result of two different contributions: the number of sampling planes and the space resolution of the detector . In MACRO the number of tracking planes interleaved with rock absorbers gives . The resolution of the streamer tube system used in digital mode is and was improved to by using the drift time. The other six horizontal tracking planes are separated by a negligible amount of material, and do not contribute to the MCS measurements.
In a tracking detector with equispaced tracking planes, separated by
a given absorber and neglecting the energy losses,
the characteristic momentum scale can be written as [8]:
| (2) |
where is the distance between tracking planes and is the material radiation length. For p, the main limitation to the momentum reconstruction comes from the number of sampling planes while for p the space resolution dominates. Under the conditions quoted above the relative momentum error [8] can be written as:
| (3) |
for p, and
| (4) |
for p. As shown in [8] the 1/p distribution approaches a Gaussian only for N30; therefore the momentum error for MACRO is not expected to have a Gaussian behaviour. The eight horizontal streamer tube planes interleaved with rock absorbers (planes 2 to 9, from the bottom) are equispaced and have the same space resolution, hence =. Since about 90 of upward throughgoing muons have p , the intrinsic chamber resolution dominates. The MCS-based momentum estimates scale therefore as the square of the space resolution .
The r.m.s. of the lateral displacement of a relativistic muon crossing a layer of material with depth is proportional to the inverse of muon momentum [9]:
| (5) |
In MACRO, X25/, giving on the vertical /. Therefore, a saturation point above requires a space resolution better than . An improvement in the space resolution increases the maximum energy value (saturation point) above which the MCS method is not effective.
Consequently we decided to improve the streamer tube resolution: in the second analysis, described in Section 4, we took advantage of the QTP-TDC electronics, developed for magnetic monopole searches [7]. In this case, we obtained an improved space resolution, [11], which allowed us to estimate the muon energy up to .
For both analyses, we used the whole sample of upward throughgoing muon events collected with the complete apparatus in a period of data taking equivalent to 5.5 years of live time. We studied upward muon events selected by the time-of-flight measured by planes of scintillators combined with the standard MACRO tracking algorithm. The original upward throughgoing muon data set has been described previously [3]. To make a comparison between real data and expectation we performed a Monte Carlo simulation using the Bartol neutrino flux [12] and the GRV94 DIS parton distributions [13] for deep inelastic scattering. For low energy neutrino interactions we used the cross sections given in [14]. The energy loss for muons propagating through rock is taken from Lohmann et al. [15] while the muon simulation inside the detector was performed with GMACRO (the GEANT 3.21 based detector simulation). For the second analysis, where the streamer system is used in drift mode, another simulation chain has been implemented. In this case neutrino interactions are randomly distributed in a rock semi-sphere below the detector. Muons are then transported to the detector using the FLUKA99 package[6]. A Monte Carlo statistics corresponding to a live time of 2700 years was produced (500 equivalent experiments). This simulation was compared with that used in[1, 3], obtaining a satisfactory result.
3 The first analysis: streamer tubes in digital mode
Because of MCS in the lower detector, with this analysis we expect a measurable deflection between the incoming and the outgoing track directions for muons with energies smaller than . This corresponds to an effective arm-lever of between the lower detector and the [7].
The eight lowest streamer tube planes were used, through a track refit, to estimate the direction of the incoming muon. The five upper streamer tube planes in the lower detector and the four planes were used to estimate the direction of the outgoing muon. The distance between the intercepts of the two tracks in the plane, and the difference between the two slopes depend on the muon energy . We divided the upward throughgoing muons in three sub samples, according to the values of and : sample L= Low energy, if and ; H= High energy if and . The remaining events were classified as M=Medium Energy. These cuts were optimized using two large samples of real atmospheric muons: downward throughgoing (average energy of [16]), and downward going stopping muons (average energy of ).
The aforementioned cuts were applied on the upward throughgoing muons (crossing the whole apparatus, lower detector + Attico), both real and simulated. They were selected from the same analysis chain [1] and had the same data format. From the simulation we expect 430 events: 178 of Low energy, with , 59 of Medium energy, with and 193 of High energy, with . From the real data, 316 events were selected: 101 of Low, 51 of Medium and 164 of High energy.
The and events were further divided according to their zenith angle : events from the vertical direction , and events with . For each event topology the number of detected and expected events were determined and ordered with decreasing value of the / (= average value of neutrino path length). The relative systematic uncertainty on each of the five / values is 12.5, coming from the uncertainties on the neutrino spectrum and angular shape (discussed in Sect. 4.3), from the detector related effects and analysis cuts. This includes the number of planes used for the refit, the definition of the cuts, the fluctuations in the streamer tube and scintillator efficiencies, and detector acceptance uncertainties.
We evaluated for the hypothesis of no neutrino oscillations using the five / bins, plus the additional point from the analysis of semi contained upward going events (IU) [2] (upgoing neutrinos with ). We found that the distribution agrees with the no oscillation hypothesis with a probability lower than 2%). For two-flavor oscillations with parameters e and we get a probability of 45%.
4 The second analysis: streamer tubes in drift mode
The performance of the streamer tube system, read out in drift mode, is described in [11]. Here an absolute muon energy calibration was performed at the PS-T9 and SPS-X7 beams, where a slice of the MACRO detector was reproduced. The MCS information was handled by a neural network, based on JETNET 3.0[17], calibrated with the muon beams quoted above. The neural network(NN) output obtained using test beam data, was compared with that expected from the Monte Carlo simulation, obtaining a satisfactory agreement[11]. The application of such analysis to the MACRO data resulted in an improvement of the space resolution from to .
Figure 2 shows the Monte Carlo prediction for NN downward throughgoing muons and downward going stopping muons compared with experimental data. A nice agreement between simulation and real data is found for both categories, representing a large energy interval.
The result of the neural network output energy calibration shows that NN output is almost linear with , increasing with the muon energy up to , where a saturation effect occurs. With respect to the approach used in[11] few details of the neural network were optimized: the neural network training and the energy calibration was performed separately for events with hits in the upper part of the detector(Attico).
Although smeared by the energy carried away by hadrons and by energy loss in the rock, the detected neutrino induced muons still carry on average 40 of the original neutrino energy. By using the full Monte Carlo simulation quoted in Sect. 2, we calibrated the NN output as a function of ): the calibrated NN output is linear up to 2.15. We may write:
| (6) |
where is the difference between the of the real and of the reconstructed neutrino energy. Taking into account that the NN output was calibrated as a function of , the energy resolution / was obtained by plotting the quantity /.

In Fig. 3 we show the resolution that could be obtained with an ideal muon energy resolution(dotted line) and that obtained with the present analysis(continuous line).

The precision of the neutrino energy estimate obtained with an ideal muon energy resolution detector is 70, while with the present method a resolution of /150 is obtained. The asymmetry present in both curves comes from neutrino interactions occurring far from the detector, for which a large fraction of the muon energy is lost during the transport.
4.1 Data Selection
We used the 783 upward throughgoing muon data set collected in the full detector run started in 1994. Table 1 describes further event selection to arrive at the sample for MCS analysis. We required a single track in both the wire and the strip view. We selected hits belonging to the track and made of a single fired tube, to associate unambiguously its QTP-TDC time information. This cut is effective for muon tracks with large zenith angles ( 30∘), while it is quite loose around the vertical: we restricted the present analysis to events with . Comparisons were performed between simulated and experimental downward going muon data, to ensure that the selection efficiency, in the used angular window, is the same in the Monte Carlo and in the real data. Spurious background hits have been avoided by requiring a time window of 2 s around the trigger time. Finally, we selected events with at least four streamer tube planes with valid QTP-TDC data. We fitted the drift circles using the same tracking developed to analyse test beam muons. A minimum path length of in the lower detector is required for tracks hitting the and for tracks not hitting it. These geometric requirement ensure a minimum depth of material where muons may experience a measurable amount of multiple scattering and a lever arm long enough for a comfortable tracking. After the selection cuts 300 events survived, giving an overall efficiency of 38.3.
| Cuts | Number of |
| events | |
| Total number | 783 |
| of upward | |
| throughgoing muons | |
| Single track in the | 695 |
| wire and strip views | |
| 4 planes with | 347 |
| valid TDC hits | |
| Track length cut | 314 |
| 300 |
4.2 Qualitative tests
We used the information provided by the neural network to separate the neutrino events into four energy subsamples, as shown in Table 2. The same selection was applied to simulated events.
| Sample | Energy cuts | Median energy |
| () | () | |
| Low | 30 | 13 |
| Medium-Low | 3080 | 36 |
| Medium-High | 80130 | 88 |
| High | 130 | 146 |
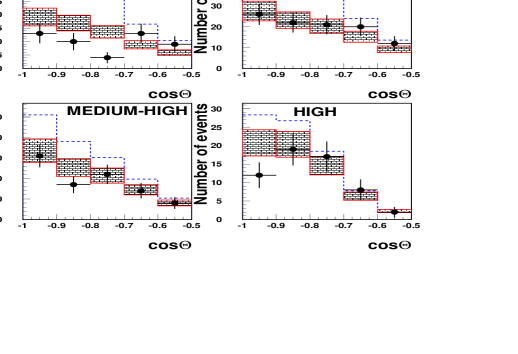

Figure 4 shows the zenith angle distributions of the upward throughgoing muons in the four energy subsamples, compared with the expectations of the Monte Carlo simulation, assuming no-oscillations(dotted line) and oscillations with parameters = 2.5 and 1 (wall boxes). The Monte Carlo including the oscillation hypothesis, with the parameters quoted above, reasonably reproduces the real data in each subsample. We point out the strong difference between the oscillations/no-oscillations hypotheses at low energies, while such difference is reduced by increasing the reconstructed neutrino energy.
Finally, we used information on the ratio . The distance , travelled by the neutrinos from production to the interaction points, was measured by MACRO relying on the muon zenith angle determination, with a precision /. The resolution on the ratio is therefore fully dominated by the uncertainty in the neutrino energy estimate, giving a relative error of . The ratio DATA/Monte Carlo as a function of , is plotted in Fig. 5. The black circles are the real data over the Monte Carlo predictions, assuming no oscillations, the shaded regions represent the Monte Carlo predictions with oscillations, = 2.5eV2 and =1, divided by the Monte Carlo predictions with no oscillation.
The () distribution of the neutrinos detected by MACRO spans from 0.8 to 3.5. The left-pointing arrow at low () represents the effect of the neural network saturation. Since the maximum energy reconstructed by the NN is and since the minimum for the present analysis is 6500 km, the minimum estimated value is (1.7. As far as the right-pointing arrow at high is concerned, the reconstruction of neutrino energy based on the residual muon energy, does not allow one to reconstruct the ratio L/E beyond a given limit. This is due to far neutrino interactions, originated by high energy muons, which lost a large fraction of its energy. An ideal detector with ideal muon residual energy resolution, requiring , would select an average ()=3.2. Finally, the neural network resolution in muon energy estimate results in a maximum value ()=3. The dashed line at 1 is the expectation without oscillations. The last point(empty circle) is obtained from semicontained upward going muon rate[2]. It is not used for the evaluation of the oscillation probabilities (Sect. 4.4) nor in the allowed region plot(Fig. 7). Good agreement is found with the oscillations expected with the parameters quoted above.
4.3 Experimental results
To quantify the contribution of the multiple scattering measurement in stand-alone mode, we performed a blind analysis using the Monte Carlo data, looking for the variable, based on the energy estimate, showing the maximum sensitivity to separate the oscillation from the no-oscillation hypothesis. We found that the best performance is given by the ratio:
| (7) |
where and are the number of events with and respectively.
We considered systematic uncertainties due to the neutrino flux calculation and neutrino cross section. Due to the large uncertainty in the absolute flux [18, 19, 20, 21], we use in this paper only the angular distribution and the ratio between different event categories selected according to the reconstructed energy. Nevertheless, the theoretical uncertainty of the existing neutrino flux, based on the old CR spectrum[12], has to be accounted for. We varied the input primary cosmic ray spectral index in our simulation by =0.05, obtaining a theoretical error on R, =13.
Another source of systematics comes from the neutrino cross section. We looked at R varying the Monte Carlo input cross sections. The most important contribution to the error comes from the “Low” category, since the cross section at low neutrino energy is more uncertain. By comparing the cross section computed under several hypotheses, varying for instance the structure function ([13],[23]) in the deep inelastic scattering, including or neglecting the contribution of resonant scattering, we found =9 . We estimated a total theoretical error = =16. The systematic error on R reconstruction, evaluated in 6, includes the uncertainties on absorber density, drift velocity, streamer tube efficiency and detector acceptance.
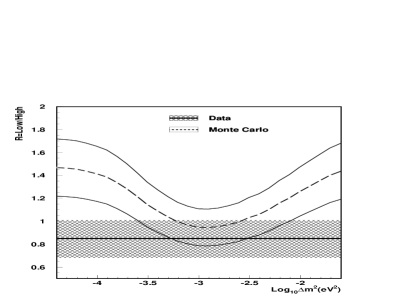
Figure 6 shows the ratio R as a function of , assuming maximal mixing, for the Monte Carlo simulation: the area between the two solid curves represents the 17 systematic error. The Monte Carlo prediction in case of no oscillations is =1.50.25(theo.+sys.), while for =2.5 and =1, R=1.000.17(theo.+sys.). As pointed out in[3], the ratio does not have a Gaussian distribution. The errors on the ratio are therefore also not Gaussian: they are reported just to give a crude estimates of the significance. The experimental ratio is =0.850.16(stat.). The one sided probability of measuring a value smaller than the measured one, was computed by using two different methods. In the first one we let the Monte Carlo simulation (no oscillations) to fluctuate according to statistical and systematic errors of the considered ratio. We then evaluated the fraction of events giving a value smaller than the measured one. In a more pessimistic view, rejecting the hypothesis that the lower number of events detected by MACRO with respect to the Monte Carlo expectation is due to oscillation effects, the total number of Monte Carlo events (sum of the numerator and the denominator in the ratios), were normalized to the experimentally measured sum and then they were allowed to fluctuate.
The corresponding one sided probability of measuring a value smaller than according to method 1 (2) is 0.75(1.9) corresponding to 2.4(2.1 ).
| Ratio | |||
|---|---|---|---|
| 1.000.17 | 0.850.16 | ||
| 1.700.14 | 2.200.17 | 1.480.13 |
Finally, we combined the information coming from the energy estimate and from the angular distribution. We considered the ratio:
| (8) |
where is the number of upward throughgoing muon events with -0.7 and is the number of events with -0.4, as discussed in [3]. The probability of measuring a value lower than according to the method 1 (2) is P(A’)=0.001(0.01), corresponding to 4.3 (3.7). It is worth noting that, combining the two independent probabilities on the ratios R and A, the probability that a fluctuation of the expected values(no oscillations) generates the experimental results is P()=1.3(3.2), corresponding to 4.7 (4 ).
5 Conclusions
Muon multiple coulomb scattering has been used to estimate the energy of the neutrino induced upward throughgoing muons detected by MACRO. The different tests performed on the data, using the estimated energy (separation in

subsamples with different energies, estimates, etc.) give a consistent picture, all of them supporting the neutrino oscillation hypothesis with parameters 2.5 and 1. To quantify such effect, the ratio was used, in stand-alone mode and in combination with the angular distribution, . Both of them are independent of the neutrino absolute flux. The significance of the MACRO observation of the neutrino oscillations is above 4.
Acknowledgements
We gratefully acknowledge the support of the Director and of the staff of the Laboratori Nazionali del Gran Sasso and the invaluable assistance of the technical staff of the Institutions participating in the experiment. We thank the Istituto Nazionale di Fisica Nucleare (INFN), the U.S. Department of Energy and the U.S. National Science Foundation for their generous support of the MACRO experiment. We thank INFN, ICTP (Trieste), WorldLab and NATO for providing fellowships and grants (FAI) for non Italian citizens.
References
- [1] MACRO Collaboration, S. Ahlen et al., Phys. Lett. 357 (1995) 481; M. Ambrosio et al., Phys. Lett. B434 (1998) 451.
- [2] M.Ambrosio et al. (MACRO Collaboration), Phys.Lett. B478 (2000)5.
- [3] MACRO Collaboration, M. Ambrosio et al., Phys. Lett. B517 (2001) 59.
- [4] Super-Kamiokande Collaboration, Phys. Rev. Lett. 81 (1998) 1562; Phys. Rev. Lett. 82(1999) 2644.
- [5] Super-Kamiokande Collaboration, Y. Fukuda et al., Phys. Rev. Lett. 85 (2000) 3999.
- [6] A. Ferrari and P. Sala, Proc. of the Workshop on the Nuclear Reaction Data and Nuclear Reactors Physics, Design and Safety, ICTP, Trieste(Italy), 1996, World Scientific, A. Gandini and G. Reffo eds., 2 (1998) 424.
- [7] MACRO Collaboration, S.Ahlen et al., Nucl. Instr. & Meth. A234 (1993) 337; M. Ambrosio et al., Nucl. Instr. & Meth. A486(2002) 663.
- [8] See for instance T. Bolton, hep-ex/9705007.
- [9] See for instance Particle Data Group, D. E. Groom et al., The Europ. Phys. Journ. C15 (2000)166.
- [10] Estimate of the energy of upgoing muons with multiple Coulomb scattering, D. Bakari et al. for the MACRO Collaboration, NATO ARW on Cosmic Radiation: From Astronomy to Particle Physics, Oujda(Morocco), Mar. 21-23, 2001, Ed. by G.Giacomelli, M.Spurio and J.E.Derkaoui; hep-ex/0105087.
- [11] MACRO Collaboration, M. Ambrosio et al., Nucl. Instr. & Meth. A492 (2002) 376.
- [12] V. Agrawal et al., Phys. Rev. D53 (1996) 1314.
- [13] M. Gluck et al., Z Phys. C67 (1995) 433.
- [14] P. Lipari et al., Phys. Rev. Lett. 74(1995) 4384.
- [15] W. Lohmann et al.,CERN-EP/85-03, March 1985.
- [16] MACRO Collaboration, M. Ambrosio et al., Astr. Phys. 10 (1999) 11.
- [17] C. Peterson et al., Comput. Phys. Commun., 81 (1994) 185.
- [18] W. Menn et al., Astroph. J. 533 (2000) 281.
- [19] R. Boezio et al., Astroph. J. 518 (1999) 457.
- [20] J. Alcaraz et al., Phys. Lett. B490 2000 27, Phys. Lett. B494 2000 193.
- [21] T. Sanuki et al., Astroph. J. 545 2000 1135.
- [22] T.K. Gaisser et al., Proc. of 27th ICRC(2001) 1643; hep-ph/0203272.
- [23] J.G. Morfin and W.K. Tung, Zeit. Phys C52 (1991) 13.
- [24] G.J. Feldman and R.D. Cousins, Phys. Rev. D57 (1998)3873.