NuMI-PUB-GEN-0880
Detector R&D for future Neutrino Experiments
with the NuMI Beamline
October 21, 2002 (revised November 11, 2002)
A report to the Fermilab Directorate from the Study Group
on Future Neutrino Experiments at Fermilab.
G. Barenboim,1 A. Bodek,2 C. Bromberg,3 A. Bross,1 L. Buckley-Geer,1 B. Choudhary,1 D. Cline,4 F. DeJongh,1 G. Drake,5 S. Geer,1 M. Goodman A. deGouvea,1 D. A. Harris K. Heller,6 J. Huston,3 J. Johnstone,1 M. Kostin,1 J. Learned,7, P. Litchfield,6, M. Marshak,6, K. McDonald,8 K. S. McFarland,2 S. Menary,9 M. Messier,10 D. Michael,11 R. Miller,7 N. Mokhov,1 J. K. Nelson,1 E. Peterson,6, R. Richards,7, K. Ruddick,6, F. Sergiamepietri,4 P. Shanahan,1 R. Shrock,12 Y. Seo,4 R. Stefanski,1 M. Szleper,13 K. Tollefson,3 J. Urheim6
-
*
Editors
-
1.
Fermilab National Laboratory
-
2.
University of Rochester
-
3.
Michigan State University
-
4.
University of California at Los Angeles
-
5.
Argonne National Laboratory
-
6.
University of Minnesota
-
7.
University of Hawaii
-
8.
Princeton University
-
9.
York University
-
10.
University of Indiana
-
11.
California Institute of Technology
-
12.
State University of New York at Stonybrook
-
13.
Northwestern University
1 Executive Summary
This document is the result of a request from the Fermilab directorate to (i) investigate the detector technology issues relevant for future long baseline experiments and (ii) consider the associated detector R&D that would be needed to prepare the way for future neutrino oscillation experiments using the NuMI beamline. Because of the narrow energy spread provided by an off-axis beam and the resulting low intrinsic electron neutrino background, as well as the very favorable duty cycle of the NuMI beamline, a well-placed neutrino detector at the surface of the earth could take the next important steps in neutrino oscillation physics. The biggest outstanding issue in this field is whether or not the last unmeasured element of the leptonic mixing matrix, parameterized by the mixing angle , is nonzero. If it is in fact non-zero, this opens the door to measurements of the neutrino mass hierarchy and, if the solar neutrino oscillations are described by the LMA solution, searches for CP violation in the lepton sector. In order to get to any of these measurements, an off-axis detector must be capable of measuring the transition probabilities as well as the survival probabilities, at the energies present in these off-axis beams, which could lie anywhere from 0.6 to 3 GeV. Optimal baselines and energies will depend on the physics goal of the experiment. For example, an optimization of the sensitivity for appearance from a beam assuming eV2 would lead to a baseline of 700-900 km and an energy of GeV.
Consideration of future neutrino experiments can be separated into three phases (starting now):
-
I.
0-5 years: the beginning of the MINOS project.
-
II.
5-10 years: off-axis experiments using the current NuMI beam.
-
III.
10 years: future superbeam/neutrino factory program with larger detectors.
It is already clear that a future program is desirable to search for CP violation if LMA is confirmed, or if a non-zero value for is found in I or II. Even if LMA is not confirmed, a second phase is important to push the sensitivity for , and possibly to measure the mass hierarchy. What is also clear from examining different detector concepts is that the detector one would chose to perform a phase II experiment may not be the one chosen for phase III. If is still not seen in phase III, there is still a possibility of measuring it in a neutrino factory, but the detector issues associated with that experiment are far less challenging, and are documented in a previous report [1]. Because a neutrino factory produces beams of and or and , a detector simply has to identify the presence and charge of an outgoing muon to address both the atmospheric oscillation parameters and .
We outline in this document several detector possibilities for an experiment at an off-axis site along the NuMI beamline: water Cerenkov, several versions of fine-grained calorimetry, liquid argon TPC, and mention in passing the AQUARICH concept. In this executive summary we wish to mention the salient features of each technology, and the key issues to address before choosing the technology for either a phase II or phase III detector.
Conclusions about Water Cerenkov:
-
•
Much expertise in the field with large detector performance
-
•
20 kton fiducial mass proof of principle exists
-
•
Operation at the surface not obvious but perhaps possible (K2K)
-
•
Could be promising for high angle lowest energy (sub-GeV) beams, but
-
•
Monte Carlo studies show identification above 2 GeV compromised due to inability of detector to discriminate between high energy neutral current production, and charged current interactions.
-
•
R&D efforts being pursued elsewhere already for JHF to HK, which include developing cheaper and more robust photodetectors. This won’t change the background rejection capabilities, however.
-
•
Since individual particle energy resolution is not a limiting factor, the AQUARICH technology is not likely to have very different conclusions than regular water Cerenkov devices.
Conclusions about Liquid Argon TPC’s:
-
•
Monte Carlo Studies show this to be the most efficient detector for keeping signal and rejecting background
-
•
Cosmic ray studies in Pavia show that backgrounds at the ground level are manageable assuming acceptable data handling capabilities.
-
•
Economies of scale and experience of Liquid Natural Gas industry promising for a large (phase III) single-volume detector.
-
•
Need to verify that particle identification works as well as predicted in simulations–this could be a promising phase III detector, but we strongly recommend placing a prototype detector in a neutrino beam which could prove the performance in the first few radiation lengths of a neutrino interaction.
Conclusions about Fine-Grained Calorimetry:
-
•
Monte Carlo studies show that for a GeV off-axis neutrino beam, this detector has adequate background discrimination and energy resolution, and the processes that generate the signals are well-understood (thresholds well below those for water Cerenkov, for example, and there’s a long history in the field of sampling calorimetry).
-
•
Low Z absorber would provide the maximum amount of mass per readout plane, but low density induces large separations between consecutive readout planes. Backgrounds induced by operation at the surface must be verified.
-
•
Different readout technologies have different risks associated with them:
-
–
RPC’s: possibly the cheapest readout per , but operational difficulties have been encountered in the past.
-
–
Streamer Tubes: are likely to be the next cheapest readout.
-
–
Liquid or Solid Scintillator is the easiest to operate, no tricky gas or high voltage systems to build.
-
*
Depending on light collection technique, the integration time could be quite long, implying bigger cosmic ray problems.
-
*
Minimum R&D, can use much of what was learned while designing MINOS.
-
*
Gains in recent past to reduce fabrication costs for solid scintillator
-
*
Liquid scintillator would be easy to install in situ.
-
*
R&D on solid scintillator currently being performed by the K2K collaboration for a new near detector.
-
*
-
–
-
•
Different absorber ideas have different risks associated with them:
-
–
Is the cost of containing the water for a water-absorber detector prohibitively high?
-
–
Would particle board warp too much to be acceptable for housing detector elements?
-
–
Can any solid low z material provide enough mechanical support for readout?
-
–
-
•
Finally, before one embarks on a full-scale construction of a fine-grained calorimeter, one should certainly produce a prototype, where at least one dimension of the prototype would be the size of a single module.
There are a few issues which must be addressed regardless of detector
technology: for example, what is the the optimal segmentation that is required
to get an acceptable neutral current rejection factor? Also, does the detector
technology respond as predicted to charged particle beams?
Recommendations
For phase II, we specifically recommend focused R&D on fine-grained calorimetry: this technique appears to have the smallest amount of risk associated with it, and although there are several options for absorber and readout technology, the outstanding issues are largely engineering ones, and can be addressed relatively quickly.
For both phases, we will need to improve our understanding of neutrino interactions in the NuMI Off-axis energy regime. In phase II this is critical to get to the best precision on measuring the disappearance probability, and in phase III this will be essential to optimize the design of what is likely to be a M$ detector. We therefore recommend that as early as phase I that there be a program established to study neutrino interactions in a location underground at the NuMI beamline facility.
For phase III, large water Cerenkov detectors or liquid argon offer scaling advantages. In addition to sensitivity for , if placed underground, such detectors would be sensitive to proton decay and other topics of underground physics. Since the time scale for phase III R&D will take longer, it is important that this effort start now. We recommend building a small prototype to test in (but slightly off the axis of) the NuMI beamline, somewhere in the near detector hall.
Finally, the most sensible path to the physics is not simply to improve the far detector’s size and/or performance. Investments in both the proton source (as early as phase I) and the beamline itself (phase III) will improve the experiment’s sensitivity dramatically, and in a more economical way than by simply increasing the detector size.
The writers of this report look forward to joining the R&D programs and collaborations which are forming to pursue future neutrino initiatives.
2 Introduction
Although we as a field have been trying to detect neutrinos for a very long time, the different techniques we use are highly constrained by the fact that neutrinos are so very weakly interacting. As an example, consider the historic first and the most recent reactor neutrino detector: Reines and Cowan used 17 tons of liquid scintillator instrumented with phototubes to see the neutrinos from the Savannah River reactor, and KamLAND is using 1000 tons of liqiud scintillator instrumented with phototubes to see neutrinos from reactors located all over Japan. Of course the light collectors have improved and expanded, the timing, electronics, and data acquisition has improved, but the fundamental technique for studying reactor neutrinos has not changed.
Just as the topology of neutrino interactions changes dramatically as the neutrino energy increases, so too does the detector technology. At the high energy limit (above a few GeV), neutrinos simply break apart the nucleus and one can measure the incoming neutrino energy from a charged current interaction by calorimetric sampling measurements of the final state particles, which are classified as either the outgoing lepton, or the “hadronic shower”. Again, the MINOS detector today is not fundamentally different from the E1A experiment at Fermilab, which measured neutrino interactions calorimetrically with mineral oil-based scintillator and spark chambers, followed by an iron spectrometer. MINOS combines the spectrometer and calorimeter functions, but the detector concept has not changed.
In this document we will discuss detectors which are being considered for use in the 1-3 GeV regime, in other words, the regime between the two extremes described above. This regime is suitable for experiments which are off the axis of the NuMI beamline, which are very well-positioned to take the next steps in neutrino oscillation physics.
The recent compelling evidence for neutrino oscillation, and hence neutrino masses and lepton mixing, in solar and atmospheric neutrino experiments, has led to an intensive program of experimentation to explore further this physics. Fermilab is strongly positioned in this program with the MiniBooNE experiment now beginning data-taking [2] and the MINOS experiment under construction [3]. MINOS will use a neutrino beam with an energy of order a few GeV, traversing a pathlength of km, from Fermilab to Soudan, MN and will perform several very important measurements, including (i) charged-current event rate and energy spectrum, which will check the results of the atmospheric neutrino experiments and is expected to measure the values of and to about 10 %, and (ii) the neutral-current event rate, which will provide a cross-check on the oscillation fit and put constraints on the involvement of light electroweak-singlet neutrinos in the oscillations. The proton beam intensity is anticipated to be between about 0.25 MW and 0.4 MW. The above sensitivities are based on 10 kton-yrs of data, i.e. about 2 yrs with the 5 kton MINOS detector. The MINOS program is nicely complementary to the CERN-Gran Sasso neutrino program, in which the OPERA experiment is designed to explicitly detect appearance [4]. In Japan, the rebuilding of Super-Kamiokande is almost complete, and the K2K experiment is expected to begin running again in late 2002. Beyond this, there is an ambitious long-baseline neutrino oscillation experiment that plans to use of an intense beam from the Japan Hadron Facility JHF which will traverse a distance of 295 km to the fully rebuilt Super-Kamiokande detector [5] (JHF-SK). This beam will have an energy GeV and be produced by an intense 0.77 MW proton beam at JHF. The JHF-SK experimental program envisions measurements of disappearance to get high-precision determinations of and and a search for oscillations down to a sensitivity of of 0.0015 [5] (see further below). Assuming requisite funding for beamlines, etc. the JHF-SK experiment expects to start commissioning in 2007-2008. Later running with a beam is also planned, and consideration has been given to a second phase of the JHF-Kamioka neutrino program involving the construction of a very large 1 Mton water Cherenkov detector, Hyper-Kamiokande.
Given the large investment that the U.S. high-energy physics community has made in MINOS, and the fact that, together with MiniBooNE, it will be the center of the domestic U.S. accelerator neutrino program during the next 10 years, there is strong motivation for planning upgrades and extensions of this experiment. Several studies have discussed the physics that could be accessed with a higher-intensity conventional neutrino beam, also involving upgrades to the proton intensity, at Fermilab [6]-[13]. Earlier related efforts studied the physics reach of a neutrino factory, including the U.S. studies [1, 14] and related studies in Europe and Japan. In the U.S. an effort is also underway to study the physics potential of long-baseline neutrino oscillation experiments using the BNL AGS, upgraded from 0.14 MW to 0.5 MW, with a very large, multi-hundred kton water Cherenkov far detector [14, 15].
Here we address research and development for a second far detector using the NuMI beam and optimized for the study of oscillations. This is known as the search for (or ). As described in Section 2, this is the only element of the MNS matrix which has not been measured (only upper limits are presently available). Measurement of a non-zero is required to measure the neutrino mass hierarchy through matter effects, and ultimately to search for CP violation in future neutrino long-baseline experiments.
The MINOS far detector is comprised of magnetized iron slabs with plastic scintillator and is a coarse-grained sampling calorimeter with muon ID and momentum measurement. It can provide some modest sensitivity to oscillations but is not optimized for this. A major background is neutral current production, since it is difficult to distinguish the shower produced by the from the shower produced by an electron. The search for oscillations motivates planning and constructing a second, fine-grained, far detector which would take advantage of the NuMI beam. To reduce the high-energy part of the neutrino flux and thereby reduce backgrounds to this search due to neutral current production, the use of an off-axis position for this second far detector becomes crucial.
The physics goals of this program would thus include the following:
-
•
Further measurement of disappearance and determination of and to higher accuracy.
-
•
Improving the reach for a non-zero probability for of about a factor of 10 past the CHOOZ limit, or a probability sensitivity of about 0.3%. (comparable to the JHF-SK program[5]). By careful choice of baseline and energy, this measurement, when combined with a possible JHF measurement, could start to take the next important steps of addressing the mass hierarchy and CP violation.
-
•
Given that some interesting baselines are quite long, of order km (assuming that the typical neutrino energies explored will be above 1 GeV), the study of matter effects (which is possible if one runs both neutrino and antineutrino beams) should allow the determination of the neutrino mass hierarchy. Such a measurement cannot be performed by the JHF-SK experiment in Japan, as currently envisioned [5]. It should be noted that this is obtainable even if the solution to the solar neutrino puzzle is not in the LMA region [12].
- •
Given this possible physics potential, there is more than enough motivation to carry out an R&D study of various promising types of detectors and simulations of their response. A study group has been meeting at Fermilab for the past year to discuss this. Recently one report was submitted [20]. We believe that it is clear that this work should be pursued with further R&D.
The organization of this report is as follows: Theoretical Motivations for future neutrino experiments are outlined in Section 3. Comments about the beam spectrum and the features of an off-axis beam are given in Section 4. Section 5 discusses issues such as energy resolution which are common to any detector technology. Sections 6 and 7 includes subsections on a variety of possible detector choices. Where appropriate, a discussion of future R&D for each detector choice is made in a separate subsection. Total absorption detectors considered include Liquid Argon, Water Cerenkov Detectors, and Water RICH detectors. Sampling detectors discussed readouts which include solid scintillator, liquid scintillator, limited stream tubes and resistive plate chambers. In Section 8, we discuss a number of other R&D issues which cannot be neglected, but do not concern a specific detector technology, such as the importance of understanding both cosmic ray backgrounds and neutrino cross sections, as well as target survival issues, the NuMI lattice, and possible proton intensity upgrades. Section 1 summarizes the salient features and outstanding issues with each detector technology.
3 Theoretical Motivations
In a modern theoretical context, one generally expects nonzero neutrino masses and associated lepton mixing. There is currently strong experimental evidence for neutrino masses and mixing. One source of this evidence is from solar neutrino experiments, most recently, Super-Kamiokande and SNO [21]. This data can be fit by oscillations of the solar ’s into and , with the relevant eV2 (at 90% confidence level) and mixing angle [22]. Strong evidence also comes from atmospheric neutrino experiments, especially Super-Kamiokande [23], with confirming results from Soudan-2 and MACRO. The atmospheric neutrino data can be fit by oscillations with eV2 (also at 90% confidence level) and maximal mixing, [23]. A pioneering long-baseline accelerator neutrino oscillation experiment, K2K [24], has obtained data consistent with Super-Kamiokande results. The sum of data from these experiments can be explained in terms of oscillations involving the three neutrinos , , and , members of electroweak doublets. This data excludes light electroweak-singlet (“sterile”) neutrinos as playing a large role in the oscillations. There is also a reported observation of oscillations by the LSND experiment [25], which is not confirmed, but also not completely excluded, by the similar KARMEN experiment [26]. The LSND claim will be tested by the MiniBooNE experiment at Fermilab [2], which is currently in an early commissioning phase, and expects to present definitive results in about two years.
In the standard model generalized to include neutrino masses and without mixing with light sterile neutrinos, the weak leptonic charged current has the form , where the vector of neutrino mass eigenstates is and the analogous vector of charged lepton mass eigenstates is . The unitary lepton mixing matrix depends on three Euler rotation angles , , and , and a phase , all of which can be probed in neutrino oscillation experiments, and (potentially) two other Majorana phases which cannot be directly tested. For and ignoring matter effects, the probability for is
| (1) |
where
| (2) |
and . Since the best fit to the Super-Kamiokande data has maximal mixing, it follows that and . The latter constraint also arises from the CHOOZ reactor antineutrino experiment [27]. The CHOOZ limit is dependent on the input value used for ; for the current central value eV2, this is , while for eV2, it is [27].
In the limit (this applies if the solution to the solar neutrino puzzle is in the LOW region),
| (4) |
in vacuum. Hence, since one knows and moderately well from the atmospheric neutrino data (and these determinations will become more accurate with MINOS), it follows that a measurement of, or search for, will immediately yield the value of, or a limit on, .
In general, however, (this applies if the solution to the solar neutrino puzzle is in the LMA region, which is favored by the current solar neutrino data) several of the terms in Eq. (3) can be of the same order of magnitude. In this case, a signal for (or lack thereof) does not easily translate into a clean measurement of (or upper bound on) , unless all other parameters are precisely known. It should also be noted that, if matter effects [17] are important, the survival probabilities will also depend on another observable, namely the neutrino mass hierarchy, which we choose to parametrize by the sign of . (Whether matter effects are visible depends on the energy of the neutrino beam and on the baseline length; they tend to be more important for higher energies and longer pathlengths.) This ultimately implies that, in order to determine or constrain , it is necessary also to determine several other neutrino oscillation parameters, including the neutrino mass hierarchy and the CP-odd phase . This can only be achieved by comparing different channels (neutrino and antineutrino oscillations) and/or different neutrino beams and different baselines.
Turning the picture around, the study of the subleading transition ultimately enables (indeed, requires) one to explore leptonic CP violation. This leptonic CP violation involves the phase (and two Majorana phases which cannot be directly probed with neutrino oscillations) and is measured by the rephasing-invariant quantity [28] determined via the product ,
| (5) |
Because one knows that from the atmospheric data and in the LMA fit to the solar data, it follows that in the leptonic sector may be much larger than its value of few in the quark sector. Furthermore, the values of and are such that the corresponding three neutrino mass eigenstates are sufficiently large and nondegenerate so as to allow possible experimental exploration of leptonic CP violation in long-baseline neutrino oscillation experiments. It should be noted that comparison of neutrino and antineutrino disappearance also allows one to probe violation of CPT [29].
4 NuMI Off Axis Neutrino Spectra
The NuMI beamline is designed to produce relatively wide-band neutrino beams of peak energies ranging between 3.5 and 14GeV. Its focusing system consists of two horns, which, depending on their relative spacing and their spacing from the NuMI target, can focus pions of varying momentum ranges. Because muon neutrinos come predominantly from 2-body meson decays, the neutrino energy at a far detector is determined simply by geometry and kinematics:
where is simply the parent meson’s relativistic boost, is the parent meson’s mass, and (assumed to be ) is the angle in radians between the detector and the parent meson’s direction of flight.
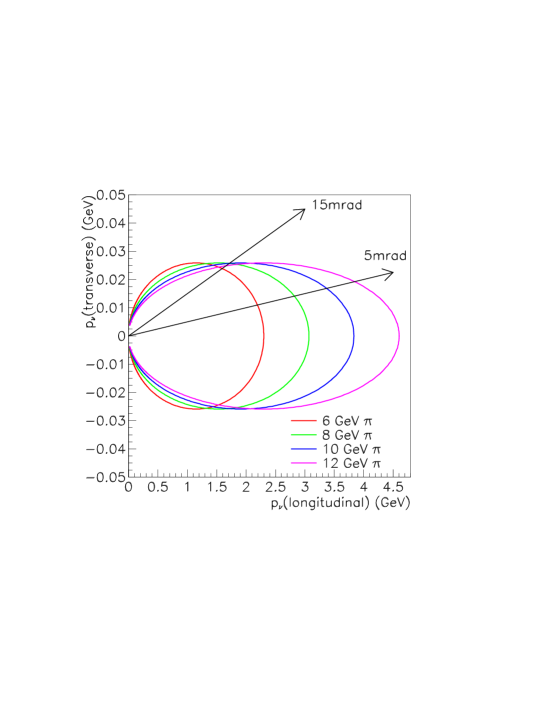
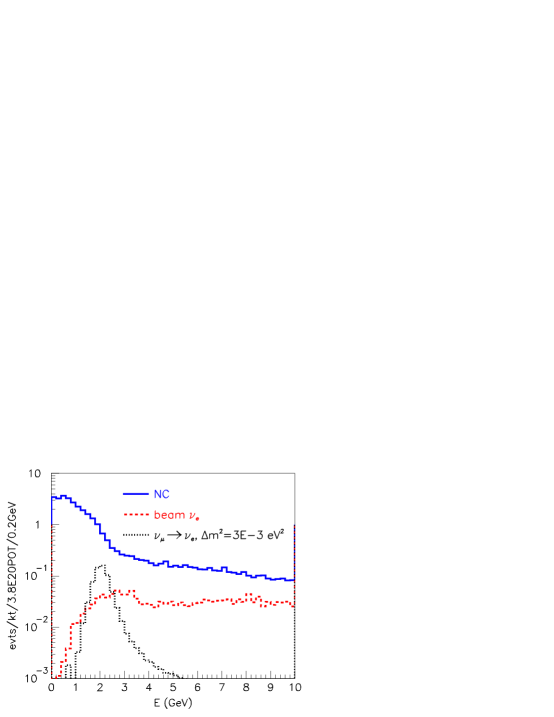
For a perfectly-focused meson beam, and a detector at , the neutrino energy is simply proportional to the parent meson’s energy. However for a detector at a non-zero angle, the energy is considerably less, and no longer proportional. Figure 1 shows the transverse versus longitudinal neutrino momentum for perfectly focused pions of different energies. The neutrino energy is simply the length of the line from the origin to any point on the circle. Note that at a particular angle, the pions of many different energies contribute neutrinos of the same energy–at this angle the flux from two-body decays has the narrowest energy spread. The intrinsic background, since it arises from three-body decays, is not peaked in this way, so the relative signal to background at this angle is maximized. For detectors which are 0 and 15mrad from the beamline axis, the neutrino spectra which can be produced by the NuMI beamline is shown in figure 2. Notice also that the actual flux of neutrinos at 2GeV is higher for an off-axis beam, which means the average oscillation probability ( for that beam is in fact higher as well.

5 Detector Issues and Comparison
5.1 Introduction
As was discussed in the previous sections, the next big step for our field to take in neutrino oscillations, is to see if there are transitions between muon and electron neutrinos at the atmospheric neutrino mass splitting. For conventional neutrino beams, this means at the minimum building a detector that can distinguish between electrons and muons. However, given that the oscillation probability we are trying to measure has already been limited to less than 5% at 90% confidence level by CHOOZ, and that the intrinsic electron neutrino contamination in a conventional beam can be a few percent, detectors will have to do significantly more. Furthermore, not only are there likely to be other final state particles present in the neutrino charged current interaction, confusing the signal, but neutral current interactions, in which there is no final state lepton, can also provide a background through the production of neutral pions.
5.2 Detector Requirements for
A summary of the detector challenge in the NuMI Off-axis beam can be found in Figure 3. This plot shows the true visible energy distribution for different possible events at the detector: a signal at , the intrinsic , and the neutral current background, assuming no particle identification. Note that in order to reduce the neutral current background to the level where it is comparable to the signal at the CHOOZ limit, in the limit of perfect energy resolution, one must have a background rejection factor of about 4 or 5. As you add in energy resolution you need even better background rejection, since the backgrounds are flat or steeply falling in energy, while the signal is very peaked.
5.2.1 Neutral Current Rejection in a superbeam
The dominant background process that any detector must be ready to cope with is that of neutral currents. Neutral pions are often produced in neutral current interactions, and the two photons to which they decay can easily be mistaken for an electron, in certain detectors. In this section we will discuss how different detectors might see these neutral pions.
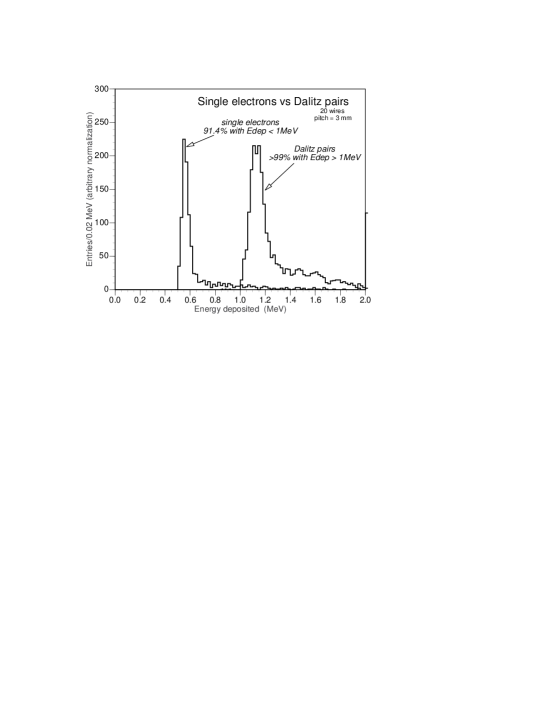
If one had an extremely fine-grained detector, then discriminating between electrons and neutral pions would be straightforward: electrons have only one charged particle with an electromagnetic shower, while pions will decay to photons, which convert to two electrons. So in a liquid argon detector, for example, one can simply look at the energy lost by a track in the first few radiation lengths after the event vertex, and converted photons will have twice the energy loss as single electrons. This is shown in Figure 4, which is from the ICARUS proposal. Presumably, if the electrons have enough energy to travel a few radiation lengths, then above that minimum energy this cut would be extremely efficient at removing the neutral current events, without significant loss of signal.
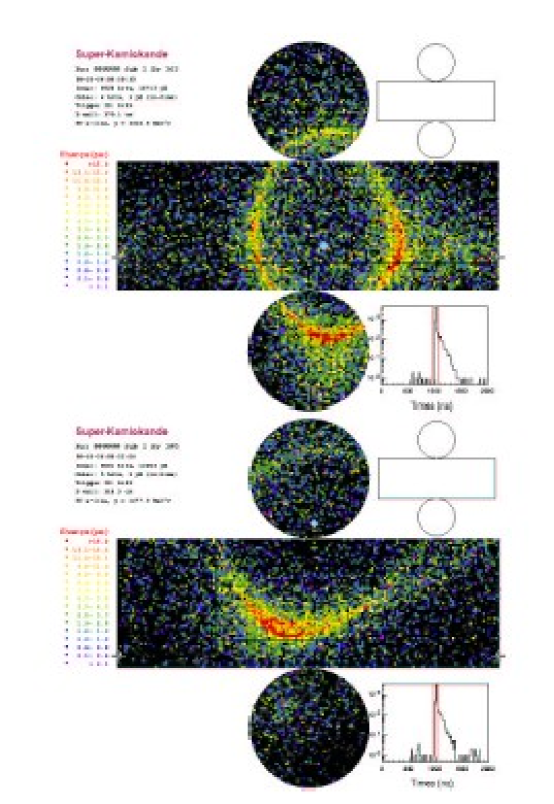
Still another way to discriminate between electrons and neutral pions is to see the two photons separately, as can be done in the water cerenkov or the aquarich technology. For low energy ’s, the two photons are very well separated, and the only significant background occurs when there is a very asymmetric decay, producing only one electromagnetic shower. As the pion energy gets larger, however, the two cerenkov rings from the photons get closer together, and then resolving two rings becomes too difficult given the intrinsic widths of the rings themselves. Figure 5 shows the event displays in the Super-Kamiokande monte carlo for an electron neutrino charged current interaction, and one for a neutral pion with two rings that are very close to overlapping.
Even if a detector cannot discriminate two photons separately, the electromagnetic shower from a may be wider than that from a signal electron. In order to do this, the segmentation of the detector must be finer than one Moliere radius , which characterizes the width of an electromagnetic shower (on average, 90% of the shower’s energy is contained in a cylinder of radius ). According to the PDG, the Moliere Radius for solids is well-approximated by the formulae
. In table 1 we give the salient features of many of the materials considered for detectors in this document.
| Radiation | Moliere | ||||
|---|---|---|---|---|---|
| Density | Length | Radius | |||
| Material | |||||
| Argon | 18 | 1.4 | 19.55 | 14 | 9.4 |
| Water | 3ish | 1 | 36.1 | 36 | 5.4 |
| Carbon | 6 | 2.3 | 42.7 | 19 | 4.7 |
| Steel | 26 | 7.9 | 13.84 | 1.8 | 1.7 |
| Plastic | 3ish | 0.7 | 43.7 | 62 | 9.4 |
| (Polystyrene) | |||||
Finally, the one remaining difference between electron neutrino charged current events and neutral current events is their “electron candidate” energy distribution. For real charged current interactions, the ratio of lepton energy to total energy is roughly flat (and peaked towards one for antineutrino interactions!), while for neutral current interactions, the distribution of energy is peaked at very low energies. Figure 6 shows the momenta for electrons in charged current events in 2GeV neutrinos, as well as the neutral pion momentum distribution for neutral current events of 2GeV neutrinos, as generated by the NUANCE neutrino event monte carlo. Although a cut on the electron energy will not provide a large rejection factor compared to the signal acceptance, it would still provide some discrimination.

5.2.2 Signal Efficiency, Background Rejection, and Mass
For a given beam with a particular intrinsic electron neutrino contamination, there are various approaches one might take: one could try to build a very fine-grained detector with a high efficiency which removes all the backgrounds, or one could try for something more coarse-grained, with the assumption that even if the background level is higher, because the coarse-grained detector could presumably built to be more massive for the same amount of money.
Clearly the goal for any detector is to remove as much of the background as possible while keeping the signal efficiency high. However, because of the intrinsic electron neutrino background in the beam, it is not worthwhile to reduce the neutral current background well below the intrinsic background at the expense of signal efficiency. We therefore define the neutral current backgrounds for different detectors by how large they are compared to the intrinsic beam background under the oscillation peak. Table 2 shows the results for both signal efficiency and background rejection from different geant-based analyses which have used the NuMI off-axis beam at 15mrad as input.
| Signal | NC | |||
|---|---|---|---|---|
| Detector | Efficiency | fake rate | NC/ | Reference |
| Liquid Argon TPC | 0.90 | 0.001 | ICARUS TDR | |
| Steel/Scintillator | 0.40 | 0.2% | 1 | hep-ph/0204208 |
| Plastic/RPC | 0.35 | 0.2% | 1 | hep-ex/0210005 |
| Water Cerenkov | 0.24 | 1% | 2 | this document |
In order to understand how to get the largest reach on measuring for a given investment in money, it is useful to first see how much mass one would need of these different kinds of detectors for comparable sensitivities, and then see what the cost is for these different detectors of varying sizes. Furthermore, not all detectors’ costs scale as their mass: for example, for a water cerenkov device, if one simply scaled up the Super-Kamiokande detector in all dimensions, a large part of the cost would grow as the area of the vessel, since that determines the number of phototubes required. Finally, the real mass that counts here is the fiducial mass, which again is not a linear function of the detector mass (see the following section).
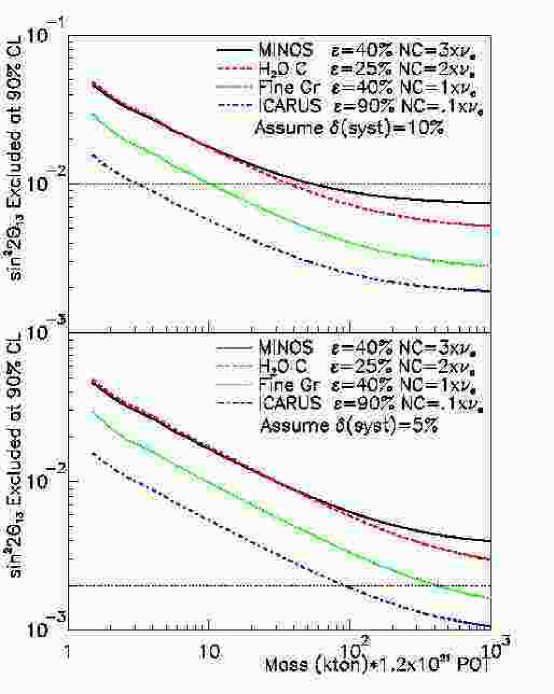
Figure 7 shows the 90% confidence level limit that one could achieve in the NuMI off-axis beamline, for a detector at 735km, 15mrad off axis, for different detectors as a function of detector mass. This analysis assumes no solar mass term effects, i.e. the probability for oscillations is simply . Note that for a sensitivity which is a factor of 10 past the CHOOZ limit, one would need approximately 5 ktons fiducial of Liquid Argon, 20kton of a fine-grained calorimeter, and 80kton of a water cerenkov device. Note also that for a sensitivity which would be significantly better, one would start having significant systematic errors, and so one would need to plan on reducing those below 10%, if one were to embark on a much larger detector or more powerful proton source.
5.3 Detector Requirements for
Although the primary motivation for an off-axis experiment is the search for a non-zero probability of to and its CP conjugate, it is important to remember that this experiment also has the potential to drastically improve the precision on the atmospheric neutrino parameters and , through the disappearance measurements in and beams. The extent to which is different from has important constraints on understanding the underlying symmetry breaking which gives rise to neutrino oscillations in the first place. Furthermore, when we ultimately want to determine whether or not CP violation is present in the lepton sector, degeneracies and correlations between the measured probabilities and the mixing angles themselves [30, 31] will require very precise disappearance as well as appearance measurements.
So although (a) the disappearance probability is expected to be large based on atmospheric results, (b) the neutrino beam produced is predominantly muon neutrinos, and (c) the fact that muons are easier to identify than electrons, there is still the same nagging issue of neutral current events. Figure 8 shows the event rate for an off axis beam (in the low energy configuration), with and without oscillations, and also shows what the visible energy distribution is for neutral current events, assuming no particle identification but perfect energy resolution. It is clear from this picture that the level at which a detector can distinguish an outgoing muon from, for example, the most energetic outgoing charged pion from a neutral current event is very important. This will determine whether or not the events “in the dip” will be charged current events which entered through detector energy resolution, or neutral current events, which of course are not affected by (active) neutrino oscillations. What is quite possible is that the most important uncertainty in this measurement is the neutral current background prediction, which is likely to be dominated by uncertainties in the cross sections, as will be discussed in Section 8.2. Once particle identification cuts are made (based on a detailed understanding of the detector response), this promises to be a very powerful constraint on the atmospheric parameters and .
5.4 Fiducial Versus Total Mass
While the physics return on any detector is proportional to the useful fiducial mass, the total cost is usually proportional to the total mass. That ratio depends on the geometry of the neutrino interaction, and the size and shape of the detector. In general, the fiducial efficiency is larger for a large detector. We will consider this ratio here for a liquid argon detector constructed in the form of a right circular cylinder of radius and height . The volume is , and the total mass of argon (density 1.4 metric tons/m3) is
| (6) |
for radius in meters.
Because the time projection chamber has electrodes at 250 kV, the instrumented volume must be set back from the cryostat wall by some distance m. Therefore, the instrumented mass of argon is
| (7) |
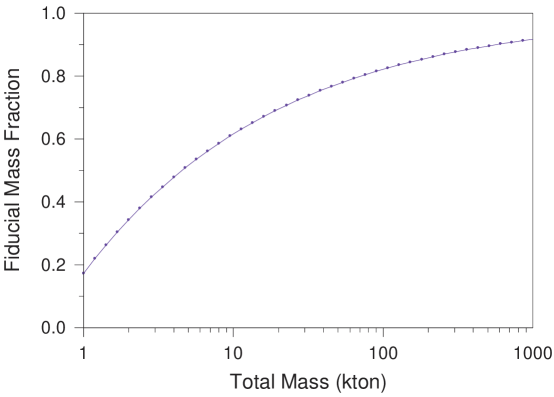
The fiducial volume is smaller than the instrumented volume because a neutrino interaction must be well contained within the detector to be useful in the physics analysis. Taking the physics emphasis to be electron neutrino appearance events, assume the characteristic volume of an interaction is a cylinder of about 5 Moliere radii () and about 18 radiations lengths deep (2.5 m). The events should not start closer than, say, 0.5 m from the edge of the instrumented volume, to insure that they originate from a neutral particle. Hence the radial depth of the fiducial volume is less than that of the instrumented volume by (2.5 + 0.5)/2 = 1.5 m, while the radial height and width are smaller by 0.5 m. These offsets must be combined with the high-voltage offset of 0.5 m, leading to the expression
| (8) |
which is illustrated in Fig. 9.
For a sampling calorimeter, which is expected to be roughly square in cross section, one could proceed with a simpler argument. For a sampling detector, one generally assumes that 1 meter is required between the edge of the detector and the interaction vertex. Consider first the loss from a cut in the transverse position of the vertex–for a 20kton detector which has a cross section, one is already losing (36%) of the events from a transverse vertex position cut, while for a cross-section detector, the same 1m cut incurs a loss of only 10% loss. Now consider the cut in the longitudinal position of the vertex: for that same detector, to accrue 22 total ktons, the detector would have to be about m long (assuming a density of 1), or about 150 radiation lengths (assuming water). To contain most of an electromagnetic shower, all accepted events would have to start some 18-20 radiation lengths upstream of the downstream end of the detector, which would again incur about a 10-13% loss in fiducial acceptance. Clearly an optimization for width and height for each absorber material is required, and for any detector technology considered it should be kept in mind that to contain all the hadronic as well as electromagnetic showers, one would have to make considerably larger fiducial cuts.
6 Total Absorption Detectors
6.1 Liquid Argon TPC
Among the options for a large neutrino detector, a liquid argon time projection chamber (TPC) [32] provides the greatest amount of information, in the form of fine-grain tracking as well as total-absorption calorimetry, via a very simple mechanical structure which is therefore very cost-effective when implemented on a large scale.
The power of a liquid argon detector is especially noteworthy for detection of charged-current electron-neutrino interactions of 0-2 GeV, where detailed tracking provides excellent rejection against neutral-current muon-neutrino interactions with a final-state . Hence, it is the most effective detector per unit mass for appearance measurements (of , the sign of , CP violation, …)
A liquid argon detector is a total absorption calorimeter with time-projection readout via the signal of drifting electrons collected in crossed planes of wires. The effective pixel size is about mm3, compared to the radiation length of 14 cm and nuclear interaction length of 55 cm. At a drift field strength of 500 V/cm, the drift velocity is about 1 mm/s, so the drift time over, say, 5 m would be 5 ms. Even if operated at the Earth’s surface with no shielding, a liquid argon TPC has only about 1 (localized) cosmic-ray track per m2 of horizontal surface per drift time, so events appear very clean.
A liquid argon detector of 100 ktons or more also has competitive capability for nucleon decay searches [33], particularly because it has high efficiency for the decay that is favored in many SO(10) SUSY models [34], as well as for atmospheric, solar and supernova neutrino physics. However, pursuit of these additional physics topics will likely require the detector to be sited underground, at considerable additional expense. Here, we emphasize a detector on the surface for use in a pulsed neutrino beam.
The reliability and stability of their electronic readout has led to the use of liquid argon calorimeters in numerous electron and hadron beam experiments over the past 20 years. A liquid argon TPC differs from these sampling calorimeters in having a long (2-5 m 2-5 msec) drift length. For stable operation over a long drift path the oxygen content of the liquid argon must be less than 0.1 ppb [35], which can be maintained by continuous filtration of the argon (both in liquid phase and in the boiloff/recondensation phase) using commercial Oxisorb cartridges [36].
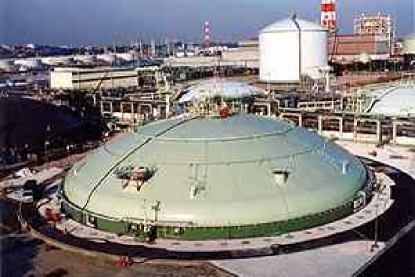
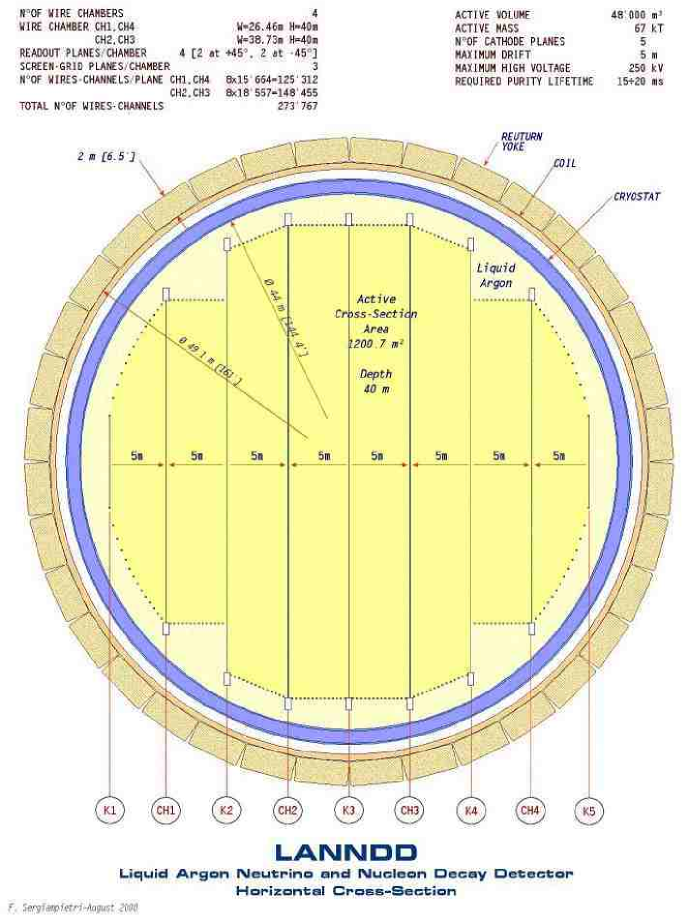
To obtain economies of scale, a large liquid argon detector should be implemented in a single cryostat, such as those commonly used in the liquefied natural gas industry. Cryogenic volumes of up to 200,000 m3 (= 280 kton if liquid argon) are now in use, as sketched in Figure 10.
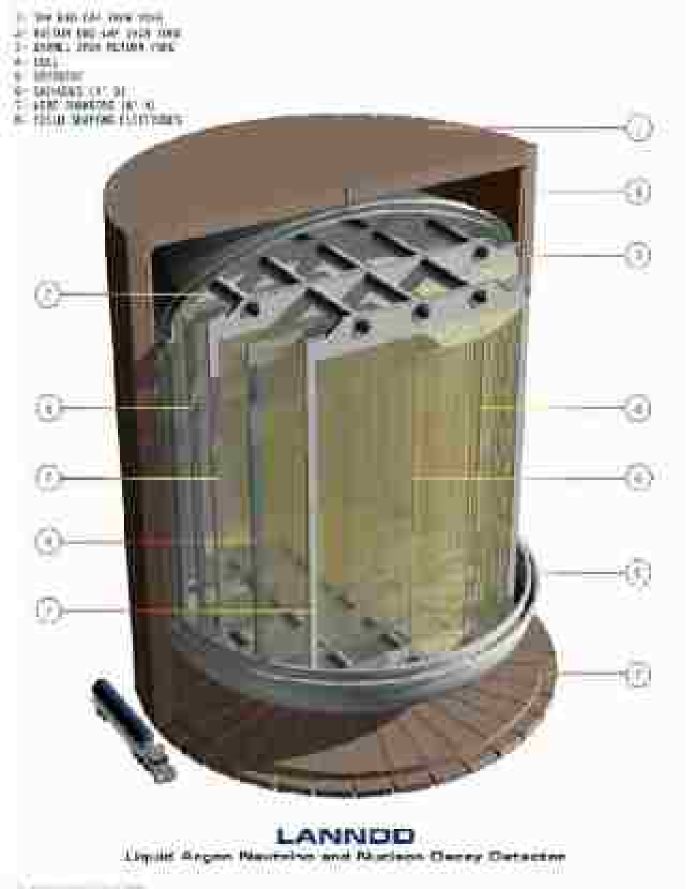
An overall concept of a large liquid argon detector is shown in Figure 11. The diameter of a large liquid argon detector will be greater than (twice) the maximum drift distance ( m as limited by oxygen impurities), so the readout must consist of a set of parallel anode and cathode planes that subdivide the detector, as shown in Figs. 11 and 12. Then, the number of readout channels scales as the surface area of the detector.
The data acquisition for a liquid-argon TPC can operate in a pipelined, deadtimeless mode, with zero-suppression [39]. This could permit fully live operation at the Earth’s surface for nucleon decay studies, in addition to triggered data collection of neutrino interactions from a pulsed accelerator beam. The data rate would, of course, be quite high in this case. It may nonetheless be less costly to implement a high rate data-acquisition system than to reduce the untriggered data rate by siting the detector deep underground.
Readout Channel Count
The instrumented volume of a liquid argon time projection chamber is organized into a set of cells of depth 3-5 m along the direction of the electric field ( 500 V/cm), as illustrated in Figure 12 for a 70-kton detector.
In a typical gas-phase TPC, the ionization electrons drift to an anode-wire plane at which Townsend amplification occurs, and the readout is based on time digitization of the induced signal size on pads on a nearby cathode plane.
In a liquid argon TPC no amplification of the ionization electrons is required, as a minimum ionizing particle creates about 50,000 electron-ion pairs per cm. However, the use of a pad readout plane would lead to a prohibitively large channel count. Instead, the signals are detected on two (or three) crossed wire planes (per cell). The ionization electrons pass by the first (and second if a total of three) of these planes, inducing signals on the wires, and are then collected on the second (or third) plane. The use of three readout planes, --, allows superior rejection of “ghost” images in case of multiple “hits” within a given time slice.
For operation of a large detector at the Earth’s surface, it may be preferable to have three readout planes to provide greater separation of neutrino events from “accidental” cosmic-ray events.
The ICARUS detector uses three readout planes, with a wire spacing of 3 mm on each plane. The time-sampling frequency of 2.5 MHz corresponds to sampling over 0.6 mm along the drift direction. Thus, the effective pixel size of the ICARUS readout is mm3.
The maximum wire length in the present ICARUS detector is about 9 m. It is proposed that longer wires be used in a larger detector, so that all wire connections can be made near the outer surface of the detector. Longer wires have larger capacitance (proportional to their length), and hence a given charge leads to a smaller voltage signal. As the present ICARUS detector operates near the limit of acceptable signal/noise, some change will have to be made for successful operation with longer wires.
A simple solution is to increase the wire spacing from 3 mm by the factor , where is the wire length. This increases the signal in the same ratio, while the capacitance increases by , and the signal/noise ratio actually improves by .
Of course, this solution increases the effective pixel size in the two transverse coordinates (but not along the drift coordinate where the time sampling frequency determines the pixel size). Additional study is required to determine whether such larger pixels would have a detrimental effect on the identification of electron neutrino interactions against the background of neutral current interactions.
For the present study, we assume that use of a larger wire spacing and an -- readout is appropriate for a large detector. For the particular example of a 100 kton detector ( m), where the wire length would be about 45 m, we considered use of a 1-cm wire spacing. The wire capacitance increases by compared to 9-m-long wires, and the signal size is 3.3 times larger than that for 3-mm wire spacing. Then a cell arrangement similar to that shown in Figure 12 (but with 10 cells of depth 4.4 m rather than 8 cells of 5-m depth) leads to a channel count slightly less than 300,000.
The channel count for detectors of other mass is scaled from this number according to the surface area, i.e., as .
Preliminary Cost Estimate
As well as being the highest-performance large detector for neutrinos, a liquid argon TPC is also one of the least costly. We have made a preliminary cost estimate for a 100 kton detector, assigning costs in two categories:
-
1.
Costs proportional to detector mass.
-
(a)
Liquid argon @ $700k/kton (delivered to a site in Minnesota) based on a preliminary budget estimate from the largest USA vendor of argon [40].
The annual production of liquid argon in the USA is about 1Mton, so filling of a large liquid argon detector in a timely manner is a significant perturbation on the entire USA market. The largest argon production facilities are located in Chicago and the Gulf Coast. To fill a 100 kton detector in one calendar year would require a tank truck every 2 hours, 24 hours a day.
-
(b)
The on-site cryogenic system for purification and recondensation of liquid argon, sketched in Figure 13, is estimated to cost $10M [41].
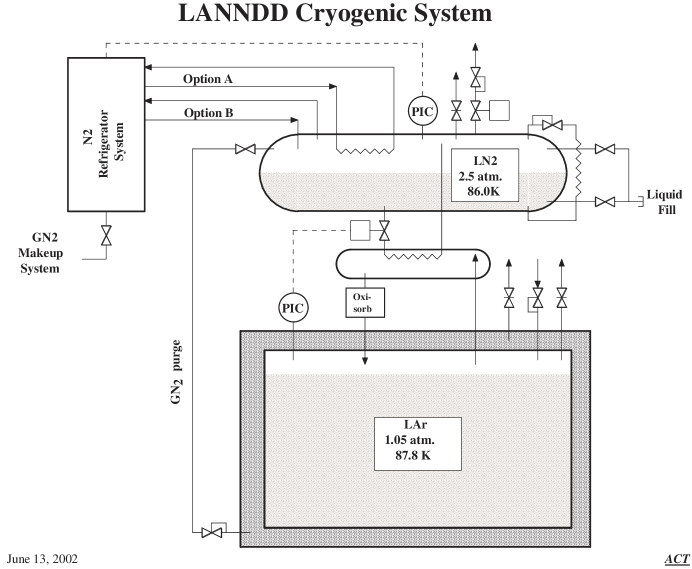
Figure 13: Cryogenic system for a 100-kton liquid argon detector [41].
-
(a)
-
2.
Costs proportional to detector surface area.
-
(a)
Site preparation, estimated at $10M.
-
(b)
Cryogenic storage tank, estimated at $20M based on a quotation from the leading USA vendor of liquefied natural gas storage tanks [41].
The inner vessel of a large cryogenic storage tank is welded together from nickel-steel plates. Present welding technology limits the plate thickness to 60 mm, and consequently the present maximum height of a tank is 30-40 m. That is, tanks for more than 100 kton of liquid argon will require an advance in plate welding technology. Such advances are, of course, of interest to the tank manufacturers independent of our application.
-
(c)
Readout electronics, $30M for 300k channels of commercial electronics designed for ICARUS, based on a discussion with CAEN [42].
If equivalent electronics were to be produced “in house” at Fermilab, the cost might be 30-50% less.
-
(d)
Computer systems, estimated at $10M.
-
(a)
In view of the very preliminary nature of these estimates, we add a 33% contingency. Table 3 summarizes this cost estimate.
| Component | Cost |
|---|---|
| Liquid argon (industrial grade) | $70M |
| Cryo plant, including Oxisorb purifiers | $10M |
| Surface site preparation | $10M |
| Cryogenic storage tank | $20M |
| Electronics (300k channels) | $30M |
| Computer systems | $10M |
| Subtotal | $150M |
| Contingency | $50M |
| Total | $200M |
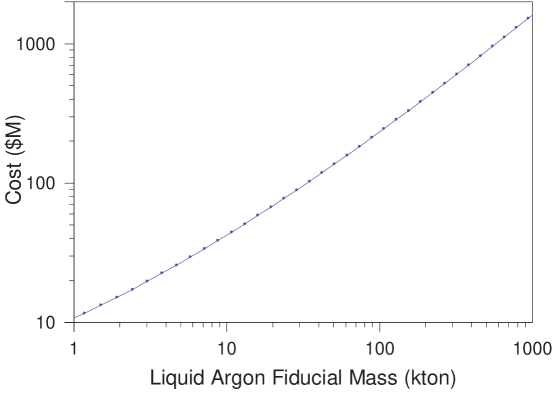
The cost estimate scales with total detector mass in ktons according to
| (9) |
The cost estimate as a function of fiducial mass can now be obtained using eq. (8), with results shown in Figure 14.
6.2 R&D Program for Liquid Argon
The ICARUS project continues to be the major source of R&D into hardware, software, and simulation of liquid argon time projection chambers. However, the ICARUS concept is presently limited to modules of about 1 kton. Before a larger module could be constructed, several issues should be addressed by additional R&D activity.
Hardware R&D Topics
-
1.
Liquid-phase purification of industrial grade argon via Oxisorb.
-
2.
Mechanics and electronics of wires up to 60-m long.
-
3.
Cryogenic feedthroughs, possibly including buffer volume at 150K for low-noise FET’s.
-
4.
Verification of operation of a liquid argon TPC at 10 atmospheres (as at bottom of a 100-kton tank).
R&D proposals to study item 4 have been submitted [43, 44, 45], but not yet funded. New initiatives are needed to address items 1-3, and the following:
Simulation Studies
-
1.
What is maximum wire spacing consistent with good background rejection of neutral current events, i.e., good identification?
Near Detector in the NuMI Beam
Associated with the opportunity for use of a large liquid argon TPC in the NuMI off-axis beam km from Fermilab is the need for a near detector to characterize the neutrino flux and to measure the low energy neutrino-argon cross section for energies up to 3-4 GeV. A near detector of fiducial mass of 1.5 tons at 1 km from the NuMI target is suitable for this, as it would detector about charged-current interactions per year [46].
Outside the fiducial volume for the neutrino interaction vertex, a near detector must contain electromagnetic and hadronic showers associated with the neutrino interaction. It will not be possible to range out the final-state muons in a detector of modest size, since the loss for muons is about 200 MeV/m. Therefore it will be necessary to immerse some or all of the liquid argon TPC in a magnetic field, or to follow the liquid argon TPC with a magnetic spectrometer.
Electromagnetic showers in liquid argon, whose radiation length is 0.14 m, are well contained within a cylinder of about 0.5 m radius and 2.5 m length. Low-energy hadronic showers are well contained within a cylinder of about 0.8 m radius and 5 m length, since the hadronic interaction length is about 0.8 m. A simple geometry for a near detector would be a cylinder of 2.4 m diameter and 7 m length, as shown in Figure 15 which is based on an earlier concept for a hadronic beam test of a liquid argon TPC [47]. The fiducial volume of this detector would be a cylinder 0.8 m in diameter and 2 m long, with volume of 1.0 m3 and fiducial mass of 1.4 tons. The total mass of liquid argon would be 37 tons. The readout channel count would be about 8,000.

Such a detector is intermediate in scope between the ICARUS 10-ton prototype [48] (whose fiducial mass is zero for neutrino interactions) and the ICARUS T-600 modules [49]. The principal costs of a 40-ton detector would be for the cryostat, the cryogenic system, and the electronic readout, very roughly $1M each.
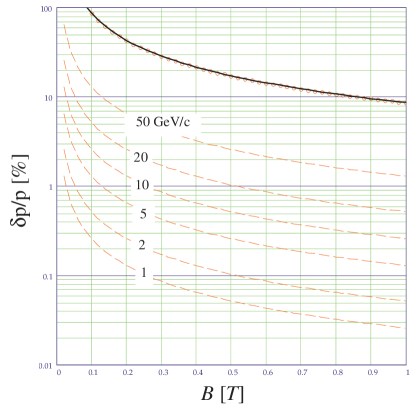
As noted above, it is necessary to measure the final-state muon momenta, which could be accomplished by superimposing a magnetic field over only part of the liquid argon detector. As indicated in Figure 16, a magnetic field of 0.5 T on the downstream 3 m of the detector would provide 15% momentum resolution up to 5 GeV muon energy. This fields could be provided, for example, by reconfiguring the superconducting coils originally used on the Fermilab 15′ bubble chamber.
6.3 Water Cerenkov Detectors
Water Cherenkov detectors have been closely associated with neutrino physics since the early success of the Kamiokande and IMB detectors in the 1980’s. These detectors consisted of a large volume of water surrounded by planes of photomultipliers. Neutrino interactions with the water produce charged particles which emit Cherenkov light. The pattern of Cherenkov light is recorded by PMT’s on the walls of the detector. The neutrino event vertex is reconstructed based on the PMT hit times. Particle types are reconstructed by the pattern of Cherenkov light with muons being characterized by collapsed rings ( in radius) at the lowest energies (100’s of MeV), sharp ring patterns at medium energies (a few GeV), and long tracks at the highest energies (several GeV). PMT hit patterns from electrons are typically much more diffuse when compared to the patterns resulting from muons. For single-ring events, the Super–Kamiokande detector has achieved a particle ID efficiency of 98% for interactions in the GeV range.
Currently, the Super–Kamiokande and SNO detectors are the state of the art in water Cherenkov detectors. These detectors have had great success with neutrino measurements from solar neutrino energies (a few MeV up through atmospheric neutrino energies (100’s of GeV) and Super–Kamiokande has been the target of the K2K long-baseline experiment.
Several properties of water Cherenkov detectors make the technology an excellent candidate for doing neutrino physics at neutrino energies at 1 GeV and below. A great deal of experience building and operating these detectors exists in the high energy physics community. Also, it is possible to achieve very large mass using this detector technology while keeping channel counts (and hence costs) under control. Further, the detectors have good energy resolution, can be very accurately calibrated, and have excellent particle ID performance.
As the energies of the neutrino interactions rises above 1 GeV, the analysis of neutrino interactions in water Cherenkov detectors becomes more difficult. As the neutrino energies increase, so too do the multiplicities of the final state interactions. This increase has two effects. The first is to degrade particle identification as the additional Cherenkov rings are likely to overlap one another at least partially. The second is a degradation of the neutrino energy resolution as more of the neutrino energy tends to go into making pions below Cherenkov threshold.

For use in the NuMI beam, the most important effect of beam energies over 1 GeV is on the topology of single ’s produced in the detector. At energies above 1 GeV the opening angle of the ’s produced by a is significantly smaller than the Cherenkov angle of . Further, the conversion distance of the ’s is comparable to the detector vertex resolution ( 10 cm). These two effects combine to make it difficult to distinguish electron neutrino interactions at 2 GeV from ’s created via neutral-current interactions. As shown in Figure 17 the neutral-current component of the single-ring -like sample of a Super–Kamiokande-like detector placed off-axis in the NuMI beam is dominated by events with a single energetic .
The combination of these effects suggest that the best strategy for using a water Cherenkov detector as part of a long-baseline program is to lower the neutrino beam energy to less than one GeV. For example, the beam energy of the K2K experiment peaks at roughly 0.7 GeV, and a similar beam energy is planned for the JHF-SK project. In the case of the NuMI beam, the neutrino beam energy is fixed at roughly 2 GeV. Thus the main issue for the possible use of a water Cherenkov detector in a NuMI off-axis experiment is the quality of the separation between a possible electron neutrino signal and neutral-current backgrounds at neutrino energies of 2 GeV.
For this report, the selection efficiency of a Super-Kamiokande-like detector has been estimated assuming neutrino fluxes at a location 14 mrad off the NuMI beam axis at a distance of 735 km. The analysis combines several event variables:
-
•
Single ring:
The selection of single ring events retains roughly 40% of the¡CR¿ potential electron neutrino signal at 2 GeV while reducing the number¡C+ of neutral current interactions by 85%.
-
•
Number of decay electrons: For electron neutrino QE events this number should be exactly zero, and tends to be one or larger for muon neutrino interactions and neutral-current interactions which produce sub-threshold pions.
-
•
Ratio of charge in ring to total event charge In the case of , there is a tendency for the fitted Cherenkov ring to have a great deal of light located outside the fitted cone.
-
•
Cherenkov angle Single ring fits to events tend to fit with slightly larger Cherenkov angles resulting from the separation of the two ’s.
-
•
Muon particle ID likelihood Removes un-oscillated muon-neutrino interactions
-
•
Shower particle ID likelihood The likelihood fit of a single electron shower to a decay tends to produce less likely fits than it does when fitting true electron neutrino interactions
-
•
Angle to beam direction Neutral current production has a strong coherent component which is highly correlated with the neutrino beam direction. Hence, one does better to select events slightly off the neutrino beam axis.
In addition to these event variables, there are several variables which result from a fit to the events assuming a is present:
-
•
Likelihood of fit Tends to be larger for true events than for electron-neutrino events.
-
•
Ratio of dimmer ring to brighter ring True events tend to have roughly equally bright rings. Electron neutrino events fitted as tend to have dimmer second rings.
-
•
Invariant mass of fitted rings should yield something close to the mass for true events.
Samples of distributions of these event variables are shown in Figures 18, 19, and 20.


Using these variables, a combined electron-neutrino, neutral-current, and muon-neutrino likelihood is calculated for each event. The final distributions of the final log likelihood distributions are shown in Figure 21. The final signal sample contains events which are significantly more likely to be electron neutrino signal events than muon-neutrino backgrounds or neutral-current backgrounds are selected.


This selection retains roughly 20-50% of the electron neutrino signal, while rejecting roughly 19 out of every 20 neutral-current background events. After event selection, muon-neutrino backgrounds are extremely small. The final fractions of signal and background events selected by this analysis are shown in Figure 22. The figure also shows an example of the neutrino spectrum that results from this analysis for the case of and eV2.
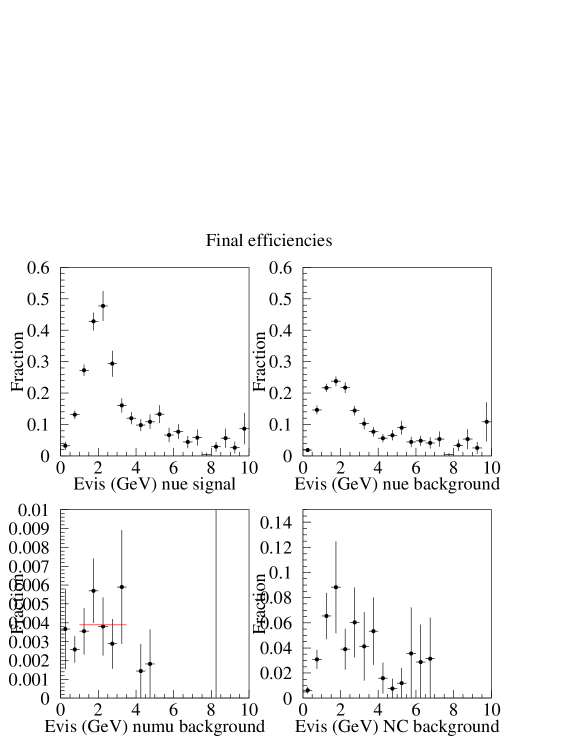

While the signal extraction for events in the energy range of 2 GeV could be improved with more study, this analysis demonstrates the challenges of operating a large water Cherenkov detector at energies of 2 GeV. Continued research into optimizations of the water Cherenkov technology for higher energy events may also lead to improvements. For example, faster photo-detectors, or complete PMT waveform readout may help resolve the difference in the conversion points for the two ’s produced in a decay helping to reduce this background.
6.4 Water RICH Detectors
The use of a water RICH detector for neutrino physics was first proposed by Tom Ypsilantis and collaborators in 1999[50]. The AquaRICH (or AQUA-RICH) experiment as proposed was a 125 m diameter, spherical detector containing 1 Mt of water. The detector was to be sited outdoors in a natural pit under a 50 m water shield. Spherical reflecting mirrors were to focus the Cherenkov light which was detected using hybrid photodiodes. AquaRICH was described by Ypsilantis as “a Super-Kamiokande with spectacles.”
By using the RICH technique, particle velocities can be deduced from the ring radius while the ring center determines track direction with and 6 mrad. Track reconstruction is possible using the time-evolution of photon detection coordinates which will require time resolution on the order of 1 ns[51]. The track length is proportional to the number of detected photons. The new aspect of AquaRICH is the ability to measure particle momentum using the measured change in the Cherenkov angle from particle trajectory deflections due to multiple scattering[52]. A GEANT simulation was used to examine several algorithms for performing this measurement and, for pathlengths of 4 m, momentum resolutions of 11% (4 GeV/) to 21% (24 GeV/) were found for muons[53]. Longer tracks were found to have improved accuracy, up to 4% resolution for 18 GeV/ muons.
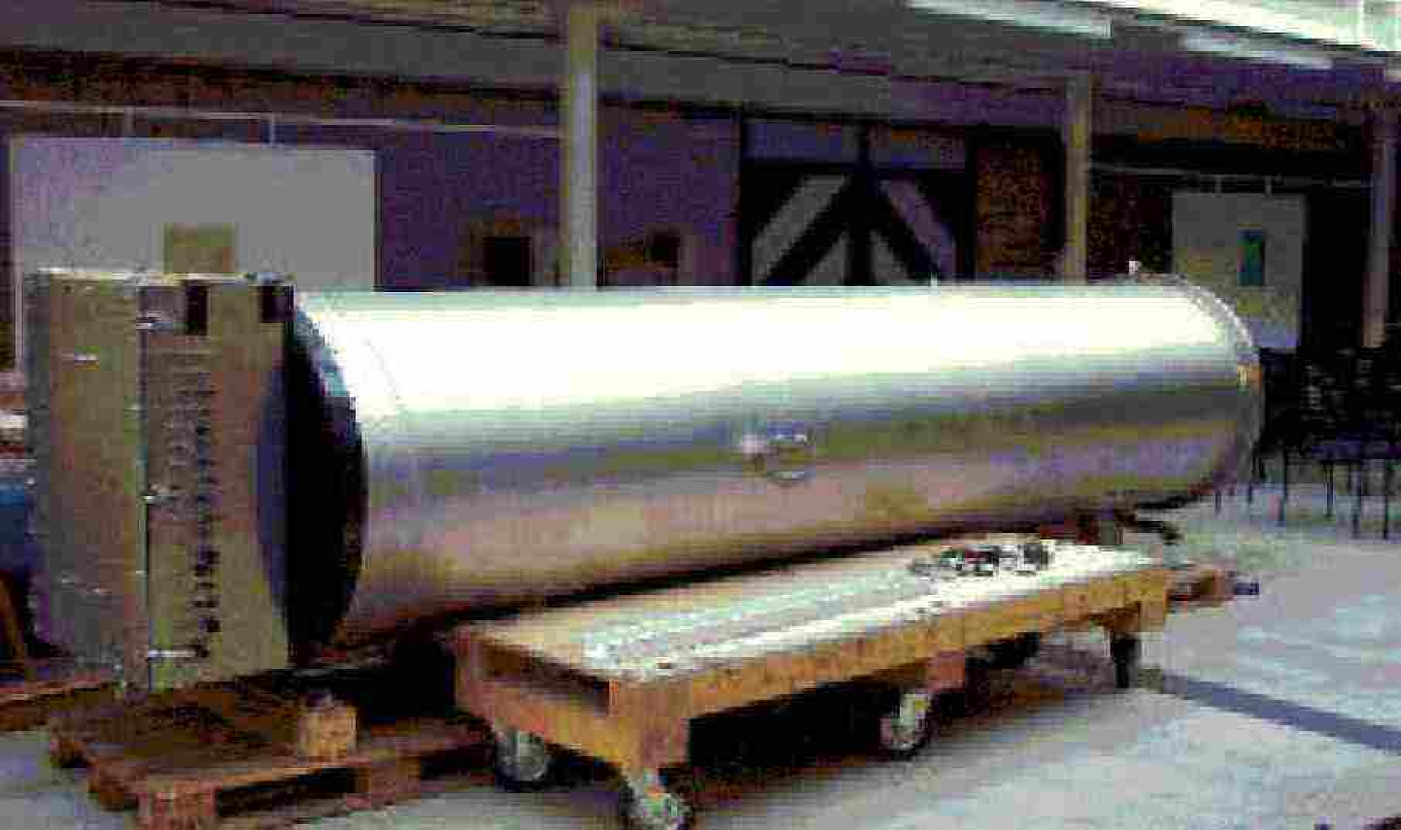
The spherical geometry of the AquaRICH proposal allows for the detection of atmospheric neutrinos as well as supernova detection and proton decay measurements. The original AquaRICH was designed to go in Gran Sasso as a detector for a long-baseline neutrino experiment. The water was housed in a a large rectangular box with the curved mirror at one end. A prototype AquaRICH detector with 3 tonnes of water was built at CERN and is shown in Figure 23.
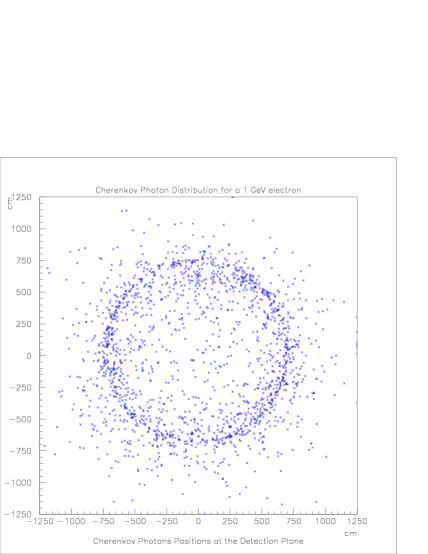
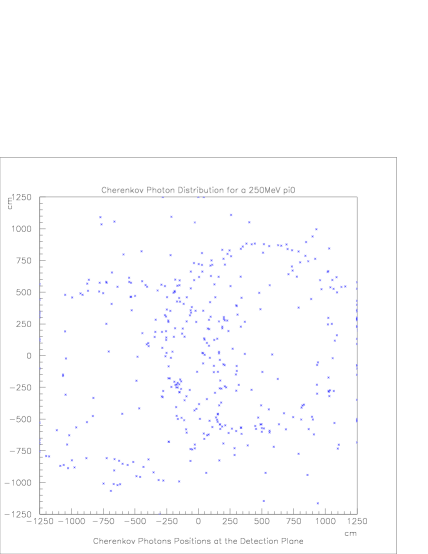
It is this geometry which seems more relevant for the NuMI off-axis detector. Just as a first look at the use of such a detector for NuMI off-axis, the geometry as shown in Fig. 24 was used in a GEANT simulation[54]. No effort was made at this initial stage to
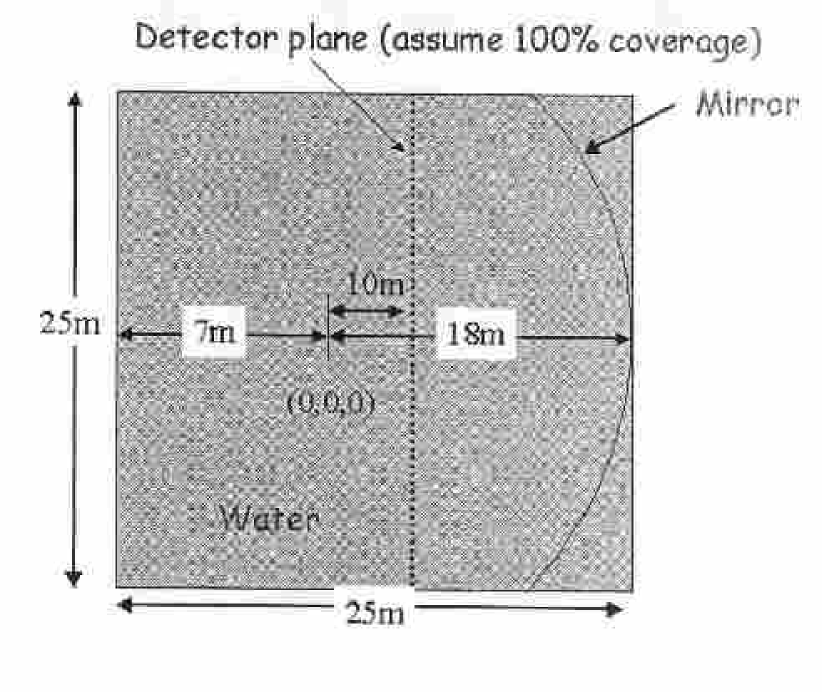
simulate a realistic photodetection system. Of particular interest was how slow ’s looked in the detector. To this end NUANCE was run to obtain the momentum distribution of ’s produced in neutrino interactions. Some results are shown in Figure 6. The distribution of Cherenkov photons from electrons and muons was also studied.
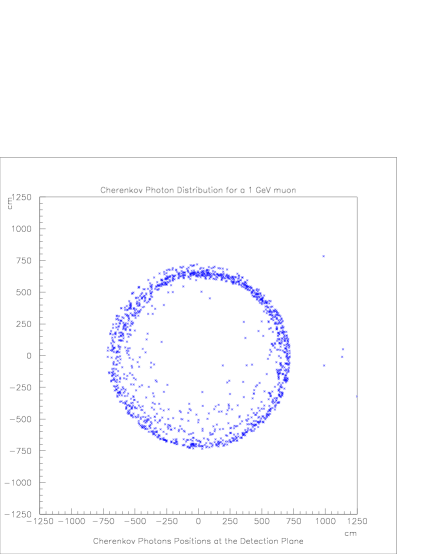
The simulation was performed using single particles introduced along the central axis of the detector. The resultant rings for a 1 GeV/ muon and electron as well as a 500 MeV/ and a 250 MeV/ are shown in Figures 26, 26, 28, and 28, respectively.

6.5 R & D Issues for RICH detectors
The key issue for AquaRICH R & D at the present is manpower. A first step would clearly be to take the prototype and put it in a beam somewhere to test the viability of the geometry and, in particular, the momentum reconstruction techniques. One could also test various hybrid photodiode designs. It is far too early to provide any kind of realistic cost estimate or schedule.
7 Sampling Detectors
Sampling detectors have long been used in neutrino experiments to economically build detectors which nevertheless have adequate event information to identify a neutrino interaction and calorimetrically measure the the total energy left by the neutrino. To use a sampling detector for a appearance measurement, one takes advantage of the fact that the radiation length of materials is usually a factor of 3 to 10 smaller than the interaction length, and therefore the final state electron produces a very sharp burst of energy very close the event vertex. A typical analysis using a fine-grained calorimeter can be found in [20], but the most important features are cuts on the longitudinal energy profile of the event, and the ratio between the electromagnetic energy and the total visible energy of the event. Because the segmentation assumed is so good, the energy resolution of the proposed detectors is in fact slightly better than the width of the peak of the off-axis beam itself, and ensures that the gains realized in principle by going off axis can be achieved in practice. In the following two sections we discuss absorber issues and readout options separately, for the most part. However, it is clear that ultimately there will be some amount of coupling between the choice one makes in each category.
7.1 Absorber Issues
Various active detector technologies have been proposed for fine grain calorimeter options for phase 1 (i.e. 20 kton) detectors. A number of these ideas appear feasible for meeting the required background rejection and energy resolution but with varying degrees of affordability.
The 5.4 kton MINOS Far Detector, which is over two-thirds complete (October 2002), is the largest sampling calorimeter even built and provides an interesting model for understanding fine-grained absorbers and detector fabrication issues. The design of a new fine-grained detector starts with a MINOS-like device. We increase the number of samples by roughly a factor of four, while simultaneously reducing the readout pitch by a factor of two and we increase the mass by roughly a factor of four. While the cost of active detector elements and their readout systems is a significant issue, the increased sampling required for these detectors also places severe requirements on the absorber’s material costs, structural design, fabrication, and element installation.
The steel absorbers in MINOS are also the structural elements used for support of the active detector technology. Roughly 35% of the far detector’s budget was evenly divided between installation manpower and absorber materials. MINOS was able to purchase low cost absorbers by approaching the steel industry and accepting rejected grades of mass-produced steel (e.g. steel too brittle to be used for stamping auto body panels) and by using low-tolerance industrial processes (the edges of the plates are raw submerged arc plasma cuts) to achieve significant savings. Due to adoption of standard high-volume industrial processes, the cost of the iron plates is dominated by the bulk cost of the materials.
About a third of the labor costs for MINOS installation are associated with it being deep underground and magnetized. Neither of these is a requirement for a new NuMI off-axis detector The remaining labor costs are roughly split between:
-
•
Installation and cabling of the detector components
-
•
Receiving, staging detector components, and rigging
An off-axis fine-grained calorimeter will have many more active detector, components and absorber layers (as much as a factor of twenty more for some options) but only a factor of four more mass. To achieve an affordable detector careful attention needs to be paid to materials costs. However, an even greater level of vigilance needs to be applied to the fabrication methods and integration to avoid having the absorber and the detector installation dominate the detector’s cost.
The lessons from extrapolating MINOS include:
-
•
Try to use mass-produced standard commercial materials,
-
•
Try to use standard automated fabrication processes developed for bulk industrial applications,
-
•
Any operation done many time is expensive so efficiency, creativity in design, and industrial automation are crucial for a cost effective detector construction.
As mentioned in the introduction to this section, physics considerations influence the choice for preferred absorber materials. Low-Z materials allow more mass for the same sampling pitch and hence decrease the amount of instrumentation in the detector at constant mass. This drives one to consider them the front-runners for a sampling design. On the other hand the relatively low cost, availability, and structural properties of steel make it attractive to keep as a considered option.
Issues and status of four broad classes of absorber materials will be outlined in this section:
-
•
Iron
-
•
Low Z solids
-
•
Low Z granular media
-
•
Low Z liquids
The first two have the advantage of combining the function of absorber with structural support. The granular media could either be loose and held in a container or molded into a solid. Finally, a liquid, such as water would need vessels to contain the liquid and those vessels could also be part of the detector’s structural integration.
Iron The availability and structural properties of steel make it attractive. A reasonable sampling depth in a steel detector would be 0.5 cm. It would be fairly straightforward to design a calorimeter using large, thin, suspended steel planes that also support the active detector elements. The steel plates would be rolled, plasma cut, and plasma punched to the required shapes. Detector elements would be tacked to the sheets with welds, and the assembly hung from support trusses over the detector. Since this detector would not be magnetized, the steel does not require a laminated design as was done for MINOS. Hence, the welding and rigging processes would be significantly more efficient than those used in MINOS.
A fine-grained steel detector would be a fairly straightforward extrapolation from MINOS and the design is not particularly aggressive structurally. The bulk cost of iron is higher than some of the low Z materials mentioned later but has the advantage of being well understood structurally.
Since it is well understood how to develop a detailed design for a steel calorimeter and it is not favored based on its implications for active detector costs, no significant resources should be expended to further an iron-based design unless comparably cost effective structural solutions cannot be practically achieved in the low Z options.
Low Z Solids and Granular Media
Low-cost low-Z materials include recycled plastic, pulp products, and agricultural products[55]. They could either be solids like molded plastics, materials mixed with a curing agent like particleboard, or loose materials in plastic containers. This is an area that requires further investigation on a number of fronts.
Custom molded plastics have been investigated and while feasible appears to not be cost effective [56]. The raw materials appear to be cost effective but a packaging concept remains to be developed. Recycled plastics have also been investigated. One major concern is availability and uniformity of the materials in sufficient quantities [57]. Finally, use of agricultural materials such corn byproducts (used in many packing materials) is cost effective but has a number of issues [57].
Any of these substances could also be blown as loose material into a vessel. The technical issues faced by this option are similar to those described in the following section on liquid containers.
Many of the granular materials could also be glued into a structural solid. To be pursued, any forming process would require identification of industrial scale facilities and, possibly, an R&D program with an industrial partner to be economical. One of the most interesting existing products is particleboard. A common construction material in the US, it is low cost, and can be formed into a variety of planar geometries. As mentioned elsewhere in this document, the properties of particleboard would allow one to make it the structural element in the detector.
R&D related to integration based on a particleboard absorber would be required and should be pursued.
Water
Water is inexpensive and has both reasonable Z and low density. A feasible design has been proposed using extruded PVC containers with a matrix of internal walls and end seals to contain the liquid. These vessels would be shipped empty, installed, and filled in situ. This has the attractive feature that the components are light while being rigged and assembled. Work related to this type of container was carried out in the design phase of one of the proposed MINOS active detector technologies [58]. The end seal technology was developed using standard PVC sealing materials and an injection molded cap. The costs of the extrusions and caps are not prohibitive and the estimated labor costs appear to be reasonable [60]. This is an area worth continued investigation related to technical production and design features for ease in integration and fabrication.
7.2 R&D on absorber issues
An overarching theme for any fine-grained calorimeter design is reducing the costs in materials, fabrication, and installation labor. To produce a very massive but fine grained detector will require that absorber fabrication, detector integration, and installation concepts be given significant attention early in the conceptual design process. Issues include a detector integration design with specific active detectors, route for extrapolation to industrial scale production, integration with a structural design, and effective concepts for reduction of the detector installation labor requirements.
Specific recommendations:
-
•
A very modest conceptual design program based on steel absorbers could achieve a feasible design at relatively modest effort and well understood costing. Such a costing could be made using the vendors currently making MINOS components. It’s main purpose, however, would be as a cost benchmark for competing technologies.
-
•
There should be further investigation into an integrated particleboard design with additional detector technologies as well as cost effective detector integration/assembly schemes.
-
•
There should be further investigation of granular media in search of alternative solutions to particleboard with increased flexibility and cost effective containers for loose media.
-
•
Continued R&D for water based absorbers should be pursued working towards an integrated design and proven fabrication.
-
•
A final area for further attention is integration of these detector concepts with the experimental facility’s conceptual design and integration, and outfitting.
7.3 Solid Scintillator Detectors
Solid scintillator technology has a long and successful tradition in particle physics experiments, including several projects at FNAL. These traditions involve past and current local R&D and construction efforts, ranging from MINOS, through CDF and D0 to CMS, as well as designs of the neutrino oscillation project P860 and the STAR experiment. All those projects triggered a lot of R&D activity on the production of high quality a lower cost extruded scintillator at Fermilab. The detector element consists of a solid material with scintillating properties, a WLS fiber, a light guide and signal amplifier. A traversing charged particle loses energy in the scintillator, a part of it characterized by the quantity called scintillation efficiency, 3%, is deposited in form of light. Part of this light, defined by the fiber capture efficiency 5%, is transported through the light guide and amplified by a quantity being a product of the Quantum Efficiency and the gain, the latter being typically of the order of 5 for solid-state detectors and upwards of for PMTs. The Quantum Efficiency of typical photomultipliers, used e.g. in MINOS, is of the order of 13%.
7.4 R&D Issues for Solid Scintillator Detectors
A complete in-house facility at Fermilab includes a Scintillator Detector Development Laboratory, a Thin-Film facility, CNC routing and machine development. The production of extruded scintillator may today proceed at a rate four times higher than that for MINOS. Better quality and some cost reduction over MINOS are also expected, with costs falling possibly below $5 per kg.
Other, perhaps more challenging, R&D issues involve the fiber and photodetector. Readout optimization is a major component that largely defines the overall cost of the detector. Given a 5 times higher longitudinal and 2 times higher transverse segmentation than for the MINOS far detector, as well as a 4 times greater detector mass, a linear extrapolation of the corresponding MINOS costs would lead to unacceptably large numbers. Essential cost reduction can be obtained by applying currently available new technologies which have appeared since the time of the MINOS far detector design. Once physics simulations have specified fiducial volume, cell size, and sampling fraction, optimization of a scintillator based detector is almost entirely driven by the photo-electron yield of the basic cell to minimum ionizing particles. A signal sufficient to do efficient tracking is normally the sole criterion. Optimization of the cell geometry, wavelength shifting (WLS) fiber, coupling of the scintillator to the WLS fiber, and the selection of an appropriate photodetector will determine the photo-electron yield and the final detector cost. Since the cost of the WLS fiber goes like the cross-sectional area of the fiber as does the photodetector cost, reducing the readout fiber diameter has a tremendous impact on the detector cost. Replacing the standard MINOS PMT readout by a VLPC based one lead to an increase of the Quantum Efficiency from 13% to 80-85%. This should enable a reduction of the original MINOS fiber diameter of 1.2 mm to 0.4 mm while keeping a similar overall detector performance. We have studied the yield from cosmic-ray muons traversing MINOS scintillator extrusions that are readout with conventional WLS fiber of varying diameters coupled to Visible Light Photon Counters (VLPCs). Preliminary data for 1.0 and 0.5 mm fiber is shown in figures 29 and 30. At this point we see that the photo-electron yield using 0.5 mm fiber and VLPCs is higher than the nominal yield in MINOS (which uses 1.2 mm WLS fiber).
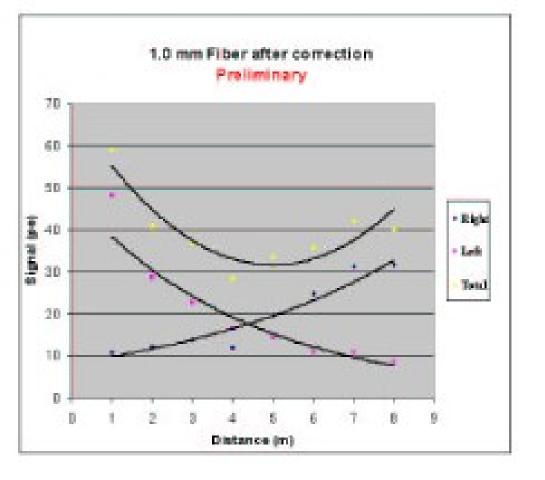
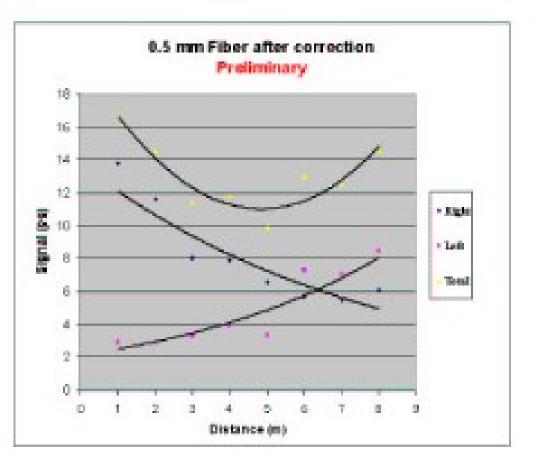
Although at present relevant data exist only for the MINOS 4 cm wide extrusions, it is expected that going to a 2 cm extrusion, as proposed for NuMI Off-axis, may only somewhat improve the results. This opens the possibility of an at least ten-fold cost reduction compared to the numbers obtained from naive MINOS-based extrapolations. Additional tests with different extrusions and the latest VLPC type are due to become available shortly. On the other hand, 0.4 mm is believed to be near to the critical fiber diameter below which attenuation effects become unacceptably large and this marks the borderline of a possible cost reduction by going to thinner fiber.
The same data from the MINOS extrusion studies indicate a light attenuation length along the fiber of 5 meters for a single ended readout. Accordingly, double sided readout was chosen for MINOS to ensure a secure light yield at all positions. The price is a two-fold increase in the number of readout channels. In a larger detector (a detector 12 meters across is considered in the steel-scintillator design), the issue is yet more important. It has been proposed to overcome this problem by applying the technique of mirroring of the far end light. Tests of the D0 fiber tracker indicate that an effective attenuation length of as much as 16 meters is obtained with a single ended readout and far end mirroring. This renders a single ended readout completely sufficient for a 12 meters large detector. With all the above modifications, the obtained light yield can be expected to be equal to or larger than that of the MINOS detector at any position. New measurements are planned with both 4 cm and 2 cm wide extrusions and with 1.2, 1.0 and 0.5 mm WLS fibers, both double ended and single ended with a mirror at the far end.
A ten-fold cost reduction of the fiber is followed by a similar cost reduction of the photodetector. A 510 element array with a 0.4 mm fiber would cost the same or less than a 24 element array with a 1 mm fiber used at D0 (about $240). Although a 10 times higher density requires cold end electronics, this technology has been successfully applied in the past by Boeing. R&D work on the next generation VLPCs is currently under way in the Lawrence Semiconductor Research Laboratory (LSRL), which has collaborated with Boeing, has been previously awarded a phase I R&D grant and recently a new phase II grant for this purpose. Their research aims at producing high density VLPC arrays and demonstrating an order of magnitude cost reduction compared to D0.
From all the presently known input, the total cost of a 20 kton steel-scintillator detector has been recently estimated to about $100 M. The ongoing extensive R&D activity in the field can be expected to reduce this number.
7.5 Liquid Scintillator
Introduction Liquid scintillator is a proven technology that has been used in large quantities in detectors over long periods of time. It gives good energy resolution and charged particle tracking efficiency. Clearly liquid scintillator has properties similar to those of solid scintillator. Its primary advantage is its low cost for a given photon yield. Liquid scintillator allows for a flexible geometry and segmentation. Because it is a liquid, it can be added to the detector after it is assembled to minimize assembly cost. It can even be removed if repair is necessary or if the detector needs to be disassembled and moved. Modern off-the-shelf photonics can be used to readout the detector so that additional electronics is minimal. Scintillator segmented into cells and read out with wavelength shifting fiber gives both pulse height and position information. In addition scintillator has a fast response and a negligible dead time. Since this type of detector was investigated as a candidate for MINOS [58] very little additional R&D and engineering is required to construct a very large detector from this technology.
Structure As a specific example, we present in Figures 31 and 32 a conceptual design based on a mineral oil based liquid scintillator interspersed between planes of absorber. Water based liquid scintillators do exist and would be less expensive with a higher light yield. However, they are more reactive than mineral oil based scintillator and would require further study to determine their long-term effects on the fiber. The liquid scintillator would be contained in modules consisting of long cells of extruded PVC plastic colored by titanium dioxide for good reflection. Light that signals a charged particle s passage through the scintillator is captured by a wavelength shifting fiber running the length of each cell. Although this is a conceptual design, its structure has been investigated previously and those investigations documented in two masters theses/citebib:masters. The design we consider here is based on modules with the dimensions of each cell 3.3 cm x 3.3 cm x 12 m long. The outer walls are 1 mm thick while the inner webbing of the extrusion is 0.5 mm thick. Although the cell sizes are chosen here for ease of calculation and would be optimized by Monte Carlo studies of neutrino events together with structural studies of the plastic, they are close to those required for a final detector and are structurally sound. For each module, the cells are sealed at one end by a single plug of PVC glued in place. This construction has been tested to be reliable with no leaks to a pressure of over 6.5 atmospheres. Alternate planes of scintillator modules would have perpendicular cells to give an X Y readout.
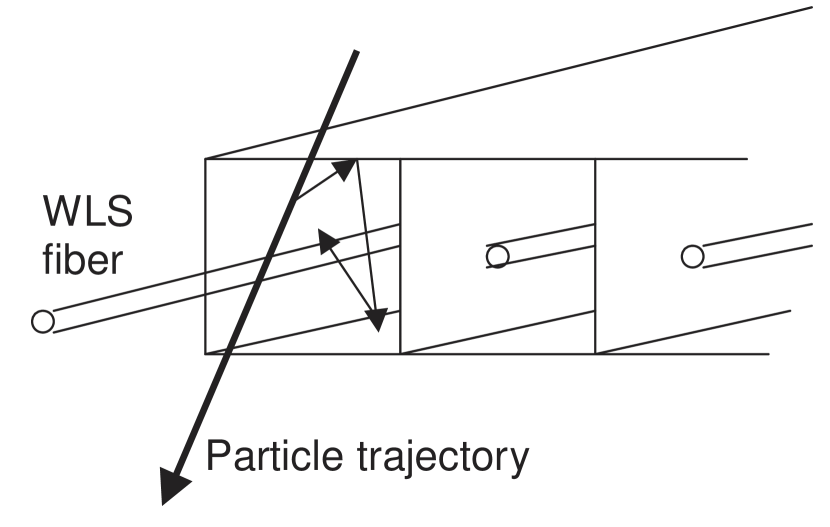
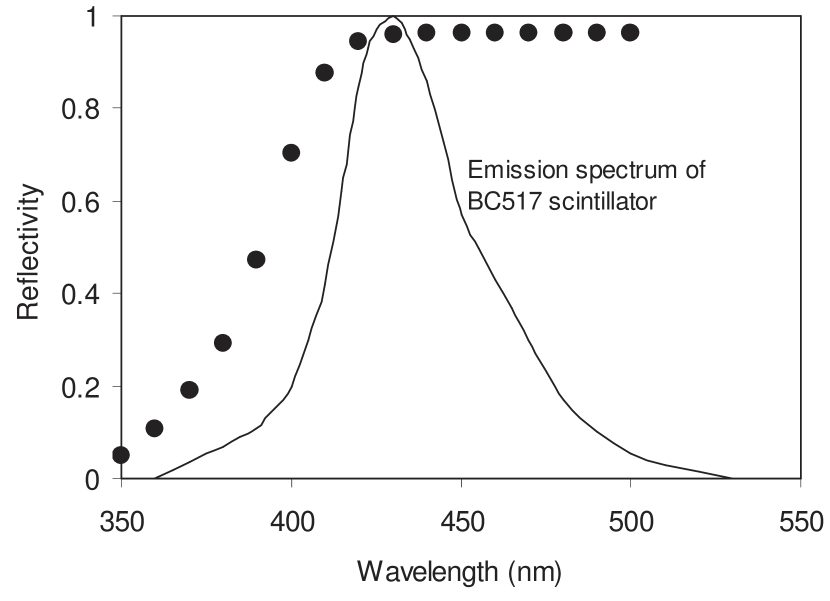
Signal
Light could be collected using a 1 mm diameter wavelength shifting fiber similar to that used in MINOS. The light output of each cell depends on the concentration of fluors, the thickness of the cell, the width of the cell, the diameter of the fiber, and the length of the fiber. Previous studies have shown that the amount of light collected by the fiber is not sensitive to the position of the fiber in the cell. The end of the fiber will dipped in white paint and then in epoxy to provide 30% reflectivity at the end. Tests have shown a minimum ionizing particle this geometry with BC517L scintillator will give 40 photons from the end of a 12.5 m fiber. The fibers from module would be gathered in a manifold to an optical connector similar in design to that of MINOS. The design of the PVC manifold would also include fittings to fill and, if necessary empty the cells of scintillator. Chemical activity tests show there is no measurable effect of BC517L scintillator on either the fiber or the PVC extrusion over the lifetime of the experiment. In Figure 33 we show the emission spectrum of BC517 scintillator, and in Figure 34 is the measured pulse height spectrum from a test of a 7.5 m long extrusion.

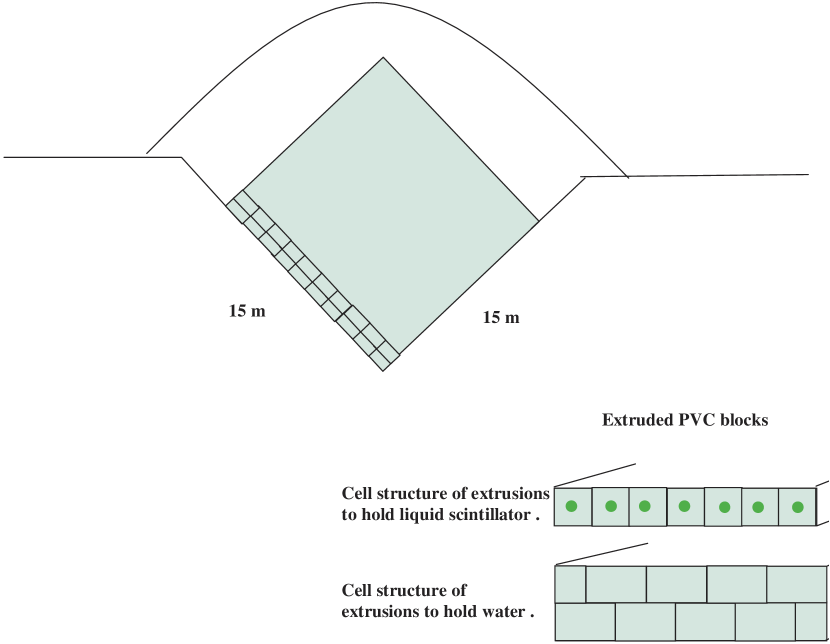
Support The construction of the detector is simplified because the light plastic extrusions would be stacked to form the detector before the liquid was added. Mounting the plastic extrusions with alternating planes at to the horizontal and to the vertical would allow the detector to be read out and filled from the top. A possible mounting structure would be a V shaped trench. The sloping walls could be supported by earth in a manner similar to culvert wall construction. The longitudinal direction the trench would be sloped at about for ease of construction and to allow drainage for water seepage from the ground. The stacked extrusions would be supported primarily by the sides of the trench and at the ends of the trench by a bookend structure. Most of the weight of the detector is supported by compression on the floor of the trench carried by the entire length of the extrusion. In this configuration, all mechanical stresses are well below the tested strength of the extruded structure. We envision that the detector would be covered with a roof, possibly of Quonset hut design, which would then be covered by about 3 meters of earth. This would ensure a stable operating temperature for the detector and eliminate the soft component of the cosmic ray flux. Readout Image intensifiers provide a low cost readout well matched to the rates of cosmic rays through the detector. Reading out fibers into a standard 25 mm image intensifier will require one image intensifier for every plane of the detector. Standard image intensifiers have a quantum efficiency of better than 10% in the green and a gain of at least 105. An image intensifier would be read out by a video camera. The CCD in a modern off-the-shelf video camera can be gated to have an exposure of as little as 10 microseconds and can be read out at 30 Hz. For an exposure gate of 20 microseconds for a detector on the surface, the occupancy rate of a single cell would then be about 1%. The 360 cells of each plane of the detector could be read out by a standard single image intensifier and video camera. Standard firewire readout would go into processor for each camera, the processors would be sparcified and read into a PC. If necessary, several PCs would alternate spills to assure adequate readout time. Cost Estimate Now we estimate the costs of constructing the detector described above. These costs are based on quotes and engineering estimates of the liquid scintillation detector proposed for MINOS and detailed in Reference [58] and in the two engineering theses referred to above.
| Mineral oil: | $2.75/gallon |
|---|---|
| Fluors: | $2.09/gallon scintillator |
| PVC extrusions | $1.5/lb |
| Image intensifier 25 mm diameter | $2k each |
| Video cameras and optics for each image intensifier | $1k |
| Wavelength shifting fiber 1mm diameter | $1.5/m |
With the type of construction outlined above, we estimate that a 20 kton liquid scintillator detector using water as absorber planes could be built for less than $50M. Additional cost saving might be achieved by using a water solvent instead of mineral oil and using higher photon yield fluors so that the fiber could have a smaller diameter.
7.6 R&D Issues for Liquid Scintillator
Here one can make use of the extensive R& D that was already done for the MINOS experiment, but one oustanding issue would be the different requirements due to a more fine-grained transverse segmentation. Presumably the change of absorber material from a solid (steel) to a liquid (water) would make construction issues less complicated, since one could fill the absorber and readout extrusions simultaneously. Certainly a test would be required to ensure that the extrusions used would not leak, where the extrusions must be the full size expected to be encountered in the experiment.
7.7 Streamer Tubes and Particle Board
7.7.1 Costs
In any detector this large, the absorber must be inexpensive. An absorber with sufficient strength to support its own (and active) weight without additional structure will be the most cost effective. Particleboard laminated into blocks with slots for detectors is an attractive absorber candidate that may satisfy all of these requirements. In particular, particleboard price in large quantities is less than $0.13/lb.
Minimizing the cost of the active elements and associated electronics is the major challenge. The per channel costs of the electronics (circuitry, cables, connectors, readout cards, crates, power supplies, assembly labor and testing) will be a major cost driver. A detector technology capable of readout in strips about 3 cm wide and 10m long requires approximately 5 electronics channels. If shorter strip lengths must be used, the costs will increase dramatically. For example, if readout strips can be 10m long in x, but due to mechanical constraints only 2m long in the y, the cost multiplier is 5! A geometrical factor such as this will likely dominate the final electronics cost. A technology that requires amplifiers causing a fractional increase in the cost pales in comparison with a doubling of the number of channels. Thus cost considerations will likely push the detector solution in the direction of the longest possible (10 m) readout strips in both dimensions.
7.7.2 Readout Geometry
The required strip length can be obtained using full-length detectors, or by using interconnects to pass signals (and perhaps gas) between shorter detectors. Interconnects will be difficult to engineer, and for a single detector package performing x and y readout over a restricted area, interconnects are required in two dimensions. To illustrate, a detector package with dimensions 2 m 5 m, achieves n strips, 10 m long, over a 10m 10m plane using 10n electrical interconnects. Mass electrical termination may help reduce the cost of these interconnects, but the costs of signal concentration and fan out must then be included.
In some technologies, no additional costs are incurred in constructing separate detector packages for x and y readouts. This allows the sampling frequency to be increased by up to factor of 2, over detectors that feature two-dimensional readout. Increased sampling should improve the interaction energy and vertex z resolutions.
Based on these observations, to achieve the lowest cost we suggest that the following guidelines be used in choosing a detector technology.
-
1.
To minimize the number of interconnects, single detector packages should be constructed with the longest possible (e.g., 10 m) readout strips.
-
2.
To retain absorber modularity, simplify assembly and maintenance, minimize the number of readout channels, and optimize resolutions, detector packages should readout only a single dimension.
7.7.3 Drift Tube Properties
Drift tubes are a good choice for high quality tracking over large areas, though often at a high cost. In a long-baseline fast-spill neutrino experiment, however, the low (cosmic) rate environment and crude position resolution requirements, allow a relaxation of most constraints that make drift tube construction difficult and costly.
For example, the electric field configuration and operating gas need not result in a fast saturated drift velocity with a linear time-to-distance relationship, nor is a mechanical construction with high position accuracy and precision over long distances necessary. Because the resolution goals of the neutrino experiment are in mm, it is acceptable to have imprecise location of the anode wires in the tubes and the tubes with respect to each other.
Banks of 8 to 16 tubes, 10m long can be produced using an inexpensive thin walled plastic extrusion, stiff enough to be inserted into the absorber. A top notch extruding company has given us a quote for the 8-tube extrusion, 20 cm wide, of $1.25/linear ft. This converts to a raw materials cost of about $20/sq. meter of active detector. Other detector technologies have materials costs 5 - 10 times larger. Wire supports will be needed over the 10m length of tube. The supports with a slight tension on the tube wall, (or perhaps clearance), are attached to the anode wire at three (or more) spots along a tube and pulled through the tube during the wiring. Tubes of nearly any shape are acceptable and many gases can be considered.
Drift tubes can be run in either the proportional or limited streamer mode. In the latter, signals are large enough that amplifiers are unnecessary. The low rates, however, imply that the proportional mode could use a low cost, large integration time (slow), and a high signal to noise ratio amplifier. The proportional mode makes analog information (pulse height or width) available that might allow crude track counting for improved calorimetry or background rejection. With the amplifiers described above, signal detection over 10m should not be difficult.
7.7.4 Integration of Absorber and Drift Tube Extrusions
Creating a homogeneous interleaving of absorber and active elements is a common problem in calorimeter construction. The ATLAS Tilecal hadron calorimeter is constructed with alternating detector (scintillating tile) slots and spacer (absorber) strips attached on either side of a central absorber plate, with spacers offset so that detectors in one layer lie over spacers in the next layer. Thus in two closely spaced layers one has 100% coverage of the area. A 2.4 m 9.6 m absorber module having six long slots in which to insert detectors can be constructed in a similar way, as illustrated in Figure 35.
A more uniform coverage is obtained with a thin central plate, thick end plates, and a spacer matching the extrusion thickness (here 2.5 cm), as shown in Figure 36
A 9.6 m 9.6 m plane is formed using four modules (horizontal wires) stacked vertically edge to edge. A second plane of four modules, turned 90 degrees (vertical wires), is glued (e.g., with dowels) to the first plane, thus forming an X-Y pair, 28 cm thick, as shown in Figure 37. The pair is supported on the bottom with vertical wires readout from below. Joining 30 of these pairs face to face creates a stable platform, 8.4 m long, on which to stack the upper quadrant. Assuming sufficient space is available, a drift tube extrusion can be removed and replaced at any time during the assembly.
7.8 R&D Issues for Streamer Tubes
A multi-tube extrusion of carbon loaded plastic (high resistivity) looks like a viable method to produce a constant cathode potential that will not support a large spark or short circuit current. We have determined that an extrusion with a 2.5 cm wide cell, and with a wall thickness of about 1 mm (40 - 50 mils) is practical, and due to the broad angular spread of secondary tracks leads to only a small, , track inefficiency. Tubes can take any shape that has a constant wall thickness, such as the examples with a flat exterior wall shown in Figure 38. If limited to an extrusion width of 8 (2.5 cm) cells, two extrusions would be joined to form 16 adjacent drift tube cells.
Choosing the ground and high voltage (HV) elements of the drift tube is a critical step in the design process. Placing the cathode extrusion at negative HV and the wire at ground potential allows electronics to be DC coupled to the anode wire. The extrusion, however, must then be well insulated from any external conductors, like those that provide the desirable signal transmission line properties. With the cathode extrusion at ground potential insulated external conductors are easily attached. The anode wire, however, is at positive HV and a blocking capacitor is required to de-couple the HV from the electronics.
Also, there are configurations where the external conductor is segmented into strips which are readout instead of (or in addition to) the anode wire. Each of these configurations has advantages and disadvantages that must be evaluated before choosing the appropriate one for the neutrino experiment. In the following design sketch we will assume that anode wire is at +HV, with the resistive extrusion and outer continuous conducting surface at (DC) ground potential.
The development of a production extrusion die by a top-notch company will involve a large up front cost, estimated at $50-100k. A pre-production die suitable for R&D studies might be developed for less, but should not be counted on.
Drift tube endcaps must implement the following functions:
-
1.
anode wire location, gas seal, and tension support,
-
2.
tube gas seal, inlet and outlet gas connections and manifolds,
-
3.
HV distribution (far side) and (signal side) capacitor de-coupling,
-
4.
termination, and concentration of the anode signals
Integration of these functions into a reliable, labor and cost saving product is a primary task in drift tube detector design. With 100,000 extrusion ends to cap, one is well into the range in which plastic injection molding becomes cost effective. The endcap region is shown in Figure 39
R&D will be necessary to minimize the cost of the drift tube readout electronics. Signal collection from widely spaced drift tubes can be a source of troublesome cross talk or deadly amplifier oscillations. Maintaining short and well-shielded transmission lines from the anode wire to the amplifier is one way to avoid these problems. Placing a differential output amplifier directly at the wire termination is another solution. Differential outputs allow signals to be safely condensed onto cables and transmitted to the (differential input) discriminators. Also, it may be desirable to convert large limited streamer mode signals to a differential form, before concentrating signals onto multiconductor cables.
The discriminators are traditionally rack mounted, and require a costly cable run of about 400 wires in each quadrant layer. Using extrusion mounted discriminators and address forming circuitry, only words containing the wire address and time (10 MHz experiment clock) of a hit need be taken from a chamber. The words can be buffered and transmitted on a parallel (e.g., 32 lines) bus for about a factor of 10 reduction in cable cost, or in a serial fashion (e.g., ethernet) for about a factor of 100 reduction in cable costs. Hit wire addresses and times would then be collected in memory devices located beside the detector for retrieval by analysis machines.
A 10 MHz clock produces hit time measurements in 100 ns increments that translates, with a slow drift time, into a position resolution of a few mm for electron tracking. Cosmic rates should be just a few Hz per tube, and less than 1 kHz for single 10 m plane, which should allow either the parallel or serial readout schemes discussed above.
7.8.1 R&D Costs
To develop an extruded drift tube technology will take a considerable effort involving 1 full-time or 2 half-time postdocs, an engineer half-time, a senior technician and, and a number of graduate and undergraduate students, costing approximately $250k/year for 1-2 years. Particleboard, extrusion die, wire support, and endcap development will cost $100k, mostly in the extrusion die fabrication. Proportional (with amplifier) and streamer mode tests, will cost another $15k. Michigan State is interested in pursuing this program of R&D.
7.9 Resistive Plate Chambers
Resistive Plate Chambers are an attractive possibility for an active planar part of a massive neutrino detector because of their simplicity and inexpensive components. It may be the least expensive choice per unit area, but still give excellent timing for background rejection and adequate efficiency.
A sketch of a generic Resistive Plate Chamber is shown in Figure 40. Two parallel plates of high resistivity, to cm generate a uniform, intense electric field, about 4kV/mm, in a typically 2 mm wide gas gap. The plates are coated, on the external sides, with thin graphite layers connected to high voltage and ground, respectively. Due to their high surface resistivity of about 100 k, these graphite electrodes are transparent to the transients of electrical discharges generated in the gas. Capacitive signal readout is therefore possible through pads which are insulated from the graphite carrying the high voltage by a layer of mylar.
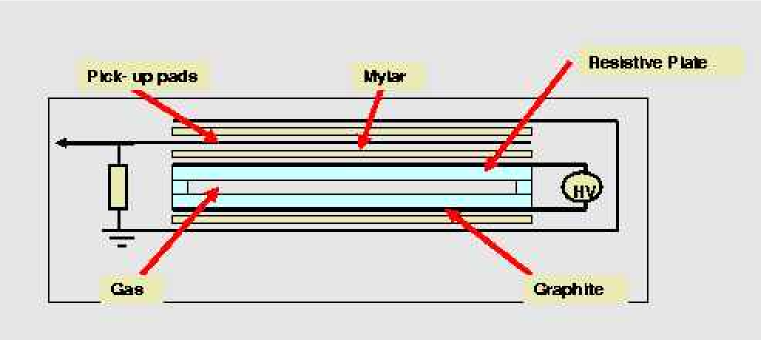
The simplicity of the concept of these chambers allows for a large variety of design choices. Two types of resistive plates have been used for the construction of most chambers: glass and bakelite. The advantage of bakelite is its somewhat faster recharging capability; however the optimal performance requires the application of a coat of linseed oil to the inner surface of the plates - a somewhat delicate operation. Chambers have been built with one single gap, some as wide as 8 mm, or multiple and smaller gaps for better timing resolution at uncompromised signal efficiency. The thickness of the glass plates, typically 2 mm, can be varied; however thinner plates will be distorted by the forces resulting from the high electric field between the plates. The resistivity of the graphite layer can be varied and will affect both the rate performance and the amount of cross-talk between adjacent readout pads. Finally, the chambers can be operated either in the avalanche mode (at a lower high voltage setting) or in streamer mode. The collected charge in the streamer mode is approximately a factor of 50 larger than in the avalanche mode. Different gas mixtures have been explored, some with the ability of efficiently suppressing streamers.
In general, the physics of RPC’s is well understood and Monte Carlo programs exist which simulate the various physics processes occurring when the chambers are traversed by a particle. More details on the current status of research related to RPC’s and of recent applications of RPC’s in HEP can be found in the contributions to last year’s workshop dedicated to these chambers.[61]
RPC’s are slow to recharge: typically recharging times of 1 (streamer mode) and 0.1 ms (avalanche mode) have been observed. The times depend on several factors, such as the resistivity of the graphite layer, the material and the resistivity of the plates and the applied high voltage. Rates are not expected to be an issue for any neutrino detector operated on the surface, but good timing is required in order to reduce cosmic ray backgrounds.
The electronics for an RPC detector used in a neutrino experiment can be simple and inexpensive. The signals produced are large, and require no additional amplification. Instead of making a pulse height measurement, an approach might be to use a simple discriminator as the front end electronics. When a signal is received and the associated discriminator fires, it would record a timestamp, which is essentially the value of a counter clocked continuously at a fixed rate. The timestamp would constitute the data read out, along with a channel number that identifies a physical location. The data would be read into a trigger farm, which would reconstruct the event based using algorithms that use the timestamp and physical location of the hit. Accepted events would be written to disk, while noise hits would be rejected. Counter reset and clock speed are parameters based on trigger processing time, the number of channels, and total data throughput. The algorithm for reconstructing events from timestamps is very similar to that used in MINOS. This approach works well for detector systems with a low event rate and a low spurious noise rate.
7.10 R&D for Resistive Plate Chambers
A research program on resistive plate chambers has already been begun at Argonne to evaluate their potential use for a calorimeter as part of a linear collider detector. We propose to join that effort. With support of about $60,000 in the next fiscal year (2002-2003), we could support gas tests and electronics conceptual design appropriate for use of RPC’s in an off-axis NuMI detector.
The two efforts are described as follows:
I. We will initiate a detailed R&D program to evaluate the merits of RPC’s:
-
1.
We will complete the evaluation of a small number of RPC’s which we obtained from other experiments.
-
2.
We will construct a small number of test chambers with various glass and gas gap thicknesses resistivity of the layers of ink (distributing the high voltage onto the glass) geometries of the readout pads.
-
3.
We will develop a readout system based on a one-level discriminator. This system will be used to evaluate the different chamber designs and pad geometries.
-
4.
We will test these chambers in a cosmic ray test stand and evaluate their: noise characteristics signal strength versus applied high voltage and for different gas mixtures efficiency for the detection of minimum ionizing particles cross talk between adjacent channels long term stability
-
5.
Following the completion of the above tests, we will design and build a small test section of an (electro-magnetic) calorimeter, approximately 25 cm in all three dimensions. This test section will feature of the order of 10,000 readout channels. The electronic readout system will be based on a custom chip. The mechanical set-up will be designed such as to allow for easy implementation of other active media, as they might become available.
-
6.
We will test this calorimeter in particle beams which are available at the major particle physics laboratories, such as DESY and CERN. These tests will be important in verifying the functionality of the chambers and their electronic readout system.
-
7.
Contingent on the successful tests of our small (electro-magnetic) calorimeter, we will design and build a test section of the hadronic calorimeter, sized , which is sufficient to contain hadronic showers both laterally and longitudinally. This calorimeter section will again be subjected to extensive tests in particle beams.
We expect to complete items 1) - 4) in FY 2003, items 5) - 6) in FY 2004 and initiate item 7) in FY 2005.
Engineering and technical effort during FY2003 The following engineering and technical activities are planned for FY2003:
-
1.
Construction of a small number of test chambers with different dimensions (glass and gas gap thicknesses.) This involves the cutting and gluing of glass.
-
2.
Development of a technique to apply layers of resistive ink (graphite) with different, but uniform thicknesses, leading to specific values of the surface resistivity.
-
3.
Design and production of spacers and rims (out of plastic) for the construction of the chambers needed for the assembly of the electro-magnetic size calorimeter.
-
4.
Design and building of a readout system for the test chambers and possibly for the electro-magnetic size calorimeter. The readout scheme will include only the digital information. The large number of channels of both the electromagnetic size calorimeter and the test section of the HCAL prevents the deployment of an analog readout.
II. For Electronics R&D, we propose to use discrete comparators for the front end electronics, and programmable logic for the timestamp counters. We would build a small system using this approach (several hundred channels) to demonstrate the proof of principle. Later, as a second phase, we propose to implement the design of the discriminator and the timestamp counter inside a custom integrated circuit. While the design of custom circuits can be long and difficult, we believe that the circuitry is simple and straight-forward, helping to reduce the risk in development and cost. This development would be ideal for a national laboratory or university with established integrated circuit design groups.
8 Other R&D Issues
8.1 Operation of a Detector at the Surface
It needs to be determined whether cosmic-ray backgrounds to interactions will prohibit placing the detector at or near the earth’s surface. To understand the scale of the issue, we consider a 20kT plastic/RPC detector option, outlined by a box. The cosmic-ray muon rate through the top surface of the detector would be roughly 300,000/sec [62]. Assuming the spill length for single turn extraction at the Main Injector, and the currently foreseen repetition rate of 1.9, the duty factor of the beam will be approximately . In 5 years of data-taking with a 50% running efficiency, the total beam-on live time of the detector will be 400 seconds. In this time, approximately muons will traverse the top surface of the detector. To achieve a cosmic-ray induced background on the scale of the approximately 40 expected intrinsic beam events, we therefore need a rejection factor of approximately .
Although a substantial fraction of cosmic-ray interactions will be easily distinguished from events, such simple cases may only ameliorate the rejection factor by an order or two of magnitude. There are wide range of possible interactions which must be considered for the remaining five for six orders of magnitude. For example, neutrons produced by muons which do not cross an active detector plane could resemble interactions, particularly in a non-proportional detector such as the RPC. Neutrons produced outside the detector, nearly horizontal air showers, muon decay, and effects not yet considered may be important on the scale of the rejection factor we need.
Understanding such effects to this level is most likely beyond the reach of simulations, due to uncertainties on physics processes, efficiencies, and correlations among efficiencies. Experience from previous (underground) experiments with large cosmic-ray rejection requirements provides some guidance. However, we are reluctant to use this experience to make a definitive statement on the feasibility of a surface detector due to several differences. These include the different event energy scale and signatures between an off-axis neutrino detector and many previous experiments (e.g. proton decay), the different detector geometry and technology, and the different characteristics of the cosmic-ray flux between the surface and underground.
A Fermilab project to study potential cosmic-ray backgrounds has been initiated. The LoDen project has borrowed 20 RPC planes () built by Virginia Polytechnic Institute and State University as spares for the Belle experiment’s muon system. Although only a 20T detector will be built with these RPCs (with still less fiducial volume), the vast difference in mass is more than compensated by the ratio of the live duty factors. Within a year of study with a test detector, there should be new insights into the cosmic-ray background issues for a large surface detector.
8.2 Cross-Sections
The measurements of , and in high intensity superbeams at will provide our most precise windows into the neutrino oscillation parameters , , and until the advent of next generation neutrino sources, such as muon-based neutrino factories. Degeneracies and correlations in this multi-dimensional parameter space [30, 31] affecting the extraction of oscillation parameters from these measurements will make it especially important to have multiple high precision measurements at different baselines, energies and neutrino and anti-neutrino beams in order to determine the neutrino mass hierarchy and establish CP violation in neutrino oscillations. The precision of these measurements rests not only on the statistics which can be gathered in proposed experiments, but in our abilities to understand signal and background rates for oscillation processes. These rates, in turn, depend on a detailed knowledge of neutrino interaction cross-sections at the low energies proposed for these experiments. To illustrate the importance of cross-sections in these measurements, let us examine three examples.
The measurement of the muon neutrino disappearance in the region of the peak of the first oscillation maximum is the best method for determining and . The former measurement comes from the depth of the oscillation “dip” at the peak and the latter from the location of the peak in energy at fixed . Realistic detectors either misidentify other particles as final state muons or miss some of the final state particles with some finite probability. (For example, in water Cerenkov detectors, many non-quasielastic interactions are misidentified as quasielastic candidates.) In general, these misreconstructions feed events from higher energies into the “dip”. The background rates can be predicted with detailed knowledge of the detector response, the flux of high energy neutrinos from correctly reconstructed charged-current events, and knowledge of the cross-sections.
is known to be small at the from the CHOOZ non-observation of disappearance. As illustrated in Figure 3, there are significant background from the electron neutrino component of the beam and from neutral-current misidentification, primarily from single production. To understand the former, particularly at low energy, it is important to understand the variation of with energy. The latter of course requires knowledge of the cross-section for the production, and particularly the expected final state energy spectrum.
Finally, comparison of and requires an excellent understanding of the differences in the two beams. A major complication is the difference between the interactions in the beam, which are a tiny fraction of the events from the beam as illustrated in Figure 41. To understand this difference, detailed knowledge of and its variation of energy for the final states of interest will be crucial.
The reconstruction strategies and backgrounds of neutrino experiments in the GeV and – GeV regions are very different. Below GeV, the quasi-elastic cross sections dominate. Some detector technologies favored in this region, e.g., water Cerenkov experiments, can only observe the final state muon and are not sensitive to recoil nucleons. The energy of the events is obtained under the assumption that the reaction was quasi-elastic. Therefore for experiments in the GeV range, background predictions require knowledge of how often inelastic scattering events are misidentified as quasi-elastic events in the detector. In the – GeV region, the inelastic cross section dominates with a significant contribution from quasi-elastic events. In this energy region, the unobserved hadrons are very important. Even detectors which are sensitive to all hadrons, e.g., sampling calorimeters, have a different response to charged and neutral pions as well as mesons and baryons. The energy calibration and the misidentification of NC events as CC events is very sensitive to the fraction and fragmentation function of neutral pions in the final state.
Physics of Low Energy Cross-sections
At present, the neutrino differential cross sections for CC and NC events, and the hadronic final states in the –few GeV region are not well understood. The lack of good data in this region limits the physics capabilities of any future neutrino oscillations experiment. The measurements of interest are total and differential cross sections for charged current and neutral-current interactions with nucleons, hadronic final states in CC and NC interactions with nucleons, nuclear effects in the differential cross sections and hadronic final states, and coherent nuclear processes. In each case, the current data in the has large uncertainties and often inconsistencies among experiments.
Theoretical models exist to characterize these reactions and relate scattering to well-measured processes. These models don’t provide predictions for neutrino scattering cross-sections and final states, but rather lend theoretical guidance to interpreting precise low energy data as it becomes available from measurements such as we describe. Testing these models with precision low energy neutrino cross-sections is crucial for future long-baseline experiments, and is also interesting physics in its own right.
Quasi-elastic Scattering
The physics of quasi-elastic scattering [63] is described in terms of nucleon weak and electromagnetic form factors. Some information on form factors comes from electron-nucleon scattering and some from measurements with neutrinos. On nuclear targets, the effects of Fermi motion must be included. One approach is a Fermi gas model [64] which can take phenomenological parameters from fits to electron scattering data on nuclei and apply them to neutrino data within the framework of the same model. For predictions of far detector cross-sections, this is best done on a target of the same nuclear composition. The current data on quasi-elastic neutrino cross sections [65] are shown in Figure 42. The largest uncertainties for future experiments come in this case from applying this data corrected to be a “free nucleon” cross-section to nuclear targets.
Inelastic Scattering
In general, all inelastic scattering is described in terms of three structure functions , and . In the deep-inelastic region (high ) and at high , the relationship between the structure functions measured in electron and muon scattering and the structure functions in neutrino and antineutrino scattering are given in terms of Parton Distribution Functions (PDFs). In contrast, at low and in the low resonance region, a different picture is often used to describe the data, including vector dominance models, resonance excitation form factors, production of exclusive channels, etc. In the electron scattering case, it has been shown experimentally that there is a duality [66] between the cross section in the resonance region, and the in the deep inelastic region. One can relate cross-sections in these two pictures by either resonance excitation form factors [67] or by treating the resonance as a final state interaction (as a function of and ) that modulates and introduces bumps and wiggles into the average cross predicted from the fits to deep inelastic data [68]. Models using PDFs as the basis of a unified description of the inelastic cross-section can, in principle, be used to predict neutrino and antineutrino differential cross sections for all energies. The cross sections predicted by these modified PDFs can them be compared to measured low energy neutrino data to determine the deviations from this application of duality. It is expected that there will be some deviations from the expectations of this picture at very low and low because of the axial nature of the boson, and because resonances of different isospin are produced at low . In addition, at very low nuclear effects in neutrino and electron scattering could be different due to different final state interactions.
Even if one has a complete description of electron scattering differential cross sections as well as neutrino charged-current and neutral-current differential cross sections at all and , one still needs to understand the hadronic final states. Hadronic production as a function of and can either be described as fragmentation of the final state quarks or in terms of decay products of resonances. Detailed measurements of final states neutrino charged-current and neutral-current scattering experiments are required to test any models relating final states observed in charged-lepton scattering. Particularly for neutral current scattering, these measurements are most easily done in a narrow-band beam where the initial neutrino energy is known.
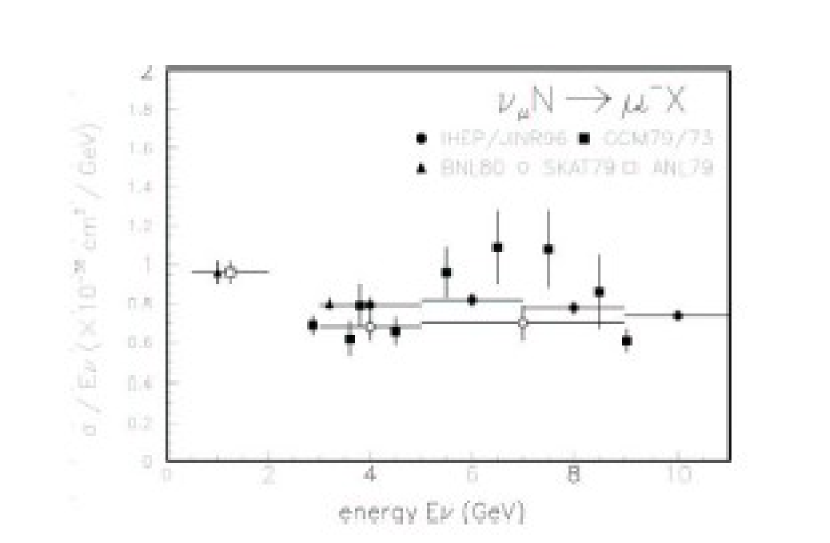
The woeful available data on the neutrino cross sections for one exclusive final state (single pion production) and for the total cross section (sum of quasi-elastic and inelastic) are shown in Figures 44 and 45. As can be seen in the figures, data from different experiments are not in agreement and the errors are very large in the single pion channel. Note that in addition to the total cross section for such an exclusive process, the and distributions must also be known in order for these data to be useful for predicting backgrounds.
Nuclear Effects
The nuclear distortion of the inelastic structure functions, originating from Fermi motion, nuclear energy binding, and shadowing effects, have been measured in the deep inelastic region for the structure function in electron and muon scattering. Although not an axiom, particularly at low , most analyses conventionally assume that for the same value of , these effects are independent of or and are the same for the three neutrino structure functions , , and . To understand the validity of this assumption in modeling nuclear effects, measurements of -dependent effects with both electron and neutrino beams [69] at lower energies are needed. Furthermore, there is little data on nuclear effects on the fragmentation functions. These effects are expected to be significant and at low energies these may be different in neutrino, antineutrino, charged-current, neutral-current, and electron scattering, in part because of final state effects, e.g., neutral pions being absorbed in the final state nucleus or converted to charged pions.
Coherent particle production processes such as coherent neutral-current production of neutral pions () have to be modeled separately since these processes only occur on nuclei. The vector dominance models that are used to describe these processes need to be constrained by direct measurement with neutrino beams before they can be applied to predict enhancements to backgrounds to neutrino interactions on nuclear targets. Studying such processes on the relevant long-baseline target material would be possible in only in a high rate neutrino detector.
Cross-Section Studies in a Near Detector
Cross-section studies could be performed at high statistics in the NUMI beam with either on-axis or off-axis near detectors. As shown in Figure 46, the advantage of an off-axis beam is that it provides a relatively monochromatic beam where the neutrino energies for each event are well-known. The energy of the neutrinos depends primarily on the location of the detector, so for an off-axis detector varying the beam energy would require varying the distance of the detector from the beamline. This approach with a nearly monochromatic beam is particularly valuable for measuring neutral-current cross-sections where the missing neutrino longitudinal moment can be known from a beam constraint. It also allows the direct comparison of near and far detector rates because of the similar spectra. On-axis beams, by contrast, would have higher rates and allow simultaneous measurement across a broad variety of energies, include higher neutrino energies than in off-axis case. Expressions of interest to perform both kinds of experiments have been submitted for consideration to the FNAL PAC [70, 71].

Because high rates can be achieved in small detectors, fully active detectors are possible, such as a tracking calorimeter constructed from scintillator strips with wavelength shifting fiber readout [70, 71]. A conceptual view of such a detector, including side and rear sampling calorimeters, a front veto and a muon ranger is shown in Figure 47. Such a detector could also support multiple nuclear targets, including, for example, thin radiators of high material interspersed in the target, a bulk or segmented active volume of oxygen-rich material such as water-miscible scintillator, or even a small test module of a liquid argon TPC system. A final possibility for such a detector, particularly if off-axis, is a component or module to mimic a far off-axis detector composition as nearly as possible in order to study detector response to various final states that are perfectly tagged in the near detector. This would be particularly appropriate for a sampling calorimeter, where analyses treating active target material as absorber could be employed to precisely predict near detector background and signal efficiencies.
8.3 Targetry
The target will remain a critical device in the NuMI
beamline after upgrade of the Fermilab accelerator complex
with a Proton Driver.
The target must be able to survive a 2MW proton beam with some safety margin.
A good target for a neutrino superbeam facility would satisfy the following
conditions:
it survives one spill;
a steady state temperature must not exceed a temperature stress limit;
the target lifetime is greater than 6 months;
in the case of multiple choice for a target candidate, the optimal
target is the one that provides the highest yield
in the energy interval of interest.
The first three requirements are quite obvious.
The last one is driven by the physics case.
An off-axis neutrino beam of a required energy of 3 GeV
will be formed by secondary pions with energy in the 6–14 GeV interval.
Not all the pions of such energy will contribute
to the neutrino beam. A focusing system acts differently on
pions with different transverse momentum. Moreover, the focusing system itself
would not necessarily be the same for different targets.
Therefore we use a simplified approach for these studies by
integrating over the distribution of the pion flux.
What survives one spill ?
Several commonly used materials were considered for a target.
The target was simulated with the mars14 code [72].
We assumed that a 120 GeV proton beam
hits a rod target with a length of two interaction lengths.
For the first trial, the beam was assumed to be a Gaussian with
= = 1 mm (similar to NuMI parameters).
The target radius was optimized for the maximal pion yield
scanning the radius of the target with a step of 0.5 mm starting
from 2.5 mm (see Table 4).
In order to achieve a power of 2 MW, the nominal NuMI beam
intensity is rescaled by a factor of 5 that corresponds to
21014 protons per spill. We also assumed that the Main Injector
repetition period of 1.9 s does not change.
Calculated peak energy deposition densities (ED) on a beam axis are shown in Table 4 for C through Hg targets. For the beam conditions described above all the materials experience a significant thermal shock. The stress limits known for graphite, nickel and inconel are about 1000 J/g. The limit for copper is about 600 J/g. As one can see from the table, none of the solid materials can survive such conditions.
The pion yield in the defined energy interval does not vary significantly with the target material (Table 4). Figure 49 shows the pion yield versus pion energy for graphite and mercury. Many more soft pions are produced in a mercury target, but the yield is about the same in the energy region of interest. Pion spectra for the other materials behave similarly.
One obvious solution is to increase the beam transverse spot size. In the study below, both the beam spot size = = and target radius are varied. For a graphite target the pion yield as a function of is shown in Figure 49 for different . As one can see the variation of the maximal pion yield for different does not exceed 7%. This is due to the fact that pions leave the target from the sides and not the end, that is atan(R) (Figure 51). Energy deposition in the hottest cell of the target is acceptable at 1.5 mm (Figure 51). For example, for =3 mm and target radius =9 mm the peak energy deposition is J/g, well below the limit. Thus the beam spot size and target radius for graphite can be substantially increased compared to the NuMI parameters without significant loss of yield.
| Material | Peak ED (J/g) | yield (N/POT) | optimal RT (mm) |
|---|---|---|---|
| Graphite | 5.0 | ||
| Nickel | 2.5 | ||
| Inconel | 3.0 | ||
| Copper | 2.5 | ||
| Indium | 3.0 | ||
| Mercury | 3.0 |


The same idea does not work well for other solid dense materials. An attempt to bring the energy deposition safely below the limit by increasing and results in a substantial reduction of the pion yield. For example, if one increases the beam up to 12.5 mm keeping the ratio to be optimal , the pion yield from a target reduces to 0.43 pions per proton, much smaller than the yield of about 0.71 from an optimal graphite target. The density of peak energy deposition is 1250 J/g in this case which is still too high.
Graphite is the most convenient material for an FNAL neutrino superbeam facility. Indeed, the dense solid materials do not provide enough of pion flux at the acceptable beam and target radii. The use of light materials with large interaction lengths such as Li and Na will lead to too long a target, making focusing of secondaries difficult. A mercury jet target seems to be too complex, expensive and hazardous device and at the same time it does not provide any advantages over a graphite target for the given experimental conditions.
Target lifetime
One of the factors limiting the target lifetime is radiation damage. The lifetime determined here corresponds to the time when 5 dpa (displacements per atom) occur in the hottest cell of the target. The atoms are displaced due to interactions with hadrons with kinetic energy of 0.1 MeV. The 5 dpa limit corresponds to the integrated hadron flux of about 51022 cm-2. From the mars simulations we have found that for the beam =3mm and graphite target radius =9mm the limit of 5 dpa is reached within 5 years and 8 months assuming 10 months of operation per year at the full intensity.
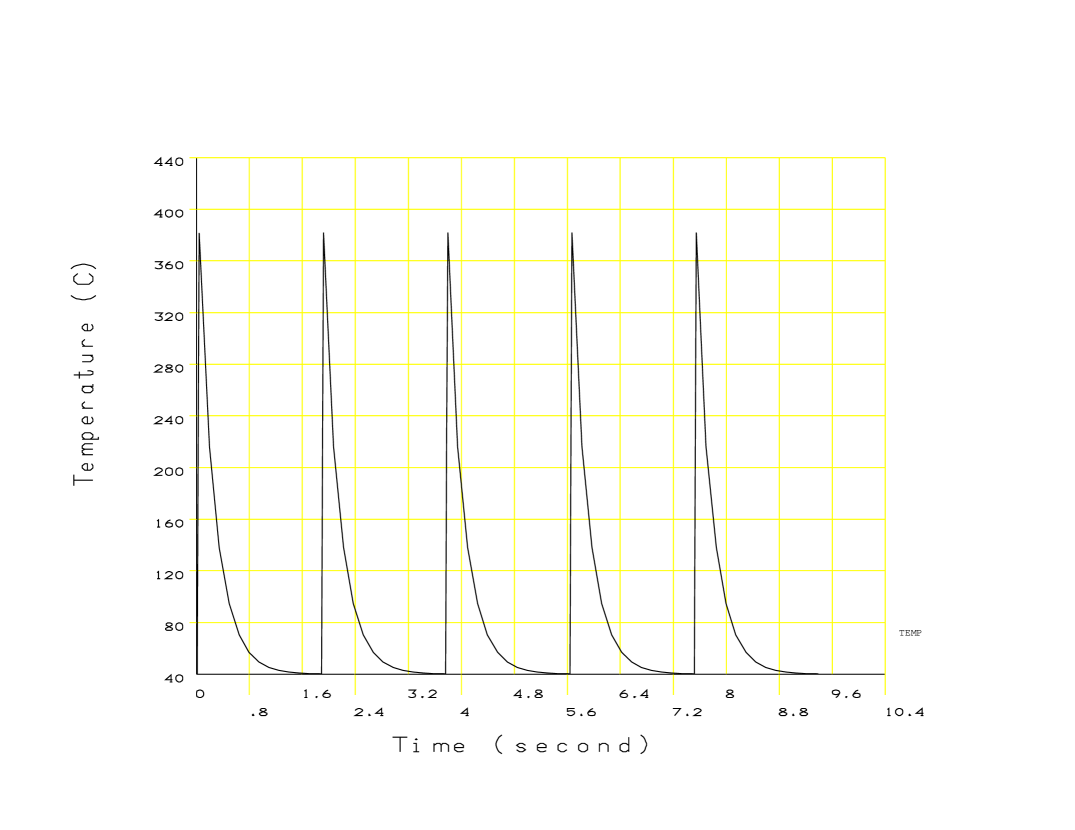
Temperature buildup The temperature evolution in a graphite target has been investigated with the ansys code [73]. An ED distribution in a target with =9mm was simulated with mars. The beam was chosen to be 3mm. The temperature rise for the target elements was estimated from the ED distribution and was assumed to be instanteous. The temperature rise was applied to the target every 1.9 sec. A simplified cooling system was used in this simulation. The heat excess was brought away from the target by water with constant temperature of 40∘ C running around the outer cylindrical surface of the target. As Figure 52 shows, the temperature in the hottest cell oscillates between 40∘ C and 380∘ C without any buildup. The tensile stress obtained from the simulation is about 20 MPa at the tensile strength for graphite of about 90 MPa.
A graphite target for the FNAL neutrino superbeam facility satisfies all requirements: it survives one spill; the lifetime due to radiation damage is acceptable; there is no temperature buildup in target; and the pion yield is quite high.
8.4 NuMI Optics for High Intensity Beams
Design of the NuMI beamline optics for Run II Main Injector beam parameters is now well established. At ppp and a 40 (95 , normalized) beam, specifications call for a =1 mm round beam on the target. With the order-of-magnitude higher intensities projected for the era when a new Proton Driver supplants the current 8 GeV Booster, spot size must be greatly increased to avoid destruction of the target. However, increasing the beam size to =3 mm to accommodate these higher intensities is far beyond the tuning range of the final-focus quadrupole configuration in the baseline NuMI design – requiring as it does a nine-fold growth in on the target.
Creating the desired target beam parameters involves re-locating some, and re-powering all, of the final 6 quadrupoles in the line. (Details of the baseline NuMI lattice are described in [74]). In the high-intensity configuration the lattice is completely unchanged from quads Q101 through Q115. Quadrupoles Q116 Q118 are altered both in gradients and locations. Gradients of the last 3 final-focus quads change (the polarity of Q119 also changes), but they remain in their current locations to preserve the bend center of the final vertical dipole string. The final-focus is tuned to =172.8 m at the target, with dispersion Dx = Dy = 0 – giving =3.00 mm for a 40 beam.
The B2 dipoles comprising the final vertical bend have a 2”(H) 4”(V) aperture. In the horizontal plane, despite the much large final objective, the beam is actually smaller through this restricted aperture than in the baseline design, with (x)=78 m here compared to 99 m previously. Vertically, the beam grows significantly, with (y) reaching 300 m. For a 40 beam this translates into =4.0 mm and, again, no aperture troubles are readily apparent.

8.5 Proton Intensity
In order to maximize the number of neutrino events in any off axis detector, a crucial issue is the proton intensity delivered to the neutrino beam target. An interesting question in the design of future neutrino experiments will be whether more neutrino events can be realized by investing money into more detector mass or into the ability to accelerate more protons. The best experiments in the world will no doubt result from investment in both. An additional incentive for investment in the ability to accelerate protons is that this can provide improved experimental capabilities for other experiments at the same time as increasing the number of neutrino event. Of course, in the NuMI beamline the number of events in the MINOS detector will benefit directly from increasing the protons on target. However, other experiments can also benefit from higher proton intensities, although in general there will be only partial overlap in the specific accelerator improvement projects which benefits each experiment the most.
There are three main paths to increasing the proton intensity:
-
1.
Invest in the existing accelerator complex to increase the number of protons which can be accelerated: For NuMI, this specifically means investment in the Booster and Main Injector to increase the number of protons which can be handled per acceleration cycle and to reduce the cycle time so more total protons are delivered per unit time. This is likely the only means of increasing the proton intensity within the next five years. A recent study [75] has identified a number of upgrades possible in the Booster and Main Injector which can yield significant increases in the proton intensity for NuMI. Total proton beam power from 0.6-0.8 MW should be possible for an investment in the range of $50M over five years (a factor of at least 4 increase from the capability with no new investment).
-
2.
Build new accelerators to increase the intensity: The proton driver is a new accelerator to replace the Booster as an injector to the Main Injector. Both a new synchrotron and a LINAC have been studied [76, 77]. Improvements in the Main Injector for handling high beam intensity would be essential. A faster cycle time in the Main Injector presents an attractive means of yet higher protons on target than just the new proton driver. With this approach, total proton beam power greater than 2 MW should be possible with total cost in the range $200M-$350M. A series of neutrino experiments over many years could form the core of the justification for such a machine [78].
-
3.
Reconfigure the existing complex to be used in new ways that will maximize protons for NuMI: An example here is to use a slightly reconfigured recycler ring as a stacking system at 8 GeV to accumulate protons which are then injected into the Main Injector [79]. This can increase the total number of protons per cycle and decrease the MI cycle time since stacking can occur while the MI is ramping from a previous injection. Of course, this kind of scheme will only be possible once collider operation had finished. In this case, Main Injector improvements for both proton intensity and cycle time are required. Total proton beam energy in the range 0.8-1.0 MW should be possible at a total cost in the range of $70M. This approach could be taken as a “next step” following the various improvements in the existing complex ($50M in item 1 above) for an incremental investment of about $25M.
Any of these paths to increasing proton intensity will require significant manpower resources beyond those currently available within Fermilab Beams Division Some of that manpower investment must come from groups interested in the neutrino experiments (MINOS, off axis,…) for these projects to move forward. An ongoing NuMI Proton Intensity Working group is in formation and work in this direction should be considered with comparable importance as R&D for detector construction. Many examples of possible upgrade projects which can be undertaken in the near term are presented in reference [75].
9 Summary
We are at an important stage of the field of neutrino oscillations. Between the currently running generation of experiments and the next we will be going from confirmation of oscillations to precision measurements of the atmospheric parameters. At the same time, we as a field are trying to determine not only how to see evidence for the last undiscovered mixing angle , but how to get ultimately to precise measurements of probabilities. Although there are many suggestions for how to get to precision, certainly the experiments with the highest reach for seeing a non-zero probability for a given proton beam power and detector mass are those which use a very narrow band neutrino beam to minimize backgrounds. The off-axis technique, suggested originally by Brookhaven and adapted by the JHF to SuperK proposal, is a powerful one to achieve such a narrow band beam.
Given the intense neurino beamline that is currently being built at Fermilab, and the long distances the resulting neutrinos will travel, there is an enormous opportunity not only for seeing transitions, but to get to the underlying physics: determining the mass hierarchy and ultimately measuring CP violation. Because of the off-axis technique and the lack of a far detector location at present, there is a wide range of energies and baselines that can be chosen. The narrowest neutrino beam produced by the NUMI beamline is at about 2 GeV and emerges about 14 mrad from the beamline axis, but ultimately the most precise measurements of CP violation or the mass hierarchy may come from placing a detector elsewhere off-axis, from neutrino energies from 0.6 to as much as 3 GeV. In this document we have therefore focused on detectors which are suitable for measurements at 2 GeV, but where relevant we have tried to comment on their appropriateness at other energies in that range.
Over its century history, the field of particle physics has developed expertise in a large number of techniques for detecting ionizing radiation. The preferred technology would likely be the least expensive one as a function of physics reach, but direct cost comparisons are difficult for at least two reasons: 1.) The capabilities of each system are different and it is not always clear how to compare the value of an additional capability, and 2.) choosing between certain designs with comparable capabilities would require a level of detail in the cost estimate which is not currently available. Therefore, this document must at best recommend the steps that need to be taken to be able to ultimately chose a detector technology (or technologies) for the NuMI off-axis beam.
Here we summarize some of the salient features of each technology considered:
Conclusions about Water Cerenkov:
-
•
Much expertise in the field with large detector performance
-
•
20 kton fiducial mass proof of principle exists.
-
•
Chain reaction of phototube implosions now understood.
-
•
Costs driven almost entirely by phototubes.
-
•
operation at the surface not obvious but perhaps possible (K2K).
-
•
Could be promising for high angle lowest energy (sub-GeV) beams, but
-
•
Monte Carlo studies show identification at 2GeV compromised due to inability of detector to discriminate between high energy neutral current production, and charged current interactions.
-
•
R&D efforts being pursued elsewhere already for sJHF to HK, which include developing cheaper and more robust photodetectors. This won’t change the background rejection capabilities, however.
-
•
since individual particle energy resolution is not a limiting factor, the AQUARICH technology is not likely to have very different conclusions than regular water cerenkov devices.
Conclusions about Liquid Argon TPC’s:
-
•
Very detailed pattern recognition capabilities, especially for electron identification.
-
•
Monte Carlo Studies show this to be the most efficienct detector for keeping signal and rejecting background.
-
•
Cosmic ray studies in Pavia show that backgrounds at the ground level are manageable assuming acceptable data handling capabilities.
-
•
Economies of scale and experience of Liquid Natural Gas industry promising for a large (phase III) single-volume detector.
-
•
Favorable scaling for large size.
-
•
Need to verify that particle identification works as well as predicted in simulations–this could be a promising phase III detector, but we strongly recommend placing a prototype detector in a neutrino beam which could prove the performance in the first few radiation lengths of a neutrino interaction.
Conclusions about Fine-Grained Calorimetry:
-
•
Monte Carlo studies show this detector has adequate background discrimination and energy resolution, and the processes that generate the signals are well-understood (thresholds well below those for water cerenkov, for example, and there’s a long history in the field of sampling calorimetry).
-
•
Low Z absorber would provide the maximum amount of mass per readout plane, but low density induces large separations between consecutive readout planes. Backgrounds induced by operation at the surface must be verified.
-
•
Different readout technologies have different risks associated with them:
-
–
RPC’s: possibly the cheapest readount per , but operational difficulties have been encountered in the past.
-
–
Streamer Tubes: are likely to be the next cheapest readout.
-
–
Liquid or Solid Scintillator is the easiest to operate, no tricky gas or high voltage systems to build.
-
*
Depending on light collection technique, the integration time could be quite long, implying bigger cosmic ray problems.
-
*
Minimum R&D, can use much of what was learned while designing MINOS.
-
*
Gains in recent past to reduce fabrication costs for solid scintillator.
-
*
Liquid scintillator would be easy to install in situ.
-
*
-
–
-
•
Different absorber ideas have different risks associated with them:
-
–
Is the cost of containing the water for a water-absorber detector prohibitively high?
-
–
Would particle board warp too much to be acceptable for housing detector elements?
-
–
Can any solid low z material provide enough mechanical support for readout?
-
–
-
•
Finally, before one embarks on a full-scale construction of any fine-grained calorimeter, one should certainly produce a prototype, where at least one dimension of the prototype would be the size of a single module.
There are a few issues which must be addressed regardless of detector technology: for example, what is the the optimal segmentation that is required to get an acceptable neutral current rejection factor? Also, does the detector technology respond as predicted to charged particle beams?
For phase II, we specifically recommend focused R&D on fine-grained calorimetry: this technique appears to have the smallest amount of risk associated with it, and although there are several options for absorber and readout technology, the outstanding issues are largely engineering ones, and can be addressed relatively quickly.
For both phases, we will need to improve our understanding of neutrino interactions in the NuMI Off-axis energy regime. In phase II this is critical to get to the best precision on measuring the disappearance probability, and in phase III this will be essential to optimize the design of what is likely to be a M$ detector. We therefore recommend that as early as phase I that there be a program established to study neutrino interactions in a location underground at the NuMI beamline facility.
For phase III, large water Cerenkov detectors or liquid argon offer scaling advantages. In addition to sensitivity for , if placed underground, such detectors would be sensitive to proton decay and other topics of underground physics. Since the time scale for phase III R&D will take longer, it is important that this effort start now. We recommend building a small prototype to test in (but slightly off the axis of) the NuMI beamline, somewhere in the near detector hall.
Finally, the most sensible path to the physics is not simply to improve the far detector’s size and/or performance. Investments in both the proton source (as early as phase I) and the beamline itself (phase III) will improve the experiment’s sensitivity dramatically, and in a more economical way than by simply increasing the detector size.
The writers of this report look forward to joining such R&D programs and collaborations which are forming to pursue future neutrino initiatives.
References
- [1] C. Albright et al. (Fermilab Neutrino Factory Physics Working Group), “Physics at a Neutrino Factory”, Apr. 2000, hep-ph/hep-ex/0008064. (See also the companion machine study “Feasibility Study of a Neutrino Factory Based on a Muon Storage Ring”, by the Fermilab Neutrino Factory Feasibility Study Working Group, N. Holtkamp, et al.)
- [2] See http://www-numi.fnal.gov/ .
- [3] See http://www-boone.fnal.gov/ .
- [4] See http://proj-cngs.web.cern.ch/proj-cngs/.
- [5] See http://neutrino.kek.jp/jhfnu, in particular, Y. Itoh et al., “Letter of Intent: A Long Baseline Neutrino Oscillation Experiment using the JHF 50 GeV Proton Synchrotron and the Super-Kamiokande Detector” (Feb. 2000); Y. Itoh et al, “The JHF-Kamioka Neutrino Project”, hep-ex/0106019.
- [6] V. Barger et al. (Fermilab Superbeam Working Group), Nov., 2000, hep-ph/0103052.
- [7] V. Barger, S. Geer, R. Raja, and K. Whisnant, Phys. Rev. D63, 113011 (2001).
- [8] I. Mocioiu and R. Shrock, JHEP 0111, 050 (28 pages) (2001).
- [9] UNO Protocollaboration and Theoretical Advisory Committee, ‘Physics Potential and Feasibility of UNO”, UNO Snowmass 2001 White Paper, June, 2001.
- [10] Snowmass E1 Working Group (T. Adams et al.), E1 Working Group Summary: Neutrino Factories and Muon Colliders, hep-ph/0111030.
- [11] W. Chou, ed. “Proton Driver Design Study”, Fermilab-TM-2136 (2001).
- [12] G. Barenboim et al., hep-ph/0204208.
- [13] G. Barenboim, A. de Gouvea, T. Dombeck, N. Grossman, D. Harris, D. Michael, M. Szleper, M. Velasco, and S. Werkema, hep-ex/0206025.
- [14] Muon Collider and Neutrino Factory Collaboration, “Neutrino Factory Feasibility Study II” (May 2001), available at http://www.cap.bnl.gov/mumu.
- [15] e.g., K. McDonald and R. Shrock, talks at Snowmass 2001, June, 2001; W. Marciano, hep-ph/0108181; A. Mann et al. (3M Protocollaboration), “Megaton Modular Multi-Purpose Neutrino Detector” (Nov. 2001); D. Beavis et al., Neutrino Oscillation Experiments for Precise Measurements of Oscillation Parameters and Search for Muon-Neutrino to Electron Neutrino Appearance and CP Violation: Letter of Intent to Brookhaven National Laboratory”, hep-ex/0205040.
- [16] e.g., V. Barger, D. Marfatia, and K. Whisnant, hep-ph/0206038.
- [17] L. Wolfenstein, Phys. Rev. D17, 2369 (1978); S. P. Mikheyev and A. Smirnov, Yad. Fiz. 42, 1441 (1985) [Sov.J. Nucl. Phys. 42, 913 (1986)], Nuovo Cim., C9, 17 (1986).
- [18] V. Barger, K. Whisnant, S. Pakvasa, and R. J. N. Phillips, Phys. Rev. D22, 2718 (1980); P. Krastev, Nuovo Cimento 103A, 361 (1990); R. H. Bernstein and S. J. Parke, Phys. Rev. D44, 2069 (1991); De Rujula, M. B. Gavela, and P. Hernandez, Nucl. Phys. B547, 21 (1999); P. Lipari, Phys.Rev. D61, 113004 (2000) S. Dutta, R. Gandhi, and B. Mukhopadhyaya, Eur.Phys.J. C18, 405 (2000); V. Barger, S. Geer, K. Whisnant, Phys.Rev. D61, 053004 (2000); D. Dooling, C. Giunti, K. Kang, C. W. Kim,Phys.Rev. D61,073011 (2000); A. Bueno, M. Campanelli, A. Rubbia, Nucl.Phys. B573, 27 (2000); V. Barger, S. Geer, R. Raja, K. Whisnant, Phys.Rev. D62, 013004 (2000); M. Freund, M. Linder, S.T. Petcov, A. Romanino, Nucl.Phys. B578, 27 (2000); I. Mocioiu and R. Shrock, AIP Conf.Proc. 533, 74 (2000) (NNN99); I. Mocioiu and R. Shrock, Phys.Rev. D62, 053017 (2000); V. Barger, S. Geer, R. Raja, K. Whisnant, Phys.Rev. D62, 073002 (2000); A. Cervera, A. Donini, M.B. Gavela, J. Gomez Cadenas, P. Hernandez, O. Mena, and S. Rigolin, Nucl.Phys. B579, 17 (2000), Erratum-ibid. B593, 731 (2001); M. Freund, P. Huber, M. Lindner, Nucl.Phys. B585, 105 (2000); V. Barger, S. Geer, R. Raja, K. Whisnant, Phys.Lett. B485, 379 (2000); Z.-Z. Xing, Phys. Lett. 487, 327 (2000); Phys. Rev. D63, 073012 (2000); A. Bueno, M. Campanelli, A. Rubbia, Nucl.Phys. B589, 577 (2000); P. Fishbane, Phys. Rev. D62, 093009 (2000); P. Fishbane and P. Kaus, Phys. Lett. B506, 275 (2001); P. Fishbane and S. Gasiorowicz, hep-ph/0012230; V. Barger, S. Geer, R. Raja, K. Whisnant, Phys.Rev. D63, 033002 (2001); M. Freund, P. Huber, M. Lindner, hep-ph/0105071. E. Akhmedov, A. Dighe, P. Lipari, A. Smirnov, Nucl. Phys. B542, 3 (1999); E. Akhmedov, Nucl.Phys. B538, 25 (1999); E. Akhmedov, hep-ph/0001264; E. Akhmedov, P. Huber, M. Lindner, and T. Ohlsson, hep-ph/0105029; J. Arafune, J. Sato, Phys.Rev. D55, 1653 (1997); H. Minakata, H. Nunokawa, Phys.Rev. D57, 4403 (1998); M. Koike, J. Sato, hep-ph/9707203, Phys.Rev. D62, 073006 (2000).
- [19] A. Romanino, Nucl.Phys. B574 675 (2000); S.M. Bilenky, C. Giunti, W.Grimus, Phys.Rev. D58, 033001 (1998); K. Dick, M. Freund, M. Lindner, A. Romanino, Nucl. Phys. B562, 29 (1999); M. Tanimoto, Phys. Lett. B462, 115 (1999); A. Donini, M.B. Gavela, P. Hernandez, S. Rigolin, Nucl.Phys. B574, 23 (2000); M. Koike, J. Sato, Phys.Rev. D61, 073012 (2000), Erratum-ibid. D62, 079903 (2000); S. J. Parke, T. J. Weiler, Phys.Lett. B501, 106 (2001); T. Miura, E. Takasugi, Y. Kuno, and M. Yoshimura, Phys. Rev. D64, 013002 (2001); M. Koike, T. Ota, J. Sato, hep-ph/0011387; P. Lipari. hep-ph/0102046.
-
[20]
D. Ayres et al. (A. Para, contact person), “Letter of Intent to
Build an Off-Axis Detector to Study Oscillations with the
NUMI Neutrino Beam”, June, 2002.
hep-ex/0210005 - [21] Recent solar data is in S. Fukuda, et al. Phys. Rev. Lett. 86, 5651 (2001), S. Fukuda et al., ibid, 5656 (2001) (SuperKamiokande) and Q.R. Ahmad et al., Phys. Rev. Lett. 87, 071301 (2001), nucl-ex/0204008, nucl-ex/0204009 (SNO). The Homestake, Kamiokande, GALLEX, and SAGE experiments provided earlier data.
- [22] See, for example, Q.R. Ahmad et al. in [21].
- [23] Y. Fukuda et al., Phys. Lett. B433, 9 (1998); Phys. Rev. Lett. 81,1562 (1998); ibid., 82, 2644 (1999); Phys. Lett. B467, 185 (1999) (SuperK). Other data is from the Kamiokande, IMB, Soudan-2, and MACRO experiments; see, e.g., talks at Neutrino-2000, Neutrino-2002.
- [24] S. H. Ahn et al., Phys. Lett. B511, 178 (2001); J. Hill, talk at the NOON Conf. (Dec., 2001).
- [25] C. Athanassopoulous et al., Phys. Rev. Lett. 77, 3082 (1996); Phys. Rev. Lett. 81, 1774 (1998); A. Aguilar et al., hep-ex/0104049.
- [26] M. Steidl for the KARMEN Collaboration, Nucl. Phys. Proc. Suppl. 100, 188 (2001).
- [27] M. Apollonio et al., Phys. Lett. B420, 397 (1998); Phys. Lett. B466, 415 (1999).
- [28] C. Jarlskog, Z. Phys. C29, 491 (1985); Phys. Rev. D35, 1685) (1987).
- [29] V. Barger, S. Pakvasa, T. Weiler, and K. Whisnant, Phys. Rev. Lett. 85, 5055 (2000); H. Murayama and T. Yanagida, Phys. Lett. B520, 263 (2001); G. Barenboim, L. Borissov, J. Lykken and A. Smirnov, hep-ph/0108199; G. Barenboim, L. Borissov, and J. Lykken, Phys. Lett. B534, 106 (2002); G. Barenboim, J. Beacom, L. Borissov, and B. Kayser, Phys. Lett. B537, 227 (2002); I. Mocioiu and M. Pospelov, Phys. Lett. B534, 114 (2002); A. Strumia, hep-ph/0201134.
- [30] M. Freund, P. Huber and M. Lindner, Nucl. Phys. B 615, 331 (2001).
- [31] V. Barger, D. Marfatia and K. Whisnant, Phys. Rev. D 66, 053007 (2002).
- [32] C. Rubbia, The Liquid Argon Time Projection Chamber: a New Concept for Neutrino Detector, CERN-EP/77-08 (1977).
- [33] The ICARUS Collaboration, The ICARUS Experiment: a second-generation Proton decay experiment and Neutrino Observatory at Gran Sasso Observatory – Initial Physics Program, ICARUS-TM/01-03 (Mar. 1, 2001), http://www.aquila.infn.it/icarus/icarus_tm/icarus_01_03.pdf A. Bueno et al., Nucleon decay searches: study of nuclear effects and background, ICARUS-TM/01-04 (Oct. 9, 2001), http://www.aquila.infn.it/icarus/icarus_tm/icarus_01_04.pdf
- [34] Among a vast literature, see, for example, J.C. Pati, With Grand Unification Signals in, Can Proton Decay be Far Behind? (June 7, 2001), hep-ph/0106082.
- [35] A. Bettini et al., A study of the factors affecting the electron lifetime in ultra-pure liquid argon, Nucl. Instr. and Meth. A305, 177 (1991).
- [36] In the USA, Oxisorb cartridges can be ordered from Frank Tamandl of MG Industries, Alllentown, PA, 610-530-5342, http://www.mgindustries.com/gts/SpecGasEquip/Filtration.pdf
- [37] D.B. Cline, F. Sergiampietri, J.G. Learned, K.T. McDonald, LANNDD, A Massive Liquid Argon Detector for Proton Decay, Supernova and Solar Neutrino Studies, and a Neutrino Factory Detector (May 24, 2001), astro-ph/0105442
- [38] F. Sergiampietri, On the Possibility to Extrapolate Liquid Argon Technology to a Supermassive Detector for a Future Neutrino Factory, presented at NuFACT’01 (May 26, 2001), http://www.hep.princeton.edu/mcdonald/nufact/sergiampietri_nufact01.pdf
- [39] See sec. 6.8 of [49].
- [40] Kate Loritz, Praxair Account Manager, USA Liquid Argon Market Overview (June 24, 2002), http://www.hep.princeton.edu/mcdonald/nufact/mulholland/Praxair_quotation.pdf
- [41] G. Mulholland, ELAN Detector Vessel Preliminary Study, (May 17, 2002), http://www.hep.princeton.edu/mcdonald/nufact/mulholland/ELAN_Proposal.pdf
- [42] Fabrizio Catarsi, CAEN Marketing Director, f.catarsi@caen.it, Bert Yost, bert.yost@caen,it.
- [43] A. Badertscher et al., Magnetized Liquid Argon Detector for Electron Charge Sign Discrimination, Letter of Intent to the CERN SPSSC (Jan. 3, 2002), http://www.hep.princeton.edu/mcdonald/nufact/uL@CERN_LOI.pdf
- [44] M.V. Diwan et al., Proposal to Measure the Efficiency of Electron Charge Sign Determination up to 10 GeV in a Magnetized Liquid Argon Detector (LANNDD), submitted to BNL (April 12, 2002), http://www.hep.princeton.edu/mcdonald/nufact/bnl_loi/argonprop.pdf
- [45] C. Lu and K.T. McDonald, Studies of a Liquid Argon Time Projection Chamber in a Magnetic Field, submitted to the DOE Advanced Detector Research Program (Oct. 30, 2001), http://www.hep.princeton.edu/mcdonald/nufact/argonprop_103001.pdf
- [46] A. Bodek et al., Expression of Interest in Construction of an Off-Axis Near Detector to Measure Neutrino Cross Sections on Nuclear Targets in the Few GeV Region with the NUMI Beam, submitted to the FNAL PAC (June 4, 2002), http://www.pas.rochester.edu/ksmcf/eoi.pdf
- [47] F. Sergiampietri et al., Proc. 4rth Int. Conf. on Calorimetry in High-Energy Physics (Elba, Italy, 1993), p. 357.
- [48] F. Arneodo et al., Operation of a 10 m3 ICARUS Detector Module, Nucl. Instr. and Meth. A461, 286 (2000), http://www.aquila.infn.it/icarus/icarus_tm/icarus_00_06.ps
- [49] The ICARUS Collaboration, Cloning of T600 Modules to Reach the Design Sensitive Mass, ICARUS-TM/01-09, http://pcnometh4.cern.ch/Proposals/t2400doc_lowres.pdf
- [50] P. Antonioli et al., Nucl. Inst. & Meth. A433, 104 (1999)
- [51] J. Seguinot and T. Ypsilantis, Nucl. Inst. & Meth. A343, 30 (1994)
- [52] A. Großheim, diploma thesis, University of Dortmund, November, 1999.
- [53] A. Großheim and K. Zuber, submitted to Elsevier Preprint, April, 2001.
- [54] The GEANT simulation was realized by Richard Soluk at the University of Alberta, Edmonton, Canada.
- [55] NuMI Off Axis LOI.
- [56] V. Guarino, New Initiatives in the NuMI Neutrino Beam, Fermilab May 2002).
- [57] R. Richards, New Initiatives in the NuMI Neutrino Beam, Fermilab (May 2002).
- [58] Border et al, NIM A 463, 194-204, (2001).
- [59] Matthew J. Hansen, January 1999, “The Design and Testing of a Liquid Scintillator High Energy Particle Detector”, University of Minnesota Masters Degree Thesis in Mechanical Engineering, unpublished; and Timothy J. Berg, February 1997, “Structural Design of a High Energy Particle Detector Using Liquid Scintillator”,University of Minnesota Masters Degree Thesis in Mechanical Engineering, unpublished.
- [60] K. Heller, New Initiatives in the NuMI Neutrino Beam, Fermilab (May 2002).
-
[61]
6th Workshop on Resistive Plate Chambers and Related Detectors
(RPC2001),
26-27 November 2001, Coimbra, Portugal.
Home URL: - [62] K. Hagaware et al., Review of Particle Physics, Phys. Rev. D66, 2002.
- [63] T. Kitigaki et al., Phys. Rev. D28, 436 (1983).
-
[64]
A. Bodek and J. L. Ritchie, Phys. Rev. D23 1070 (1981).
A. Bodek and J. L. Ritchie, Phys. Rev. D24 1400 (1981). - [65] see talk by M. Sakuda at NuInt01, the First International Workshop on Neutrino-Nucleus Interactions in the Few GeV Region, Dec. 2001, KEK, Tsukuba, Japan. To be published in Nucl. Physics B. Proceedings Supplement, Fall 2002. http://neutrino.kek.jp/nuint01/
- [66] E. D. Bloom and F. J. Gilman, Phys. Rev. Lett. 25, 1140 (1970).
- [67] D. Rein and L. M. Sehgal, Annals of Physics 133 79 (1981); R. Belusevic and D. Rein, Phys. Rev. D 46, 3747 (1992).
-
[68]
A. Bodek et al., Phys. Rev. D20, 1471 (1979).
A. Bodek and U. K. Yang,
“Modeling deep inelastic cross sections in the few GeV region,”
hep-ex/0203009. Presented by Arie Bodek at NuInt01, the First International Workshop on Neutrino-Nucleus Interactions in the Few GeV Region, Dec. 2001, KEK, Tsukuba, Japan. To be published in Nucl. Physics B. Proceedings Supplement, Fall 2002. - [69] J. Marteau, “Effects of the nuclear correlations on the neutrino-nucleus interactions”, submitted to the proceedings of NuInt01. http://neutrino.kek.jp/nuint01/
- [70] H. Budd et al. , “Expression of Interest in Construction of an Off-Axis Near Detector to Measure Neutrino Cross Sections on Nuclear Targets In the Few GeV Region”, unpublished, June 2002.
- [71] J. Morfin et al. , in preparation.
- [72] N. V. Mokhov, “The MARS Monte Carlo”, Fermilab FN-628 (1995); N. V. Mokhov and O. E. Krivosheev, “MARS Code Status”, Fermilab-Conf-00/181 (2000); http://www-ap.fnal.gov/MARS/.
- [73] “ANSYS (rev.5.1)”, Swanson Analysis System, Inc., SASI/DN-P511:51, Houston (1994).
- [74] J.A.Johnstone, A Modular Optics Design for the NuMI Beamline, Fermilab-TM-2174, 2002.
- [75] “Accelerator improvement options for NuMI proton intensity”, The NuMI Proton Intensity Working Group, B. Choudhary etal., NuMI-863, Aug. 2002.
- [76] Design study for a new 8 GeV Synchrotron, W. Chou, etal. Report in preparation.
- [77] Design study for a new 8 GeV LINAC, G.W. Foster, etal., Report in preparation.
- [78] “Physics case for a new proton driver at Fermilab”, hep-ph……, May 2002.
- [79] J. Marriner, private communication, Jun. 2002.