Asymmetries in the Production of Λ 0superscriptΛ 0\Lambda^{\,0} in 250 GeV/c𝑐c π±superscript𝜋plus-or-minus\pi^{\pm}, K± and p – Nucleon Interactions

Abstract

Using data from Fermilab fixed-target experiment E769, we have measured particle-antiparticle production asymmetries for Λ 0superscriptΛ 0\Lambda^{\,0} hyperons in 250 GeV/c𝑐c π±superscript𝜋plus-or-minus\pi^{\pm}, K± and p – nucleon interactions. The asymmetries are measured as functions of Feynman-x (xFsubscript𝑥𝐹x_{\scriptscriptstyle F}) and pT2superscriptsubscript𝑝𝑇2p_{\scriptscriptstyle T}^{2} over the ranges 0.12xF0.120.12subscript𝑥𝐹0.12-0.12\leq x_{\scriptscriptstyle F}\leq 0.12 and 0pT23(GeV/c)20superscriptsubscript𝑝𝑇23superscript𝐺𝑒𝑉𝑐20\leq p_{\scriptscriptstyle T}^{2}\leq 3(GeV/c)^{2} (for positive beam) and 0.12xF0.40.12subscript𝑥𝐹0.4-0.12\leq x_{\scriptscriptstyle F}\leq 0.4 and 0pT210(GeV/c)20superscriptsubscript𝑝𝑇210superscript𝐺𝑒𝑉𝑐20\leq p_{\scriptscriptstyle T}^{2}\leq 10(GeV/c)^{2} (for negative beam). We find substantial asymmetries, even at xFsubscript𝑥𝐹x_{\scriptscriptstyle F} around zero. We also observe leading-particle-type asymmetries. These latter effects are qualitatively as expected from valence-quark content of the target and variety of projectiles studied.


G.A. Alves,(1) S. Amato,(1),aaaNow at Universidade Federal do Rio de Janeiro, Rio de Janeiro, Brazil J.C. Anjos,(1) J.A. Appel,(2) J. Astorga,(5) T. Bernard,(5),bbbDeceased S.B. Bracker,(4),cccRetired L.M. Cremaldi,(3) W.D. Dagenhart,(5)dddNow at Brandeis University, Waltham, MA 02454 C.L. Darling,(8) D. Errede,(7),eeeNow at University of Illinois, Urbana, Il 61801 H.C. Fenker,(2),fffNow at Thomas Jefferson National Accelerator Facility, Newport News, VA 23606 C. Gay,(4),gggNow at Yale University, New Haven, CT 06511 D.R. Green,(2) R. Jedicke,(4),hhhNow at LPL, University of Arizona, Tucson, AZ 85721 P.E. Karchin,(6) S. Kwan,(2) L.H. Lueking,(2) J.R.T. de Mello Neto,(1),𝚊1𝚊{}^{(1),~{}{\mathtt{a}}} J. Metheny,(5) R.H. Milburn,(5) J.M. de Miranda,(1) H. da Motta,(1) A. Napier,(5) M.S. Nicola,(1) D. Passmore,(5) A. Rafatian,(3) A.C. dos Reis,(1) W.R. Ross,(8) A.F.S. Santoro,(1),iiiNow at Universidade do Estado do Rio de Janeiro, Rio de Janeiro, Brazil M. Sheaff,(7) M.H.G. Souza,(1) C. Stoughton,(2) M.E. Streetman,(2),𝚌2𝚌{}^{(2),~{}{\mathtt{c}}} D.J. Summers,(3) S.F. Takach,(6) A. Wallace,(8) Z. Wu(8)
(1)Centro Brasileiro de Pesquisas Físicas, Rio de Janeiro, Brazil

(2)Fermi National Accelerator Laboratory, Batavia, Illinois, 60510

(3)University of Mississippi, University, MS 38677

(4)University of Toronto, Toronto, Ontario, Canada, M5S 1A7

(5)Tufts University, Medford, MA 02155

(6)Wayne State University, Detroit, Michigan 48202

(7)University of Wisconsin, Madison, WI 53706

(8)Yale University, New Haven, CT 06511


(Fermilab E769 Collaboration)

Leading particle production effects have been studied both experimentally [1, 2, 3, 4, 5, 6] and theoretically [7, 8, 9, 10, 11]. These effects are manifest as an enhancement in the production rate of particles that share one or more valence quarks with an initial state hadron compared to their antiparticles when they share either none or fewer. This enhancement is expected to become larger as the produced particles carry more and more of the initial particle’s center-of-mass momentum. Other effects, like the associated production of a kaon and a hyperon, can also contribute to an asymmetry in hyperon-antihyperon production [12].

As a byproduct of our charm program in Fermilab Experiment E769, we collected a large sample of Λ 0superscriptΛ 0\Lambda^{\,0} and Λ¯ 0superscript¯Λ 0\overline{\Lambda}^{\,0} hyperons which we have used to measure the particle-antiparticle production asymmetries reported here. Given E769’s variety of identified beam particles, we can study the production asymmetries as the content of valence quarks in the beam changes. This is the first such measurement in the central kinematical region (i.e., near xF=0subscript𝑥𝐹0x_{\scriptscriptstyle F}=0) and with this variety of projectiles in a single experiment.

The asymmetry A𝐴A can be defined as

ANΛ 0NΛ¯ 0NΛ 0+NΛ¯ 0𝐴subscript𝑁superscriptΛ 0subscript𝑁superscript¯Λ 0subscript𝑁superscriptΛ 0subscript𝑁superscript¯Λ 0A\equiv{\frac{N_{\Lambda^{\,0}}-N_{\overline{\Lambda}^{\,0}}}{N_{\Lambda^{\,0}}+N_{\overline{\Lambda}^{\,0}}}}\; (1)

where NΛ 0subscript𝑁superscriptΛ 0N_{\Lambda^{\,0}} (NΛ¯ 0subscript𝑁superscript¯Λ 0N_{\overline{\Lambda}^{\,0}}) is the number of Λ 0superscriptΛ 0\Lambda^{\,0} (Λ¯ 0superscript¯Λ 0\overline{\Lambda}^{\,0}) produced over the kinematic range of interest.

For all beam types, a positive asymmetry growing larger with increasingly negative xFsubscript𝑥𝐹x_{\scriptscriptstyle F} is expected, because Λ 0superscriptΛ 0\Lambda^{\,0} (uds𝑢𝑑𝑠uds) shares two valence quarks with the target p (uud𝑢𝑢𝑑uud) or n (udd𝑢𝑑𝑑udd) while Λ¯ 0superscript¯Λ 0\overline{\Lambda}^{\,0} (u¯d¯s¯¯𝑢¯𝑑¯𝑠\overline{u}\overline{d}\overline{s}) shares none. For both the π+superscript𝜋\pi^{+} (ud¯𝑢¯𝑑u\overline{d}) and πsuperscript𝜋\pi^{-} (u¯d¯𝑢𝑑\overline{u}d) beams, an asymmetry close to zero is expected for xF>0subscript𝑥𝐹0x_{\scriptscriptstyle F}>0, because Λ 0superscriptΛ 0\Lambda^{\,0} and Λ¯ 0superscript¯Λ 0\overline{\Lambda}^{\,0} each share one valence quark with the incident beam. For the K+ (us¯𝑢¯𝑠u\overline{s}) beam, a negative asymmetry which becomes more negative with increasing xFsubscript𝑥𝐹x_{\scriptscriptstyle F} is expected for xF>0subscript𝑥𝐹0x_{\scriptscriptstyle F}>0, because Λ¯ 0superscript¯Λ 0\overline{\Lambda}^{\,0} shares the heaviest valence quark with the beam while Λ 0superscriptΛ 0\Lambda^{\,0} shares only a light quark. The situation is reversed for the K- (u¯s¯𝑢𝑠\overline{u}s) beam, where the asymmetry in the forward direction is expected to be positive and to become more positive with increasing xFsubscript𝑥𝐹x_{\scriptscriptstyle F}. For the p (uud𝑢𝑢𝑑uud) beam, a large positive asymmetry which grows even larger with increasing xFsubscript𝑥𝐹x_{\scriptscriptstyle F} is expected in the forward direction, because Λ 0superscriptΛ 0\Lambda^{\,0} shares two valence quarks with beam proton while Λ¯ 0superscript¯Λ 0\overline{\Lambda}^{\,0} shares none. Although measurements of Λ 0superscriptΛ 0\Lambda^{\,0} and Λ¯ 0superscript¯Λ 0\overline{\Lambda}^{\,0} production asymmetries have been made in several other experiments [1, 13, 14, 15, 16, 17], no single experiment to date has been able to study the asymmetries and to compare them for all five beam types, πsuperscript𝜋\pi^{-}, π+superscript𝜋\pi^{+}, p𝑝p, K+superscript𝐾K^{+} and Ksuperscript𝐾K^{-}.

Experiment E769 recorded about 400×106400superscript106400\times 10^{6} physics events from interactions of 250 GeV/c𝑐c hadron beams of both signs on a multifoil target of Be, Cu, Al and W. The negative beam consisted of 93%percent9393\% πsuperscript𝜋\pi^{-}, 5%percent55\% Ksuperscript𝐾K^{-} and 1.5%percent1.51.5\% psuperscript𝑝p^{-}, the positive beam of 61%percent6161\% π+superscript𝜋\pi^{+}, 4.4%percent4.44.4\% K+superscript𝐾K^{+}, and 34%percent3434\% p𝑝p. Event-by-event beam particle identification was accomplished through the use of a differential Čerenkov counter[18] and a transition radiation detector[19]. Pre-scaling of triggers was used to enhance the recorded sample of minority-beam-particle interactions.

The apparatus in Fermilab experiment E769 has been previously described (See [20, 21, 22] and references therein.) In this analysis we use the 11 silicon microstrip planes (1 - 30 cm downstream of the target), 35 drift chambers (150 - 1750 cm downstream of the target), 2 multiwire proportional chambers (130 cm, 180 cm downstream of the target), and 2 magnets (centered at 290 cm, 620 cm downstream of the target) for momentum measurement. The two threshold Čerenkov counters downstream of the target were not used and the electromagnetic and hadronic calorimeters were used only for on-line event selection. The trigger required that the total “transverse energy” (i.e., sum of the products of energy observed times the tangent of the angle from the target to each calorimeter segment) be at least 5.5 GeV. Most Λ 0superscriptΛ 0\Lambda^{\,0}’s decay before entering the drift chamber region, but downstream of the end of the silicon vertex detectors.

Throughout this paper, references to a particle should be taken to include its antiparticle except where explicitly stated otherwise. For historical reasons and current availability of data samples, the positive beam and negative beam samples come from rather different event selections. The positive beam Λ 0superscriptΛ 0\Lambda^{\,0}’s were reconstructed from Λ 0superscriptΛ 0\Lambda^{\,0}’s decaying upstream of the silicon vertex detector, while the negative beam sample comes from Λ 0superscriptΛ 0\Lambda^{\,0}’s decaying downstream and reconstructed using tracks which were not seen in the silicon vertex detector. In addition to the resulting differences in selection criteria, there are more Λ 0superscriptΛ 0\Lambda^{\,0} data from the negative beam and consequently larger kinematic ranges are accessible.

All Λ 0superscriptΛ 0\Lambda^{\,0}’s were reconstructed using the pπ𝑝superscript𝜋p\pi^{-} decay mode. Selection criteria were chosen to maximize the signal significance using Monte Carlo simulation for the signal, and using side-band data for background projections. The ratio of proton to pion decay momenta was required to be larger than 3.0. For the positive beams (p, π+superscript𝜋\pi^{+} and K+superscript𝐾K^{+}), proton and πsuperscript𝜋\pi^{-} tracks were required to make a vertex downstream of the last target, but upstream of the silicon detector, and have a distance of closest approach less than 0.02 cm. The resulting Λ 0superscriptΛ 0\Lambda^{\,0} candidate track was then required to have an impact parameter relative to the interaction point of less than 0.006 cm. For the negative beams (πsuperscript𝜋\pi^{-} and Ksuperscript𝐾K^{-}), the proton and πsuperscript𝜋\pi^{-} tracks were required to make a vertex downstream of the silicon detector, but upstream of the first analysis magnet. The tracks had to have a distance of closest approach less than 0.7 cm at the decay vertex, with no requirement on the impact parameter of the lambda candidate track.

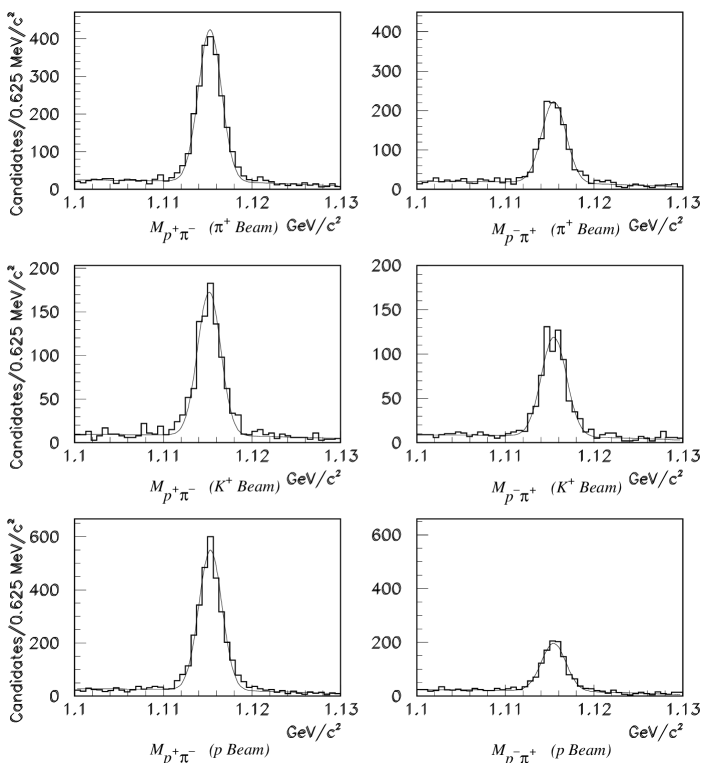
The reconstructed mass distributions for each interval of xFsubscript𝑥𝐹x_{\scriptscriptstyle F} and pT2superscriptsubscript𝑝𝑇2p_{\scriptscriptstyle T}^{2} were fit in the mass range from 1.1011.1011.101 to 1.1271.1271.127 GeV/c2𝐺𝑒𝑉superscript𝑐2GeV/c^{2} using a binned maximum likelihood method with a Gaussian signal plus a linear background. All xFsubscript𝑥𝐹x_{\scriptscriptstyle F} and pT2superscriptsubscript𝑝𝑇2p_{\scriptscriptstyle T}^{2} bin widths are much larger than the resolution of the variable binned. In the fit, the central reconstructed mass values and mass resolutions were fixed to values obtained from Monte Carlo simulation. Monte Carlo simulation studies demonstrated that Ks0π+πsubscriptsuperscript𝐾0𝑠superscript𝜋superscript𝜋K^{0}_{s}\rightarrow\pi^{+}\pi^{-} provided a flat background and produced a negligible effect on the fit numbers of Λ 0superscriptΛ 0\Lambda^{\,0}’s. The total reconstructed mass distributions are shown in Figs. 1 and 2. Table 1 shows the total numbers of Λ 0superscriptΛ 0\Lambda^{\,0} and Λ¯ 0superscript¯Λ 0\overline{\Lambda}^{\,0} from the fits shown.

Refer to caption

Figure 1: Effective pπ𝑝𝜋p\pi mass distributions for the negative beams.

Refer to caption

Figure 2: Effective pπ𝑝𝜋p\pi mass distributions for the positive beams.
Beam Λ 0superscriptΛ 0~{}~{}~{}~{}~{}~{}~{}~{}~{}~{}~{}\Lambda^{\,0} Λ¯ 0superscript¯Λ 0~{}~{}~{}~{}~{}~{}~{}~{}~{}~{}\overline{\Lambda}^{\,0}
π+superscript𝜋\pi^{+} 1,965±491plus-or-minus96549~{}~{}~{}~{}1,965~{}\pm~{}49~{}~{}~{} 1,053±371plus-or-minus05337~{}~{}1,053~{}\pm~{}37~{}~{}~{}
πsuperscript𝜋\pi^{-} 1,537,000±1,8771537plus-or-minus00018771,537,000~{}\pm~{}1,877 996,200±1,712996plus-or-minus2001712996,200~{}\pm~{}1,712
K+ 845±32plus-or-minus84532~{}~{}~{}~{}~{}~{}845~{}\pm~{}32~{}~{}~{} 621±28plus-or-minus62128~{}~{}~{}~{}621~{}\pm~{}28~{}~{}~{}
K- 203,800±660203plus-or-minus800660~{}~{}203,800~{}\pm~{}660~{}~{} 95,300±54895plus-or-minus300548~{}95,300~{}\pm~{}548~{}~{}
p 2,615±562plus-or-minus61556~{}~{}~{}~{}2,615~{}\pm~{}56~{}~{}~{} 919±35plus-or-minus91935~{}~{}~{}~{}919~{}\pm~{}35~{}~{}~{}
Table 1: Total number of Λ 0superscriptΛ 0\Lambda^{\,0} and Λ¯ 0superscript¯Λ 0\overline{\Lambda}^{\,0} observed for each beam. The errors are statistical as determined by the fits.

For each xFsubscript𝑥𝐹x_{\scriptscriptstyle F} and pT2superscriptsubscript𝑝𝑇2p_{\scriptscriptstyle T}^{2} bin we compute an asymmetry, A𝐴A, as defined in Equation 1. Values for the N𝑁N’s were obtained from individual fits to the pπ𝑝𝜋p\pi mass plots for events selected to lie within each xFsubscript𝑥𝐹x_{\scriptscriptstyle F} and pT2superscriptsubscript𝑝𝑇2p_{\scriptscriptstyle T}^{2} interval. For each beam type, the asymmetry A(xF)𝐴subscript𝑥𝐹A(x_{\scriptscriptstyle F}) integrated over pT2superscriptsubscript𝑝𝑇2p_{\scriptscriptstyle T}^{2}, and the asymmetry A(pT2)𝐴superscriptsubscript𝑝𝑇2A(p_{\scriptscriptstyle T}^{2}) integrated over our range of xFsubscript𝑥𝐹x_{\scriptscriptstyle F}, are presented in Figs. 3 and 4. The results are also listed in Tables 2, 3, 4, and 5 along with statistical errors.

The experimental apparatus itself could create an apparent particle-antiparticle asymmetry if there were a difference in the detection efficiencies for Λ 0superscriptΛ 0\Lambda^{\,0} and Λ¯ 0superscript¯Λ 0\overline{\Lambda}^{\,0}. Selection criteria for the particle and antiparticle samples were identical. However, geometrical acceptances and reconstruction efficiencies were not necessarily the same. To evaluate this potential effect, a large sample of simulated events was created using the Pythia/Jetset event generators [25, 26]. These were passed through a detailed simulation of the E769 spectrometer to simulate “data” in digitized format, which was then processed through the same computer reconstruction code as that used for data from the experiment. Simulated event data were subjected to the same selection criteria as used for detector data. No difference was found between the acceptances and efficiencies for Λ 0superscriptΛ 0\Lambda^{\,0} compared to Λ¯ 0superscript¯Λ 0\overline{\Lambda}^{\,0} at a level significant with respect to the statistical errors.

We also looked for systematic effects from the other following sources:

  • Event selection criteria;

  • The minimum transverse energy in the calorimeters required in the on-line event selection;

  • KS contamination of the Λ 0superscriptΛ 0\Lambda^{\,0} signal;

  • Misidentification of beam particle types;

  • Λ 0superscriptΛ 0\Lambda^{\,0} from higher-mass hyperon decays;

  • Mass fits (shape);

All seven sources, the relative efficiencies and the six others listed, were found to produce systematic effects that were negligible in each kinematic bin, both individually and in the ensemble, when compared to the statistical uncertainties.

The behavior of the asymmetries shown in Figs. 3 and 4 have leading particle effects where expected. A larger asymmetry is observed when there is a larger difference in the number of valence quarks in the Λ 0superscriptΛ 0\Lambda^{\,0} or Λ¯ 0superscript¯Λ 0\overline{\Lambda}^{\,0} in common with the target or the various beams. We [23] and others [2, 24] have reported evidence for similar effects in the production of D±superscript𝐷plus-or-minusD^{\pm} mesons in the forward region (xF>0subscript𝑥𝐹0x_{\scriptscriptstyle F}>0).

The Pythia 6.2  [27] model describes only some features of our results, and those only qualitatively, as can be seen in Fig. 3 and Fig. 4. This model predicts small values of asymmetry for xF=0subscript𝑥𝐹0x_{\scriptscriptstyle F}=0 in contrast to our results which have large asymmetries in this region. This may be due to associated production of strange mesons and baryons (more Λ 0K¯superscriptΛ 0¯𝐾\Lambda^{\,0}\overline{K} than Λ¯ 0Ksuperscript¯Λ 0𝐾\overline{\Lambda}^{\,0}K). Leading particle effects play an increasingly important role as |xF|subscript𝑥𝐹\left|x_{\scriptscriptstyle F}\right| increases.

Our results for particle-antiparticle asymmetries are consistent with the results obtained by other experiments where similar data exists [1, 13, 28]. Our results can be described qualitatively in terms of the energy thresholds for the production of hyperons and antihyperons together with their associated particles and a model in which the recombination of valence quarks in the beam and target particles contributes to the hyperon and antihyperon production in an asymmetrical manner [29].

In summary, we report a precise, systematic study of the production asymmetries for ΛΛ\Lambda hyperons by various incident hadrons in a single experiment. The range of xFsubscript𝑥𝐹x_{\scriptscriptstyle F} covered allows the study of asymmetries in regions close to xF=0subscript𝑥𝐹0x_{\scriptscriptstyle F}=0. Our results are consistent with other experiments where similar data exists and while models so far describe some features of our results, they do so only qualitatively.

We gratefully acknowledge the assistance of the staffs of Fermilab and of all the participating institutions. This research was supported by the Brazilian Conselho Nacional de Desenvolvimento Científico e Tecnológico, the U.S. National Science Foundation, the U.S. Department of Energy, and the National Research Council of Canada. Fermilab is operated by the Universities Research Association, Inc., under contract with the United States Department of Energy.

References

  • [1] E. M. Aitala et al.(E791 Collaboration), Phys. Lett. B 496 (2000) 9.
  • [2] E.M. Aitala et al. (E791 Collaboration), Phys. Lett. B 371 (1996) 157.
  • [3] G.A. Alves et al. (E769 Collaboration), Phys. Rev. Lett. 72 (1994) 812 and 72 (1994) 1946.
  • [4] M. Adamovich et al. (WA92 Collaboration), Nucl. Phys. B 495 (1997) 3.
  • [5] E.M. Aitala et al. (E791 Collaboration), Phys. Lett. B 411 (1997) 230.
  • [6] L. G. Pondrom, Phys. Rept. 122 (1985) 57.
  • [7] V.G. Kartvelishvili, A.K. Likhoded, and S.R. Slobospitskii, Sov. J. Nucl. Phys. 33 (1981) 434.
  • [8] R.C. Hwa, Phys. Rev. D 51 (1995) 85.
  • [9] R. Vogt and S.J. Brodsky, Nucl. Phys. B 478 (1996) 311.
  • [10] B.W. Harris, J. Smith, and R. Vogt, Nucl. Phys. B 461 (1996) 181.
  • [11] G. Herrera and J. Magnin, Eur. Phys. J. C 2 (1998) 477.
  • [12] A. Capella, U. Sukhatme, C.I. Tan, and J. Tran Thanh Van, Phys. Rev. D 36 (1987) 109.
  • [13] S. Barlag et al. (ACCMOR Collaboration), Phys. Lett. B 325 (1994) 531.
  • [14] S. Mikocki et al. (E580 Collaboration), Phys. Rev. D 34 (1986) 42.
  • [15] R.T. Edwards et al. (E415 Collaboration), Phys. Rev. D 18 (1978) 76.
  • [16] N.N. Biswas et al. (E002, E281, and E597 Collaborations), Nucl. Phys. B 167 (1980) 41.
  • [17] D. Bogert et al. (E234 Collaboration), Phys. Rev. D 16 (1977) 2098.
  • [18] M. Benot, J. Litt, and R. Meunier, Nucl. Instr. and Meth. 105 (1972) 431.
  • [19] D. Errede et al., Nucl. Instr. and Meth. Phys. Res., Sect A 309 (1991) 386.
  • [20] J. Appel, Annu. Rev. Nucl. Part. Sci. 42 (1992) 367.
  • [21] C. Gay and S. Bracker, IEEE Trans. Nucl. Sci. 34 (1987) 870.
  • [22] G. A. Alves et al. (E769 Collaboration), Phys. Rev. Lett. 69 (1992) 3147.
  • [23] G.A. Alves et al. (E769 Collaboration), Phys. Rev. Lett. 77 (1996) 2388; G.A. Alves et al. (E769 Collaboration), Phys. Rev. Lett. 81 (1998) 1537.
  • [24] M. Adamovich et al. (WA82 Collaboration), Phys. Lett. B 305 (1993) 402.
  • [25] T. Sjöstrand, Pythia 5.7 and Jetset 7.4. Physics and Manual, CERN-TH-7112/93 (1993) hep-ph/9508391.
  • [26] H.U. Bengtsson and T. Sjöstrand, Comput. Phys. Commun. 46 (1987) 43.
  • [27] T. Sjöstrand, L. Lönnblad, S. Mrenna, “PYTHIA 6.2”, hep-ph/0108264, (2001).
  • [28] S. Barlag et al. (ACCMOR Collaboration), Phys. Lett. B 233 (1989) 522.
  • [29] J.C. Anjos, J. Magnin, F.R.A. Simão, and J. Solano, Proceedings of II Silafae, AIP Conf. Proc. 444 (1998) 540, hep-ph/9806396.

Refer to caption

Figure 3: Λ 0superscriptΛ 0\Lambda^{\,0} production asymmetries vs xFsubscript𝑥𝐹x_{F} for various incident beams. The errors shown are statistical, with systematic errors being negligible. The curves are predictions of the Pythia 6.2 model.

Refer to caption

Figure 4: Λ 0superscriptΛ 0\Lambda^{\,0} production asymmetries vs pT2superscriptsubscript𝑝𝑇2p_{\scriptscriptstyle T}^{2} for various incident beams. The errors shown are statistical, with systematic errors being negligible. The curves are predictions of the Pythia 6.2 model. The prediction of Pythia is limited to the range of pT2superscriptsubscript𝑝𝑇2p_{\scriptscriptstyle T}^{2} shown.
Beam xFsubscript𝑥𝐹x_{F} Region Production Asymmetry
0.12xF<0.080.12subscript𝑥𝐹0.08-0.12~{}\leq~{}x_{F}~{}<~{}-0.08 0.446±0.105plus-or-minus0.4460.1050.446~{}\pm~{}0.105
0.08xF<0.040.08subscript𝑥𝐹0.04-0.08~{}\leq~{}x_{F}~{}<~{}-0.04 0.325±0.045plus-or-minus0.3250.0450.325~{}\pm~{}0.045
0.04xF<0.000.04subscript𝑥𝐹0.00-0.04~{}\leq~{}x_{F}~{}<~{}~{}0.00 0.349±0.033plus-or-minus0.3490.0330.349~{}\pm~{}0.033
π+superscript𝜋\pi^{+} 0.00xF<+0.040.00subscript𝑥𝐹0.04~{}0.00~{}\leq~{}x_{F}~{}<~{}+0.04 0.263±0.036plus-or-minus0.2630.0360.263~{}\pm~{}0.036
+0.04xF<+0.080.04subscript𝑥𝐹0.08+0.04~{}\leq~{}x_{F}~{}<~{}+0.08 0.188±0.058plus-or-minus0.1880.0580.188~{}\pm~{}0.058
+0.08xF+0.120.08subscript𝑥𝐹0.12+0.08~{}\leq~{}x_{F}~{}\leq~{}+0.12 0.399±0.132plus-or-minus0.3990.1320.399~{}\pm~{}0.132
0.12xF<0.080.12subscript𝑥𝐹0.08-0.12~{}\leq~{}x_{F}~{}<~{}-0.08 0.516±0.116plus-or-minus0.5160.1160.516~{}\pm~{}0.116
0.08xF<0.040.08subscript𝑥𝐹0.04-0.08~{}\leq~{}x_{F}~{}<~{}-0.04 0.214±0.076plus-or-minus0.2140.0760.214~{}\pm~{}0.076
0.04xF<0.000.04subscript𝑥𝐹0.00-0.04~{}\leq~{}x_{F}~{}<~{}~{}0.00 0.258±0.050plus-or-minus0.2580.0500.258~{}\pm~{}0.050
K+ 0.00xF<+0.040.00subscript𝑥𝐹0.040.00~{}\leq~{}x_{F}~{}<~{}+0.04 0.142±0.054plus-or-minus0.1420.0540.142~{}\pm~{}0.054
+0.04xF<+0.080.04subscript𝑥𝐹0.08+0.04~{}\leq~{}x_{F}~{}<~{}+0.08 0.040±0.090plus-or-minus0.0400.090-0.040~{}\pm~{}0.090
+0.08xF+0.120.08subscript𝑥𝐹0.12+0.08~{}\leq~{}x_{F}~{}\leq~{}+0.12 0.321±0.125plus-or-minus0.3210.125-0.321~{}\pm~{}0.125
0.12xF<0.080.12subscript𝑥𝐹0.08-0.12~{}\leq~{}x_{F}~{}<~{}-0.08 0.556±0.071plus-or-minus0.5560.0710.556~{}\pm~{}0.071
0.08xF<0.040.08subscript𝑥𝐹0.04-0.08~{}\leq~{}x_{F}~{}<~{}-0.04 0.497±0.046plus-or-minus0.4970.0460.497~{}\pm~{}0.046
0.04xF<0.000.04subscript𝑥𝐹0.00-0.04~{}\leq~{}x_{F}~{}<~{}~{}0.00 0.461±0.027plus-or-minus0.4610.0270.461~{}\pm~{}0.027
p+ 0.00xF<+0.040.00subscript𝑥𝐹0.040.00~{}\leq~{}x_{F}~{}<~{}+0.04 0.461±0.032plus-or-minus0.4610.0320.461~{}\pm~{}0.032
+0.04xF<+0.080.04subscript𝑥𝐹0.08+0.04~{}\leq~{}x_{F}~{}<~{}+0.08 0.556±0.053plus-or-minus0.5560.0530.556~{}\pm~{}0.053
+0.08xF+0.120.08subscript𝑥𝐹0.12+0.08~{}\leq~{}x_{F}~{}\leq~{}+0.12 0.601±0.089plus-or-minus0.6010.0890.601~{}\pm~{}0.089
Table 2: Λ 0superscriptΛ 0\Lambda^{\,0} production asymmetries vs xFsubscript𝑥𝐹x_{F} for positive beams. The errors shown are statistical, with systematic errors being negligible.
Beam pT2superscriptsubscript𝑝𝑇2{p_{T}}^{2} Region Production Asymmetry
0.00<pT20.100.00superscriptsubscript𝑝𝑇20.100.00<{{p_{T}}^{2}}\leq 0.10 0.224±0.051plus-or-minus0.2240.051~{}0.224~{}\pm~{}0.051
0.10<pT20.260.10superscriptsubscript𝑝𝑇20.260.10<{{p_{T}}^{2}}\leq 0.26 0.255±0.039plus-or-minus0.2550.039~{}0.255~{}\pm~{}0.039
0.26<pT20.500.26superscriptsubscript𝑝𝑇20.500.26<{{p_{T}}^{2}}\leq 0.50 0.387±0.039plus-or-minus0.3870.039~{}0.387~{}\pm~{}0.039
π+superscript𝜋\pi^{+} 0.50<pT20.800.50superscriptsubscript𝑝𝑇20.800.50<{{p_{T}}^{2}}\leq 0.80 0.279±0.046plus-or-minus0.2790.046~{}0.279~{}\pm~{}0.046
0.80<pT21.200.80superscriptsubscript𝑝𝑇21.200.80<{{p_{T}}^{2}}\leq 1.20 0.350±0.059plus-or-minus0.3500.059~{}0.350~{}\pm~{}0.059
1.20<pT22.001.20superscriptsubscript𝑝𝑇22.001.20<{{p_{T}}^{2}}\leq 2.00 0.367±0.074plus-or-minus0.3670.074~{}0.367~{}\pm~{}0.074
2.00<pT23.002.00superscriptsubscript𝑝𝑇23.002.00<{{p_{T}}^{2}}\leq 3.00 0.318±0.161plus-or-minus0.3180.161~{}0.318~{}\pm~{}0.161
0.00<pT20.100.00superscriptsubscript𝑝𝑇20.100.00<{{p_{T}}^{2}}\leq 0.10 0.261±0.079plus-or-minus0.2610.079~{}0.261~{}\pm~{}0.079
0.10<pT20.260.10superscriptsubscript𝑝𝑇20.260.10<{{p_{T}}^{2}}\leq 0.26 0.144±0.056plus-or-minus0.1440.056~{}0.144~{}\pm~{}0.056
0.26<pT20.500.26superscriptsubscript𝑝𝑇20.500.26<{{p_{T}}^{2}}\leq 0.50 0.160±0.059plus-or-minus0.1600.059~{}0.160~{}\pm~{}0.059
0.50<pT20.800.50superscriptsubscript𝑝𝑇20.800.50<{{p_{T}}^{2}}\leq 0.80 0.173±0.077plus-or-minus0.1730.077~{}0.173~{}\pm~{}0.077
K+ 0.80<pT21.200.80superscriptsubscript𝑝𝑇21.200.80<{{p_{T}}^{2}}\leq 1.20 0.023±0.099plus-or-minus0.0230.099~{}0.023~{}\pm~{}0.099
1.20<pT22.001.20superscriptsubscript𝑝𝑇22.001.20<{{p_{T}}^{2}}\leq 2.00 0.031±0.134plus-or-minus0.0310.134-0.031~{}\pm~{}0.134
2.00<pT23.002.00superscriptsubscript𝑝𝑇23.002.00<{{p_{T}}^{2}}\leq 3.00 0.168±0.211plus-or-minus0.1680.211~{}0.168~{}\pm~{}0.211
0.00<pT20.100.00superscriptsubscript𝑝𝑇20.100.00<{{p_{T}}^{2}}\leq 0.10 0.465±0.042plus-or-minus0.4650.042~{}0.465~{}\pm~{}0.042
0.10<pT20.260.10superscriptsubscript𝑝𝑇20.260.10<{{p_{T}}^{2}}\leq 0.26 0.476±0.034plus-or-minus0.4760.034~{}0.476~{}\pm~{}0.034
0.26<pT20.500.26superscriptsubscript𝑝𝑇20.500.26<{{p_{T}}^{2}}\leq 0.50 0.466±0.033plus-or-minus0.4660.033~{}0.466~{}\pm~{}0.033
0.50<pT20.800.50superscriptsubscript𝑝𝑇20.800.50<{{p_{T}}^{2}}\leq 0.80 0.509±0.043plus-or-minus0.5090.043~{}0.509~{}\pm~{}0.043
p+ 0.80<pT21.200.80superscriptsubscript𝑝𝑇21.200.80<{{p_{T}}^{2}}\leq 1.20 0.434±0.054plus-or-minus0.4340.054~{}0.434~{}\pm~{}0.054
1.20<pT22.001.20superscriptsubscript𝑝𝑇22.001.20<{{p_{T}}^{2}}\leq 2.00 0.586±0.069plus-or-minus0.5860.069~{}0.586~{}\pm~{}0.069
2.00<pT23.002.00superscriptsubscript𝑝𝑇23.002.00<{{p_{T}}^{2}}\leq 3.00 0.603±0.144plus-or-minus0.6030.144~{}0.603~{}\pm~{}0.144
Table 3: Λ 0superscriptΛ 0\Lambda^{\,0} production asymmetries vs pT2superscriptsubscript𝑝𝑇2{p_{T}}^{2} for positive beams. The errors shown are statistical, with systematic errors being negligible.
Beam xFsubscript𝑥𝐹x_{F} region Production Asymmetry
0.16xF<0.120.16subscript𝑥𝐹0.12-0.16~{}\leq~{}x_{F}~{}<~{}-0.12 0.393±0.009plus-or-minus0.3930.0090.393~{}\pm~{}0.009
0.12xF<0.080.12subscript𝑥𝐹0.08-0.12~{}\leq~{}x_{F}~{}<~{}-0.08 0.400±0.005plus-or-minus0.4000.0050.400~{}\pm~{}0.005
0.08xF<0.040.08subscript𝑥𝐹0.04-0.08~{}\leq~{}x_{F}~{}<~{}-0.04 0.316±0.003plus-or-minus0.3160.0030.316~{}\pm~{}0.003
0.04xF<0.000.04subscript𝑥𝐹0.00-0.04~{}\leq~{}x_{F}~{}<~{}~{}0.00 0.256±0.002plus-or-minus0.2560.0020.256~{}\pm~{}0.002
0.00xF<+0.040.00subscript𝑥𝐹0.04~{}0.00~{}\leq~{}x_{F}~{}<~{}+0.04 0.197±0.002plus-or-minus0.1970.0020.197~{}\pm~{}0.002
πsuperscript𝜋\pi^{-} +0.04xF<+0.080.04subscript𝑥𝐹0.08+0.04~{}\leq~{}x_{F}~{}<~{}+0.08 0.146±0.002plus-or-minus0.1460.0020.146~{}\pm~{}0.002
+0.08xF<+0.120.08subscript𝑥𝐹0.12+0.08~{}\leq~{}x_{F}~{}<~{}+0.12 0.105±0.002plus-or-minus0.1050.0020.105~{}\pm~{}0.002
+0.12xF<+0.160.12subscript𝑥𝐹0.16+0.12~{}\leq~{}x_{F}~{}<~{}+0.16 0.085±0.003plus-or-minus0.0850.0030.085~{}\pm~{}0.003
+0.16xF<+0.200.16subscript𝑥𝐹0.20+0.16~{}\leq~{}x_{F}~{}<~{}+0.20 0.083±0.005plus-or-minus0.0830.0050.083~{}\pm~{}0.005
+0.20xF<+0.300.20subscript𝑥𝐹0.30+0.20~{}\leq~{}x_{F}~{}<~{}+0.30 0.081±0.005plus-or-minus0.0810.0050.081~{}\pm~{}0.005
+0.30xF+0.400.30subscript𝑥𝐹0.40+0.30~{}\leq~{}x_{F}~{}\leq~{}+0.40 0.095±0.013plus-or-minus0.0950.0130.095~{}\pm~{}0.013
0.16xF<0.120.16subscript𝑥𝐹0.12-0.16~{}\leq~{}x_{F}~{}<~{}-0.12 0.458±0.027plus-or-minus0.4580.0270.458~{}\pm~{}0.027
0.12xF<0.080.12subscript𝑥𝐹0.08-0.12~{}\leq~{}x_{F}~{}<~{}-0.08 0.408±0.014plus-or-minus0.4080.0140.408~{}\pm~{}0.014
0.08xF<0.040.08subscript𝑥𝐹0.04-0.08~{}\leq~{}x_{F}~{}<~{}-0.04 0.395±0.007plus-or-minus0.3950.0070.395~{}\pm~{}0.007
0.04xF<0.000.04subscript𝑥𝐹0.00-0.04~{}\leq~{}x_{F}~{}<~{}~{}0.00 0.320±0.006plus-or-minus0.3200.0060.320~{}\pm~{}0.006
0.00xF<+0.040.00subscript𝑥𝐹0.04~{}0.00~{}\leq~{}x_{F}~{}<~{}+0.04 0.314±0.005plus-or-minus0.3140.0050.314~{}\pm~{}0.005
K- +0.04xF<+0.080.04subscript𝑥𝐹0.08+0.04~{}\leq~{}x_{F}~{}<~{}+0.08 0.312±0.006plus-or-minus0.3120.0060.312~{}\pm~{}0.006
+0.08xF<+0.120.08subscript𝑥𝐹0.12+0.08~{}\leq~{}x_{F}~{}<~{}+0.12 0.335±0.007plus-or-minus0.3350.0070.335~{}\pm~{}0.007
+0.12xF<+0.160.12subscript𝑥𝐹0.16+0.12~{}\leq~{}x_{F}~{}<~{}+0.16 0.402±0.009plus-or-minus0.4020.0090.402~{}\pm~{}0.009
+0.16xF<+0.200.16subscript𝑥𝐹0.20+0.16~{}\leq~{}x_{F}~{}<~{}+0.20 0.479±0.012plus-or-minus0.4790.0120.479~{}\pm~{}0.012
+0.20xF<+0.300.20subscript𝑥𝐹0.30+0.20~{}\leq~{}x_{F}~{}<~{}+0.30 0.563±0.011plus-or-minus0.5630.0110.563~{}\pm~{}0.011
+0.30xF+0.400.30subscript𝑥𝐹0.40+0.30~{}\leq~{}x_{F}~{}\leq~{}+0.40 0.749±0.025plus-or-minus0.7490.0250.749~{}\pm~{}0.025
Table 4: Λ 0superscriptΛ 0\Lambda^{\,0} production asymmetries vs xFsubscript𝑥𝐹x_{F} for negative beams. The errors shown are statistical, with systematic errors being negligible.
Beam pT2superscriptsubscript𝑝𝑇2{p_{T}}^{2} Region Production Asymmetry
0.00<pT20.100.00superscriptsubscript𝑝𝑇20.100.00<{{p_{T}}^{2}}\leq 0.10 0.198±0.004plus-or-minus0.1980.0040.198~{}\pm~{}0.004
0.10<pT20.260.10superscriptsubscript𝑝𝑇20.260.10<{{p_{T}}^{2}}\leq 0.26 0.195±0.003plus-or-minus0.1950.0030.195~{}\pm~{}0.003
0.26<pT20.500.26superscriptsubscript𝑝𝑇20.500.26<{{p_{T}}^{2}}\leq 0.50 0.196±0.003plus-or-minus0.1960.0030.196~{}\pm~{}0.003
0.50<pT20.800.50superscriptsubscript𝑝𝑇20.800.50<{{p_{T}}^{2}}\leq 0.80 0.204±0.003plus-or-minus0.2040.0030.204~{}\pm~{}0.003
0.80<pT21.200.80superscriptsubscript𝑝𝑇21.200.80<{{p_{T}}^{2}}\leq 1.20 0.225±0.004plus-or-minus0.2250.0040.225~{}\pm~{}0.004
πsuperscript𝜋\pi^{-} 1.20<pT22.001.20superscriptsubscript𝑝𝑇22.001.20<{{p_{T}}^{2}}\leq 2.00 0.245±0.005plus-or-minus0.2450.0050.245~{}\pm~{}0.005
2.00<pT23.002.00superscriptsubscript𝑝𝑇23.002.00<{{p_{T}}^{2}}\leq 3.00 0.266±0.008plus-or-minus0.2660.0080.266~{}\pm~{}0.008
3.00<pT24.003.00superscriptsubscript𝑝𝑇24.003.00<{{p_{T}}^{2}}\leq 4.00 0.306±0.014plus-or-minus0.3060.0140.306~{}\pm~{}0.014
4.00<pT26.004.00superscriptsubscript𝑝𝑇26.004.00<{{p_{T}}^{2}}\leq 6.00 0.302±0.022plus-or-minus0.3020.0220.302~{}\pm~{}0.022
6.00<pT210.06.00superscriptsubscript𝑝𝑇210.06.00<{{p_{T}}^{2}}\leq 10.0 0.356±0.048plus-or-minus0.3560.0480.356~{}\pm~{}0.048
0.00<pT20.100.00superscriptsubscript𝑝𝑇20.100.00<{{p_{T}}^{2}}\leq 0.10 0.336±0.012plus-or-minus0.3360.0120.336~{}\pm~{}0.012
0.10<pT20.260.10superscriptsubscript𝑝𝑇20.260.10<{{p_{T}}^{2}}\leq 0.26 0.317±0.009plus-or-minus0.3170.0090.317~{}\pm~{}0.009
0.26<pT20.500.26superscriptsubscript𝑝𝑇20.500.26<{{p_{T}}^{2}}\leq 0.50 0.352±0.008plus-or-minus0.3520.0080.352~{}\pm~{}0.008
0.50<pT20.800.50superscriptsubscript𝑝𝑇20.800.50<{{p_{T}}^{2}}\leq 0.80 0.388±0.009plus-or-minus0.3880.0090.388~{}\pm~{}0.009
0.80<pT21.200.80superscriptsubscript𝑝𝑇21.200.80<{{p_{T}}^{2}}\leq 1.20 0.404±0.010plus-or-minus0.4040.0100.404~{}\pm~{}0.010
K- 1.20<pT22.001.20superscriptsubscript𝑝𝑇22.001.20<{{p_{T}}^{2}}\leq 2.00 0.406±0.012plus-or-minus0.4060.0120.406~{}\pm~{}0.012
2.00<pT23.002.00superscriptsubscript𝑝𝑇23.002.00<{{p_{T}}^{2}}\leq 3.00 0.436±0.019plus-or-minus0.4360.0190.436~{}\pm~{}0.019
3.00<pT24.003.00superscriptsubscript𝑝𝑇24.003.00<{{p_{T}}^{2}}\leq 4.00 0.459±0.033plus-or-minus0.4590.0330.459~{}\pm~{}0.033
4.00<pT26.004.00superscriptsubscript𝑝𝑇26.004.00<{{p_{T}}^{2}}\leq 6.00 0.592±0.055plus-or-minus0.5920.0550.592~{}\pm~{}0.055
6.00<pT210.06.00superscriptsubscript𝑝𝑇210.06.00<{{p_{T}}^{2}}\leq 10.0 0.540±0.160plus-or-minus0.5400.1600.540~{}\pm~{}0.160
Table 5: Λ 0superscriptΛ 0\Lambda^{\,0} production asymmetries vs pT2superscriptsubscript𝑝𝑇2{p_{T}}^{2} for negative beams. The errors shown are statistical, with systematic errors being negligible.