Multianode Photo Multiplier Tubes as Photo Detectors for Ring Imaging Cherenkov Detectors
Abstract
The 64-channel Multianode Photo Multiplier (MaPMT) has been evaluated as a candidate for the LHCb Ring Imaging Cherenkov (RICH) photo detectors. We present result from data taken with a 3x3 array of closely packed MaPMTs mounted onto the RICH 1 prototype vessel, exposed to charged particle beams at CERN, and read out at LHC speed. Using a LED light source, we have performed spatial light scans to study the light collection efficiency of the MaPMTs We have also measured the performance of the MaPMTs as a function of the applied high voltage. Different dynode resistor chains have been used to study the tubes at low gains. In addition, we have studied the behaviour of the MaPMT in magnetic fields.
1 Introduction
We have evaluated the 64-channel Multianode Photo Multiplier (MaPMT) as a candidate photo detector for the LHCb Ring Imaging Cherenkov (RICH) counters. The MaPMT contains a 8x8 array of 64 dynode chains enclosed in a single vacuum envelope. The window is made of UV glass instead of borosilicate which extends the transparency down to 200 nm. According to the manufacturer, the bi-alkali photo cathode has a quantum efficiency of 22% at a wavelength of 380 nm. The pitch between anode pixels is 2.3 mm. When accounting for the inactive 0.2 mm gaps between pixels, the MaPMT has an active area coverage of only 38%. The full angular coverage with 85% active area can be restored by mounting a fused silica lens with one flat and one spherical surface with a radius of curvature of 25 mm in front of the tube. The lens has a demagnification factor of about two-third and focuses the incoming photons onto the sensitive area of the MaPMT.
2 Test Beam Results
The sensitivity of the MaPMT to Cherenkov photons has been tested with particle beams of 120 GeV/c pions at the SPS accelerator at CERN. A detailed account of these tests is described in reference [1]. Here we present the main results. A 3x3 cluster of closely packed MaPMTs has been mounted onto a prototype of the RICH 1 detector for the LHCb experiment. The radiator gas was CF4 at a pressure of 700 mbar and the photo cathode was set at -1000 V. To demonstrate that the MaPMTs will work at the LHC the data were recorded with the APVm chip running at 40 MHz.
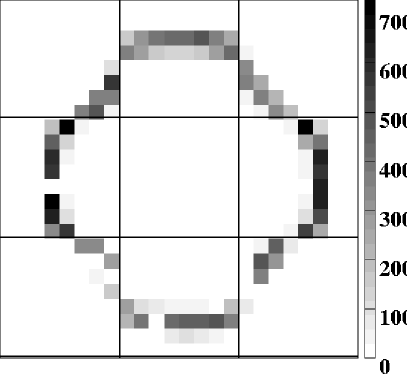
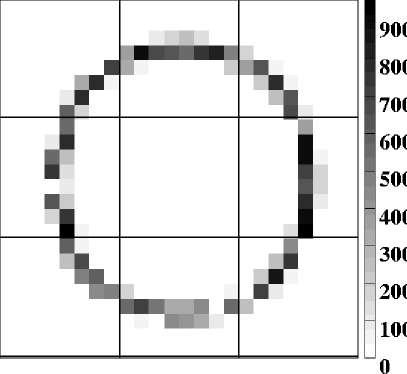
In Figure 1 we show the results for two runs of 6000 events each, one with and one without the lenses mounted in front of the MaPMTs. In both cases, a ring of Cherenkov photons is clearly visible. The ratio of yields with and without lenses is 1.55 as is expected from a simulation. With the lenses the full Cherenkov ring is captured which demonstrates that MaPMTs can be closely packed to restore full geometrical acceptance. We observe photo electrons per event, in very good agreement with the simulation. The corresponding figure of merit for a RICH detector is .
In Figure 2 we show the pulse height spectrum for a single pixel. The data were corrected as follows. A common-mode baseline has been subtracted and signals due to cross-talk stemming from the read-out electronics have been removed. We clearly distinguish between the pedestal peak and the signal containing mainly one photo electron. Overlaid is a fit where is the mean number of photo electrons.
3 LED Scans, Signal Shape, Low Gains
We have also studied the performance of MaPMTs in the laboratory. As a light source we used a blue LED coupled to a mono-mode fibre which could be moved with respect to the MaPMT by semi-automated optical stages. Two read-out systems were employed. One is the 40 MHz read-out with the APVm chip also used for the beam tests, and another one is based on CAMAC amplifiers and ADCs.
In addition to the nine tubes studied with test beams we obtained two more MaPMTs which, according to the manufacturer, have an increased quantum efficiency of maximum 25 - 27% at 360 nm. The focusing of these new tubes has been improved. Firstly, the acceptance at the outside edges of the active area of the MaPMT has been increased, and another focusing wire has been added. Secondly, the distance between the focusing grid and the entry slits to the dynode chain has been reduced. We have studied these new MaPMTs with a LED light scan. The data have been taken by moving the light source in steps of 0.1 mm along the front face of the MaPMT, with the photocathode at -900 V.

The pulse height spectra have been fit with a Gaussian curve as single photo electron signal shape. Shown in Figure 3 are the average single photon pulse height, , and , the mean number of measured photo electrons as a function of the relative position along the tube. The gain is proportional to and the collection efficiency is closely related to . We observe that the edge pixels have a larger acceptance for the new MaPMT (solid histograms) with respect to the standard focusing tube (dashed histograms). Due to the improved focusing, both the gain and the collection efficiency are more homogeneous.
Most front-end chips developed for the LHC have been optimised for signals from Silicon sensors or micro-strip gas chambers with a charge of 26000 - 40000 . At a voltage of 800 V between anode and photocathode the gain of the MaPMT is around 300000 which is about 10 times higher. To make use of one of these front-end chips for the the MaPMT a gain adaptation is needed. The preferred solution is to modify a preamplifier to a lower gain. A second possibility is to make use of an attenuator network. This has been used for the APVm read-out by means of an AC coupler. However this approach suffers from cross talk problems. A third way that we have investigated is the feasibility to run the MaPMTs at a lower gain.
To reduce the gain of the MaPMT we have changed the values of the resistors between the photo cathode, the first, second and the third dynode, respectively. The basic idea is to keep the gain at the first dynode while lowering the overall gain. The values for the default, a medium and a low gain option are given in Table 1.
| Dynode | 1 | 2 | 3 | 4 | 5 | 6 | 7 | 8 | 9 | 10 | 11 | 12 | Anode |
|---|---|---|---|---|---|---|---|---|---|---|---|---|---|
| Standard gain | 3 | 2 | 2 | 1 | 1 | 1 | 1 | 1 | 1 | 1 | 1 | 2 | 5 |
| Medium gain | 4 | 2 | 2 | 1 | 1 | 1 | 1 | 1 | 1 | 1 | 1 | 2 | 5 |
| Low gain | 4 | 3 | 3 | 1 | 1 | 1 | 1 | 1 | 1 | 1 | 1 | 2 | 5 |
The signal width is mainly due to the Poisson distribution for multiplication at the first dynode and can be estimated as where is the Gaussian width of the single photon signal. Using the CAMAC read-out we have measured the overall gain of the MaPMT for a center and a border pixel as a function of the high voltage for the three different resistor chains.


In Figure 4 top) we plot as a function of the applied high voltage for the three different resistor chains. At a given voltage the gain of the MaPMT reduces by a factor of four for the low gain option. In the bottom plot we plot as a function of . As expected we observe that increases with . However there are no differences between the different resistor chains. We have repeated these measurements with the APVm read-out and the results agree.
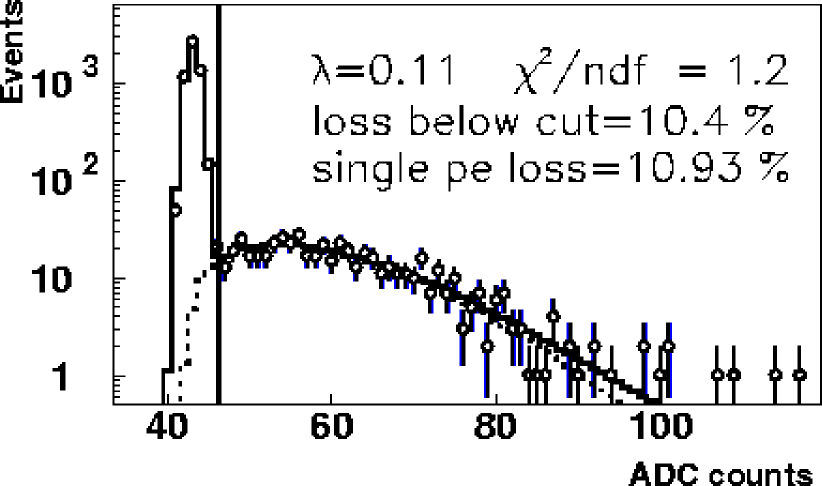
We have studied the loss of signal below the threshold cut of where is the Gaussian width of the pedestal peak. We have employed different fit methods. Besides a Gaussian signal shape we have implemented a fit which uses a Poisson distribution for the first two photo electrons [2]. This method also allows for photons which pass through the photo cathode to be converted into photo electrons at the first dynode.

A Gaussian or a Poisson fit to the pulse height spectra are inadequate to describe the region of small signals close to the pedestal. In Figure 5 we show a pulse height spectra recorded with the CAMAC read-out and the photo cathode at -900 V. The superimposed fit (dotted line) allows for photo electrons to be produced at the first dynode. This fit still does not follow the data points correctly for small signals. There is a broad additional contribution of small pulse heights, but no evidence for a second peak in the data. Including a contribution due to production of photo electrons at the first dynode improves the description of the data. However, the fit improves the overall description of the data and, for the spectrum shown above, yields a gain at the first dynode of which is in agreement with expectations whereas the Gaussian and Poisson fit give and , respectively. The parameter is independent of the fit method. Due to gain variations for pixels within a tube the loss of signal below the threshold varies from pixel to pixel. Using the Poisson fit including the “1st dynode” effect gives the most reliable results. The average signal loss of the 64 pixels of an MaPMT is 13%. We have also measured that the signal loss below threshold scales with . Consequently, running at lower gains increases this loss.
4 Beetle Chip Studies
The APVm read-out is not compatible with the LHCb architecture. A possible candidate to read out the MaPMT is the Beetle chip. It can be run in analogue and binary mode. The binary mode has several advantages, as it ties in better with the Pixel HPD development for LHCb, described in reference [3], which also has a binary read-out, and for which a design of the Off-Detector Electronics (ODE) is underway. In addition there would be substantial cost savings.
A program has been undertaken to develop a Beetle adaptation to the MaPMT. By adding a charge and a voltage attenuator at the input of the preamplifier we have lowered the gain of the Beetle chip. Test structures have been produced and studied for this design. For the charge attenuator, measurements with a test charge agree very well with the simulation. The dynamic range of the preamplifier is 10 photo electrons. This preamplifier has been mounted onto a MaPMT and a pulse height spectrum from an LED light source has been measured. The signal from mostly single photo electrons is nicely separated from the pedestal. In this approach the load capacitance affects the gain which would require to keep the input capacitances of all channels within a few pF.
5 Magnetic Field Studies
A consequence of the optimisation of the LHCb spectrometer [3] is that now the RICH 1 photo detectors will be placed in a region where the magnetic field strength is about 40 mT. We have studied the sensitivity of the MaPMT to longitudinal and transverse magnetic fields up to mT. A set-up with 4 LEDs has been built to allow for a diffuse illumination of the MaPMT. The APVm read-out system was used.
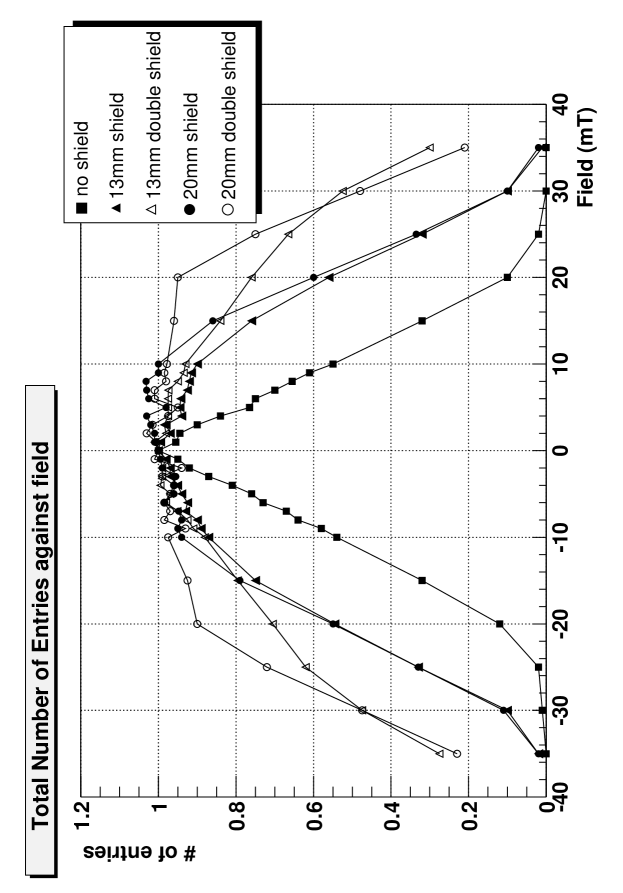
We observe that the gain and the collection efficiency of a MaPMT decreases with increasing field. At mT, this effect is already sizable for the two edge rows of the tube. Averaged for all pixels of a tube the number of measured photo electrons for mT is below 90% of that measured at 0 mT. The MaPMT can be shielded by enclosing it laterally with a -metal case. This shielding should extend beyond the photo cathode of the tube. In Figure 6 we show the measured number of photo electrons for all pixels of a MaPMT relative to its value at 0 mT for the following set-ups: No shielding, 0.9 mm thick shielding extending by 13 mm and 20 mm, and 1.8 mm thick shielding extending by 13 mm and 20 mm. We observe that the shielding of the tube is effective. Already for the single 0.9 mm thick shielding the MaPMT functions in longitudinal magnetic fields up to 10 mT.
We have also studied the behaviour of the MaPMT in transverse fields. These measurements show that the MaPMT is insensitive to transverse magnetic fields up to 25 mT.
6 Conclusions
Using particle beams at the SPS at CERN we have successfully tested a 3x3 array of multianode photomultiplier tubes. We have demonstrated that by means of lenses mounted in front of the closely packed MaPMTs the Cherenkov photons are focused onto the sensitive area of the devices. Using a laboratory with LED light sources we have studied the performance and the signal shape of the MaPMTs in detail. A change in the focusing of the photo electrons onto the first dynode improved the homogeneity of the gain and of the light collection. The gain and width of the signal as well the signal loss have been measured for voltages between and V. We have demonstrated that running the MaPMT at lower gains significantly increases the signal loss below threshold. Finally, we have evaluated the sensitivity of the MaPMT to longitudinal and transverse magnetic fields up to 35 mT.
7 Acknowledgements
I thank Reinhardt Chamonal, Stephan Eisenhardt, and Dave Websdale for the help in preparing this talk. This workshop was dedicated to the memory of Tom Ypsilantis whom I had the privilege to work with.
References
- [1] E. Albrecht et al., Nucl. Instrum. Meth. A 488, (2002) 110-130.
- [2] I. Chirikov-Zorn et al., Nucl. Instrum. Meth. A 456, (2001) 310-324.
- [3] S. Easo, contribution to these proceedings.