Production Asymmetry of from 600 GeV/c and beam
Abstract
The production of relative to as a function of with 600 GeV/c beam is measured in the interval by the SELEX (E781) experiment at Fermilab. The integrated charge asymmetries with 600 GeV/c beam () and beam () are also compared. The results show the beam fragments play a role in the production of , as suggested by the leading quark model.
(SELEX Collaboration)
, , , , , , , , , , , , , , , , , , , , , , , , , , , , , , , , , , , , , , , , , , , , , , , , , , , , , , , , , , , , , , , , , , , , , , , , , , , , , , , , , , , , , , , , , , , , , , , , , , , , , , , , ††thanks: deceased ††thanks: Present address: Infinion, München, Germany ††thanks: Present address: Imperial College, London SW7 2BZ, U.K. ††thanks: Present address: Instituto de Física da Universidade Estadual de Campinas, UNICAMP, SP, Brazil ††thanks: Present address: Kafkas University, Kars, Turkey ††thanks: Present address: Physik-Department, Technische Universität München, 85748 Garching, Germany ††thanks: Present address: The Boston Consulting Group, München, Germany ††thanks: Present address: Instituto de Física Teórica da Universidade Estadual Paulista, São Paulo, Brazil ††thanks: Present address: Lucent Technologies, Naperville, IL ††thanks: Present address: SPSS Inc., Chicago, IL ††thanks: Present address: University of Alabama at Birmingham, Birmingham, AL 35294 ††thanks: Present address: DOE, Germantown, MD ††thanks: Present address: Solidum, Ottawa, Ontario, Canada ††thanks: Present address: Siemens Medizintechnik, Erlangen, Germany ††thanks: Present address: Deutsche Bank AG, Eschborn, Germany
1 Introduction
Perturbative Quantum Chromodynamics calculations in leading or next-to-leading order predict very small or no asymmetry in the or distributions for charm and anticharm production[1, 2]. However, fixed target data show some asymmetry between the production of some charm and anticharm hadrons in hadron-hadron interactions[3, 4]. SELEX has shown strong, beam-dependent asymmetries in production[5]. This experiment finds that production from a beam (but not a beam) also has a large production asymmetry. This asymmetry could be due to the fact that the beam hadron shares a quark with one of the charge states (hence leading particle) and not with the other charge state (non-leading). This is sometimes called “the leading particle effect.”
For a () beam the () shares an quark with the beam hadron and is a leading particle, whereas is not. For a () beam, neither nor is leading. Several theoretical models have been proposed to explain charm hadroproduction in the framework of non-perturbative hadronization. Among the proposed models are the color-drag string model[6], which is pronounced at high and is independent of , and the intrinsic charm model[7], which manifests itself at low and larger .
2 Apparatus
Data were taken during the 1996-97 fixed target run at Fermilab. The 600 GeV/c negative hadron beam used in this measurement was composed of approximately 50% and 50% . Beam particles were tagged with a transition radiation detector system located upstream of the charm production target.
A segmented target consisting of two copper sheets and three diamond sheets, each spaced by 1.5 cm, was used to produce charm particles. The total target thickness was of an interaction length for protons.
The SELEX experiment used a three-stage spectrometer designed for large acceptance at and for detecting the decay of charm particles. Each stage included a bending magnet and a detector system.
SELEX used an online trigger to identify charm particles. The hardware trigger required at least 4 charged hadrons in the forward 150 mrad cone and 2 hits from positive track candidates in a hodoscope after second magnet (M2). The software trigger made a full vertex reconstruction of the beam track and all tracks in the M2 spectrometer. Trigger conditions were also included in the simulation.
The RICH detector, located after the second spectrometer system, was filled with neon gas at room temperature and 1.05 atm pressure. It identified charged hadrons whose trajectories went through the fiducial volume, typically requiring 23 GeV/c[8]. Full reconstruction of the secondary vertex was provided by linking RICH-identified tracks back through the second stage magnetic spectrometer to the vertex silicon detector and associating them at a common decay vertex downstream of the primary interaction vertex.
3 Data Analysis
Initial data selection required two kaons to be identified by the RICH (ratio of the likelihoods: ) and the primary vertex to be in a target sheet.
The criteria used to select candidates included the following cuts:
i) Secondary vertex separation significance where is the longitudinal separation between primary and secondary vertex and is the error on .
ii) Secondary vertex was at least 100 microns outside of the target material.
iii) Each secondary track was extrapolated back to primary vertex -position to evaluate the transverse miss distance . The second largest miss distance had to have , where is the error on .
These cuts were chosen to reject as many background events as possible without losing too much signal. They were optimized using real background and simulated signal events by maximizing the so-called significance: where was the yield from a Monte Carlo data set. The numbers of signal () and background () events inside the square root were taken from data (all the events within the mass interval of 50 MeV/ centered at mass value). The cuts are identical for the charge conjugate modes. None of the results presented here is sensitive to this optimization procedure.
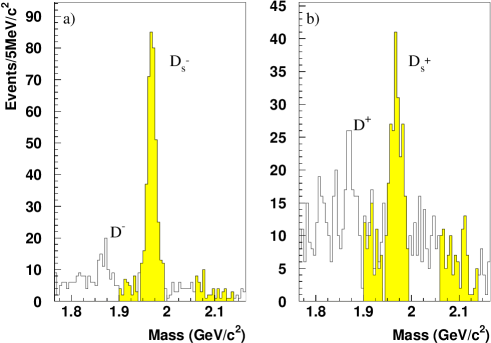
Since the RICH detector does not separate particles with absolute certainty, we expect some small amount of misidentification between pion and kaon that causes a reflection of under the peak (Detailed work on the contamination has been reported in Ref [9] measurement of lifetime). Only resonant ( , ) channels were considered for this analysis to reduce the contribution of these reflections significantly. charm meson decays to were selected by starting with candidate decays. The invariant mass for two well-reconstructed oppositely charged tracks, identified as kaons by RICH, was calculated. candidates were those pairs whose invariant mass was within 10 MeV/c2 of the mass (1020 MeV/c2). Similarly, those combinations that include a pair with an invariant mass value within 35 MeV/c2 of mass (892 MeV/c2) were selected as decays. We have obtained 17214 and 548 in channel and 17414 and 7112 in channel for 0.15 with the beam.
With the above cuts the peaks are clearly evident in the invariant mass spectra of and (Figure 1). This figure also shows Cabbibo-suppressed peaks. There is a clear excess of over as seen in the figure.
4 Production Asymmetry and Analysis
Determining the yields through fitting the mass histograms for a specific value by a Monte-Carlo generated shape is often inaccurate for small statistics and fluctuating backgrounds. In SELEX the yield at a specific value was estimated using a sideband subtraction method assuming a linear background. The mass ranges of the sideband background windows were [1.900 GeV/, 1.940 GeV/] and [2.060 GeV/, 2.140 GeV/]. We defined asymmetric sidebands to avoid the influence of and to exclude the D*(2010) mass region.
The yields after sideband subtraction were corrected for the acceptance (reconstruction efficiency and geometrical acceptance) of the detector. To estimate the acceptance, events were generated by a Monte Carlo program with a flat distribution in and a Gaussian-distributed transverse momentum with mean =0.8 GeV/c. In a given simulation data set the decays only into the or mode. Decay tracks were digitized after smearing with detector resolution and multiple Coulomb scattering effects. The detector hits were OR’ed into the hit banks of interaction data. The new hit banks were passed through the SELEX off-line software. The acceptance was measured using the ratio of the reconstructed events to the embedded events. The set of cuts that was used to extract the signal was applied in this case as well. The most important issue for the asymmetry measurement was the relative efficiency of and .

As indicated in Figure 2, the average difference in acceptance between and is very small over all range compared to the statistical uncertainty. This shows that the spectrometer is charge independent for decay events. In figure only the acceptance for channel is shown. The acceptance for channel is slightly lower. The acceptance in is independent of .
5 Results
After all the cuts and acceptance corrections, the resulting yields as functions of are shown in Figure 3 and listed in Table 1. Resulting data points are fit to a functional form . The values of obtained from the fits are shown on the figure.

Since the beam flux was the same for , the two distributions compare the relative production differential cross-sections for these states. Figure 3 shows that, for the beam used in this measurement, production is favored over at all , and the difference increases at large .
We can discuss this difference in terms of an asymmetry parameter , defined as
| (1) |
where and are the corrected yields for and , respectively. The asymmetry was calculated for five equally divided bins over an range of 0.15 to 0.40 and for three equally divided bins over an range of 0.40 to 0.70. Figure 4 displays the acceptance-corrected asymmetry as a function of for the beam. It shows that there is a significant asymmetry in favor of and that the asymmetry increases gradually as increases. The asymmetry values are included in Table 1.

| Asymmetry | |||
|---|---|---|---|
| 0.15-0.20 | 875156 | 619141 | 0.170.14 |
| 0.20-0.25 | 669102 | 40991 | 0.240.13 |
| 0.25-0.30 | 72392 | 26263 | 0.470.11 |
| 0.30-0.35 | 41362 | 12543 | 0.540.13 |
| 0.35-0.40 | 28249 | 6938 | 0.610.18 |
| 0.40-0.50 | 23234 | 4726 | 0.660.16 |
| 0.50-0.60 | 12428 | 57 | 0.920.10 |
| 0.60-0.70 | 159 | 55 | 0.500.43 |
Figure 5 displays the asymmetry as a function of . These asymmetry values are also corrected for acceptance. One can see that the asymmetry is flat within the observed range (up to )

In order to further explore the leading particle effect, the analysis was repeated with data from the beam, obtained under the same conditions as with the beam. Because pion beam statistics are much lower, we compare only integrated asymmetry results for all events with . For the beam, which has no leading particle, the integrated asymmetry is consistent with zero ( 0.060.11). On the other hand, analysis of the beam data in the same way results in a large asymmetry in favor of ( 0.530.06).
6 Systematic Study
Studies of possible systematic errors due to the side-band subtraction method were done by varying the size and position of the side bands. Effects of changing bin sizes on the results were also investigated. Systematics of the acceptance calculations have been checked with meson asymmetries and polarizations, all of which should be zero and are. The false asymmetry due to our hardware trigger was also studied. Even when combined together, these effects are all considerably smaller than the statistical uncertainty and are neglected. The contribution of the misidentification of beam particles as is estimated to be a few percent. The resulting dilution in the asymmetry is negligible.
As mentioned before, background including the contamination under the peak is highly reduced by limiting data to the resonant states. Effects of the remaining background were studied by comparing the integrated asymmetries obtained from the two resonant states. In the case all backgrounds, including contamination, are negligible and cannot affect the asymmetry. The integrated asymmetry is 0.520.06. For the channel it is 0.420.08. The effect of the contamination reported in ref [9] would reduce a real asymmetry of 0.52 to an observed value of 0.48, statistically compatible with observation. The overall dilution effect is much smaller than the statistical uncertainties in individual bins and is not included in the final results (Table I and Figure 4).
7 Conclusion
To summarize: the beam data show a strong production asymmetry favoring production. This is consistent with leading particle effects. However, the integrated asymmetry from beam at 0.15 for meson is 0.060.11, which is consistent with zero asymmetry as expected since neither nor is a leading particle. Our results are consistent with the previous measurement done by WA89 experiment at CERN with 340 GeV/c beam.
The SELEX pion result of negligible integrated asymmetry agrees with the higher-statistics differential distribution for a 500 GeV beam reported by E791[4]. Their integrated asymmetry in the range 0.1 to 0.5 is 0.0320.022. Our results also favor the color drag model over the intrinsic charm model, since the color drag model predicts a large asymmetry at large independent of [4, 10, 11].
8 Acknowledgements
The authors are indebted to the staff of Fermi National Accelerator Laboratory and for invaluable technical support from the staffs of collaborating institutions. This project was supported in part by Bundesministerium für Bildung, Wissenschaft, Forschung und Technologie, Consejo Nacional de Ciencia y Tecnología (CONACyT), Conselho Nacional de Desenvolvimento Científico e Tecnológico, Fondo de Apoyo a la Investigación (UASLP), Fundação de Amparo à Pesquisa do Estado de São Paulo (FAPESP), the Israel Science Foundation founded by the Israel Academy of Sciences and Humanities, Istituto Nazionale di Fisica Nucleare (INFN), the International Science Foundation (ISF), the National Science Foundation (Phy #9602178), NATO (grant CR6.941058-1360/94), the Russian Academy of Science, the Russian Ministry of Science and Technology, the Turkish Scientific and Technological Research Board (TÜBİTAK), the U.S. Department of Energy (DOE grant DE-FG02-91ER40664 and DOE contract number DE-AC02-76CHO3000), and the U.S.-Israel Binational Science Foundation (BSF).
References
- [1] P. Nason, S. Dawson and K. Ellis, Nucl. Phys. B327, 49 (1989).
- [2] S. Frixione, M.L. Mangano, P. Nason, and G. Ridolfi, Nucl. Phys. B431, 453 (1994).
- [3] WA89 Collaboration, M. Adamovich et al. Eur. Phys. J. C8, 593 (1999).
- [4] E791 Collaboration, E.M. Aitala et al., Phys. Lett. B411, 230 (1997).
- [5] F. Garcia et al. Phys. Lett. B528, 49 (2002).
- [6] E. Norrbin, T. Sjostrand Eur. Phys. J. C17, 137 (2000).
- [7] R. Vogt and S.J. Brodsky, Nucl. Phys. B478, 311 (1996).
- [8] J. Engelfried et al., Nucl. Instrum. Methods A 431, 53 (1999).
- [9] M. Iori et al. Phys. Lett. B523, 22 (2001).
- [10] E769 Collaboration, G.A. Alves et al., Phys. Rev. Lett. 72, 812 (1994); Erratum-ibid. 72, 1946 (1994).
- [11] E791 Collaboration, E.M. Aitala et al., Phys. Lett. B371, 157 (1996).