J. M. Link
University of California, Davis, CA 95616
M. Reyes
University of California, Davis, CA 95616
P. M. Yager
University of California, Davis, CA 95616
J. C. Anjos
Centro Brasileiro de Pesquisas Físicas, Rio de Janeiro, RJ, Brasil
I. Bediaga
Centro Brasileiro de Pesquisas Físicas, Rio de Janeiro, RJ, Brasil
C. Göbel
Centro Brasileiro de Pesquisas Físicas, Rio de Janeiro, RJ, Brasil
J. Magnin
Centro Brasileiro de Pesquisas Físicas, Rio de Janeiro, RJ, Brasil
A. Massafferri
Centro Brasileiro de Pesquisas Físicas, Rio de Janeiro, RJ, Brasil
J. M. de Miranda
Centro Brasileiro de Pesquisas Físicas, Rio de Janeiro, RJ, Brasil
I. M. Pepe
Centro Brasileiro de Pesquisas Físicas, Rio de Janeiro, RJ, Brasil
A. C. dos Reis
Centro Brasileiro de Pesquisas Físicas, Rio de Janeiro, RJ, Brasil
S. Carrillo
CINVESTAV, 07000 México City, DF, Mexico
E. Casimiro
CINVESTAV, 07000 México City, DF, Mexico
E. Cuautle
CINVESTAV, 07000 México City, DF, Mexico
A. Sánchez-Hernández
CINVESTAV, 07000 México City, DF, Mexico
C. Uribe
CINVESTAV, 07000 México City, DF, Mexico
F. Vázquez
CINVESTAV, 07000 México City, DF, Mexico
L. Agostino
University of Colorado, Boulder, CO 80309
L. Cinquini
University of Colorado, Boulder, CO 80309
J. P. Cumalat
University of Colorado, Boulder, CO 80309
B. O’Reilly
University of Colorado, Boulder, CO 80309
J. E. Ramirez
University of Colorado, Boulder, CO 80309
I. Segoni
University of Colorado, Boulder, CO 80309
M. Wahl
University of Colorado, Boulder, CO 80309
J. N. Butler
Fermi National Accelerator Laboratory, Batavia, IL 60510
H. W. K. Cheung
Fermi National Accelerator Laboratory, Batavia, IL 60510
G. Chiodini
Fermi National Accelerator Laboratory, Batavia, IL 60510
I. Gaines
Fermi National Accelerator Laboratory, Batavia, IL 60510
P. H. Garbincius
Fermi National Accelerator Laboratory, Batavia, IL 60510
L. A. Garren
Fermi National Accelerator Laboratory, Batavia, IL 60510
E. Gottschalk
Fermi National Accelerator Laboratory, Batavia, IL 60510
P. H. Kasper
Fermi National Accelerator Laboratory, Batavia, IL 60510
A. E. Kreymer
Fermi National Accelerator Laboratory, Batavia, IL 60510
R. Kutschke
Fermi National Accelerator Laboratory, Batavia, IL 60510
L. Benussi
Laboratori Nazionali di Frascati dell’INFN, Frascati, Italy I-00044
S. Bianco
Laboratori Nazionali di Frascati dell’INFN, Frascati, Italy I-00044
F. L. Fabbri
Laboratori Nazionali di Frascati dell’INFN, Frascati, Italy I-00044
A. Zallo
Laboratori Nazionali di Frascati dell’INFN, Frascati, Italy I-00044
C. Cawlfield
University of Illinois, Urbana-Champaign, IL 61801
D. Y. Kim
University of Illinois, Urbana-Champaign, IL 61801
A. Rahimi
University of Illinois, Urbana-Champaign, IL 61801
J. Wiss
University of Illinois, Urbana-Champaign, IL 61801
R. Gardner
Indiana University, Bloomington, IN 47405
A. Kryemadhi
Indiana University, Bloomington, IN 47405
C. H. Chang
Korea University, Seoul, Korea 136-701
Y. S. Chung
Korea University, Seoul, Korea 136-701
J. S. Kang
Korea University, Seoul, Korea 136-701
B. R. Ko
Korea University, Seoul, Korea 136-701
J. W. Kwak
Korea University, Seoul, Korea 136-701
K. B. Lee
Korea University, Seoul, Korea 136-701
K. Cho
Kyungpook National University, Taegu, Korea 702-701
H. Park
Kyungpook National University, Taegu, Korea 702-701
G. Alimonti
INFN and University of Milano, Milano, Italy
S. Barberis
INFN and University of Milano, Milano, Italy
M. Boschini
INFN and University of Milano, Milano, Italy
A. Cerutti
INFN and University of Milano, Milano, Italy
P. D’Angelo
INFN and University of Milano, Milano, Italy
M. DiCorato
INFN and University of Milano, Milano, Italy
P. Dini
INFN and University of Milano, Milano, Italy
L. Edera
INFN and University of Milano, Milano, Italy
S. Erba
INFN and University of Milano, Milano, Italy
M. Giammarchi
INFN and University of Milano, Milano, Italy
P. Inzani
INFN and University of Milano, Milano, Italy
F. Leveraro
INFN and University of Milano, Milano, Italy
S. Malvezzi
INFN and University of Milano, Milano, Italy
D. Menasce
INFN and University of Milano, Milano, Italy
M. Mezzadri
INFN and University of Milano, Milano, Italy
L. Moroni
INFN and University of Milano, Milano, Italy
D. Pedrini
INFN and University of Milano, Milano, Italy
C. Pontoglio
INFN and University of Milano, Milano, Italy
F. Prelz
INFN and University of Milano, Milano, Italy
M. Rovere
INFN and University of Milano, Milano, Italy
S. Sala
INFN and University of Milano, Milano, Italy
T. F. Davenport III
University of North Carolina, Asheville, NC 28804
V. Arena
Dipartimento di Fisica Nucleare e Teorica and INFN, Pavia, Italy
G. Boca
Dipartimento di Fisica Nucleare e Teorica and INFN, Pavia, Italy
G. Bonomi
Dipartimento di Fisica Nucleare e Teorica and INFN, Pavia, Italy
G. Gianini
Dipartimento di Fisica Nucleare e Teorica and INFN, Pavia, Italy
G. Liguori
Dipartimento di Fisica Nucleare e Teorica and INFN, Pavia, Italy
M. M. Merlo
Dipartimento di Fisica Nucleare e Teorica and INFN, Pavia, Italy
D. Pantea
Dipartimento di Fisica Nucleare e Teorica and INFN, Pavia, Italy
D. Lopes Pegna
Dipartimento di Fisica Nucleare e Teorica and INFN, Pavia, Italy
S. P. Ratti
Dipartimento di Fisica Nucleare e Teorica and INFN, Pavia, Italy
C. Riccardi
Dipartimento di Fisica Nucleare e Teorica and INFN, Pavia, Italy
P. Vitulo
Dipartimento di Fisica Nucleare e Teorica and INFN, Pavia, Italy
H. Hernandez
University of Puerto Rico, Mayaguez, PR 00681
A. M. Lopez
University of Puerto Rico, Mayaguez, PR 00681
E. Luiggi
University of Puerto Rico, Mayaguez, PR 00681
H. Mendez
University of Puerto Rico, Mayaguez, PR 00681
A. Paris
University of Puerto Rico, Mayaguez, PR 00681
J. Quinones
University of Puerto Rico, Mayaguez, PR 00681
W. Xiong
University of Puerto Rico, Mayaguez, PR 00681
Y. Zhang
University of Puerto Rico, Mayaguez, PR 00681
J. R. Wilson
University of South Carolina, Columbia, SC 29208
T. Handler
University of Tennessee, Knoxville, TN 37996
R. Mitchell
University of Tennessee, Knoxville, TN 37996
D. Engh
Vanderbilt University, Nashville, TN 37235
M. Hosack
Vanderbilt University, Nashville, TN 37235
W. E. Johns
Vanderbilt University, Nashville, TN 37235
M. Nehring
Vanderbilt University, Nashville, TN 37235
P. D. Sheldon
Vanderbilt University, Nashville, TN 37235
K. Stenson
Vanderbilt University, Nashville, TN 37235
E. W. Vaandering
Vanderbilt University, Nashville, TN 37235
M. Webster
Vanderbilt University, Nashville, TN 37235
M. Sheaff
University of Wisconsin, Madison, WI 53706
See http://www-focus.fnal.gov/authors.html for additional author information.
Abstract
The FOCUS experiment(FNAL-E831) has used two channels, and
,
to measure the lifetime of the charmed baryon.
From a sample of signal events at a mass of 2.698 GeV/, we measure an
lifetime of (stat.) (sys.) fs, substantially improving upon the current world
average.
pacs:
13.30.Eg 14.20.Lq 14.65.Dw
I Introduction
Several experiments have searched for the , ground state.
The first claim of an observation of the was made by CERN experiment
WA62 with a cluster of 3 events in the decay channel of
(throughout this Letter, charge conjugate states are assumed)
at a mass of MeV Z.phys.C28.175 .
The ARGUS collaboration followed with signals for the in and
based on fb-1 of data APS.1993 ,
but these signals were not confirmed by the CLEO experiment which had a much higher sensitivity.
Fermilab photoproduction experiment E687 reported an observation of the decaying to
with a mass of MeV PLB.338.106 and a lifetime of
fs PLB.357.678 .
E687 published an earlier observation in the channel with a mass
of MeV PLB.300.190 .
In 1995, CERN experiment WA89 reported 200 events in seven modes, although the published
lifetime result of fs comes from only two of the decay modes PLB.358.151 .
In 2000, CLEO presented an mass of MeV with the combined signal from
four decay modes PRL.86.3730 .
Clearly, the lifetime measurement of the is still not well measured.
Additional measurements with improved statistical accuracy are needed to test
theoretical models.
The lifetime measurement is particularly important (when combined with other charm baryon lifetime
measurements) in estimating the interference effects from different contributing
diagrams PLB.289.455 . The current uncertainty on the
lifetime is more than 30% Phys.Rev.D66 of the lifetime value and is too large to extract
meaningful information on the interfering amplitudes. In this Letter we report
a new lifetime value of the baryon from the FOCUS experiment.
The FOCUS spectrometer is well-suited to reconstruct short-lived charm decays.
Two silicon microvertex systems provide excellent separation between the production
and charm decay vertices. The target silicon system (TS) consists of two pairs of silicon planes,
each immediately downstream of a pair of BeO target segments. The second silicon strip detector (SSD)
consists of 12 silicon planes, downstream of the target region.
Charged particles are tracked and momentum analyzed with five
stations of multiwire proportional chambers in a two magnet forward spectrometer. Three
multicell threshold Čerenkov detectors are used to identify electrons, pions, kaons,
and protons and are described in detail in a previous FOCUS publication hep.ex.0108011 .
II Reconstruction of hyperons, and
A detailed description of and reconstruction in the FOCUS
spectrometer can be found elsewhere hep.ex.0109028 .
Using the “cascade” reconstruction algorithm,
we are able to reconstruct the decays and
,
which have branching fractions of 99.9% and 67.8%, respectively.
In this analysis, we only use ’s and ’s which decay downstream of the SSD.
This allows us to track the or in the SSD before it decays.
A vertex is found between a and a or a and the
or combined
momentum vector must match the slopes and positions of a track in the SSD.
For candidates, we require mass differences of
MeV and
MeV, ensuring that
most of the more copiously produced ’s are removed from the sample.
III Reconstruction of candidates
The candidates are formed by making a vertex hypothesis for the daughter
particles.
We use a and three charged tracks of the right charge combination
for the mode, and
an and an oppositely charged track for the mode.
The confidence level of the decay vertex of the candidate is
required to be greater than 10%. The combined momentum vector located at the
decay vertex forms the track.
A candidate driven vertexing algorithm nim.320.519 uses the
track as a seed track to find a production vertex with a
confidence level greater than 1%. The primary multiplicity, including the
seed track, must be at least 3 tracks and the production vertex must be
inside a target.
The significance of separation between the production and the decay vertices
() must be greater than 2
for the mode and greater than 0 for the mode.
Different values are chosen for the cut due to a difference in the secondary
vertex resolution.
Čerenkov particle identification (PID) is performed by constructing a
log likelihood value for the particle
hypotheses ( ).
The consistency of a track is defined by ,
where is the minimum value of
the other three hypotheses. Similarly, we define
for kaon identification. We
require for kaons
and for pions.
In the mode, we add additional combination PID cuts based on
Monte Carlo simulation studies. We define
to be the positive sum over pion candidates and the
negative sum over other particle candidates. Also is
used for separation between the protons and the kaons.
and
are required to be greater than 7.
In the mode the momentum asymmetry,
, is required to be
greater than and less than .
Also the transverse momentum must be larger than GeV and the
the momentum of must be greater than GeV.
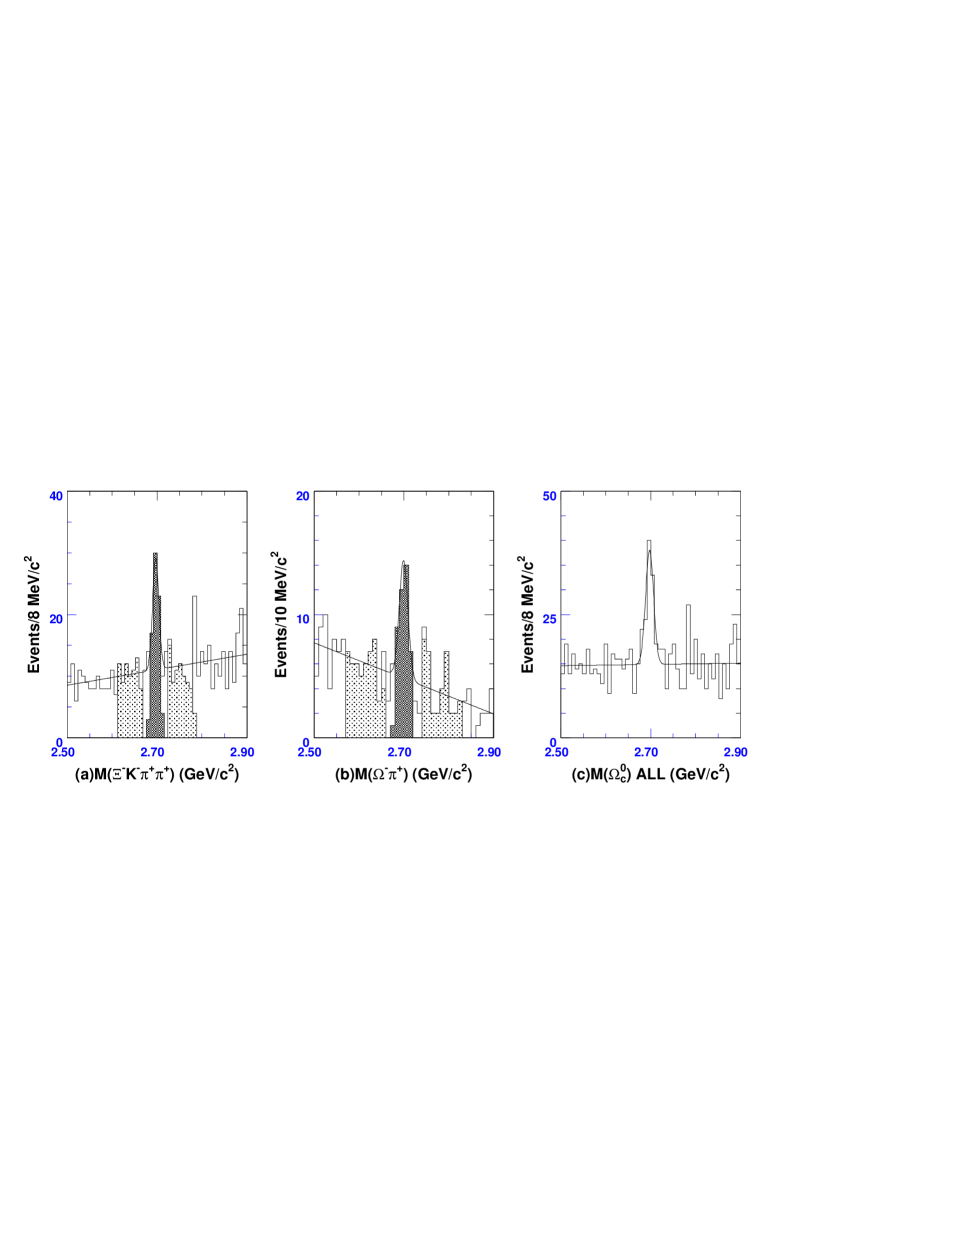
The resulting mass spectra are shown in Fig. 1. The mass
spectra are fit with a Gaussian function for the signal distribution and
a first order polynomial function for the background. From the combined sample, we
find a fitted mass of MeV (systematic uncertainty not evaluated), consistent with the results of
other experiments.
Figure 1: Invariant mass distributions for candidates:
(a) Reconstructed mass of . There are events
at a mass of MeV.
(b) Reconstructed mass of . There are events at
a mass of MeV.
(c) Combined invariant mass distribution. There are events at a mass
of MeV.
We define the signal region (hatched area) to be
within of the fitted mass value and the two sideband regions
(dotted area) are 4–12 from the fitted mass value.
IV Lifetime measurement
To measure a lifetime in fixed target experiments, we use a binned maximum
likelihood technique PLB.268.584 . We fit the reduced proper time
distribution, defined as ,
where is the separation cut value between the production and the decay vertex,
is the particle velocity, and is the Lorentz boost factor to
the center of mass frame.
The signal region is defined to lie within of the fitted mass.
The background is assumed to have the same lifetime behavior in the signal region as
in the sidebands, 4–12 away from the peak.
Taking as the number of signal events in the signal region and as the total
number of background events in the same region, the expected number of events in
the reduced proper time bin centered at is given by:
(1)
where describes the background reduced proper time as
estimated from sidebands and is a correction function
which takes into account the effects of spectrometer acceptance and efficiency,
analysis cut efficiencies, and particle absorption. The distribution are
shown in Fig. 2 for each decay mode.
Figure 2: The correction function is displayed for each mode.
The likelihood is constructed from the product of the Poisson probability of observing
events when are expected with the Poisson
probability of observing events in the sidebands when 4 background
events
are expected. The factor of 4 accounts for the fact that the sideband region is
four times wider than the signal region.
The likelihood takes the form:
(2)
The combined likelihood function is given by the product of the likelihoods:
(3)
There are 3 fit parameters; one parameter for the lifetime and
two parameters, B and B, for the backgrounds
from each mode.
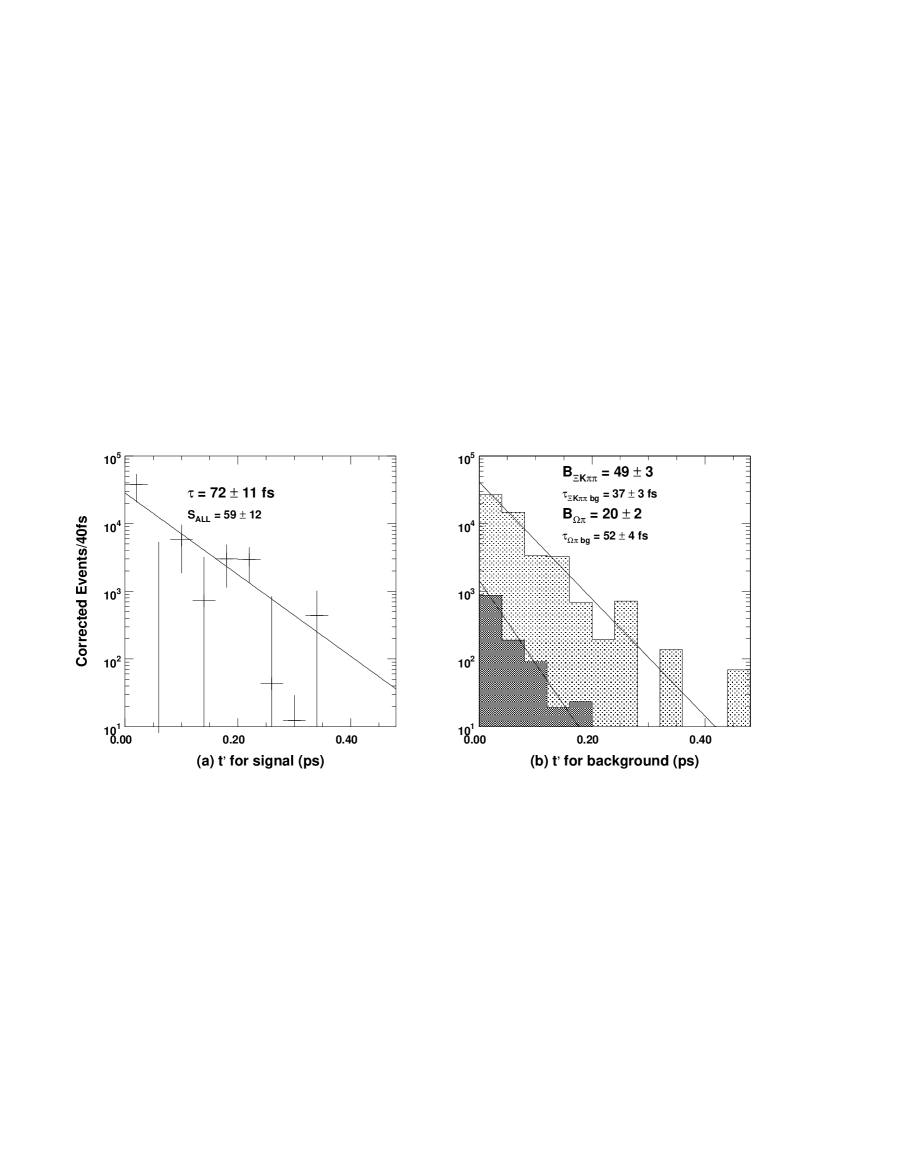
Our measurement of the lifetime is fs as shown in Fig. 3.
In Fig. 4, the distributions from the data and from the fit are compared with each other.
Figure 3: (a) The corrected distribution with the lifetime fit function for the combined signal.
(b) The distributions of expected backgrounds in the signal band for each mode;
the dark region is for and the light one is for .
Lines show the lifetime fitting functions for signal and background
distributions.
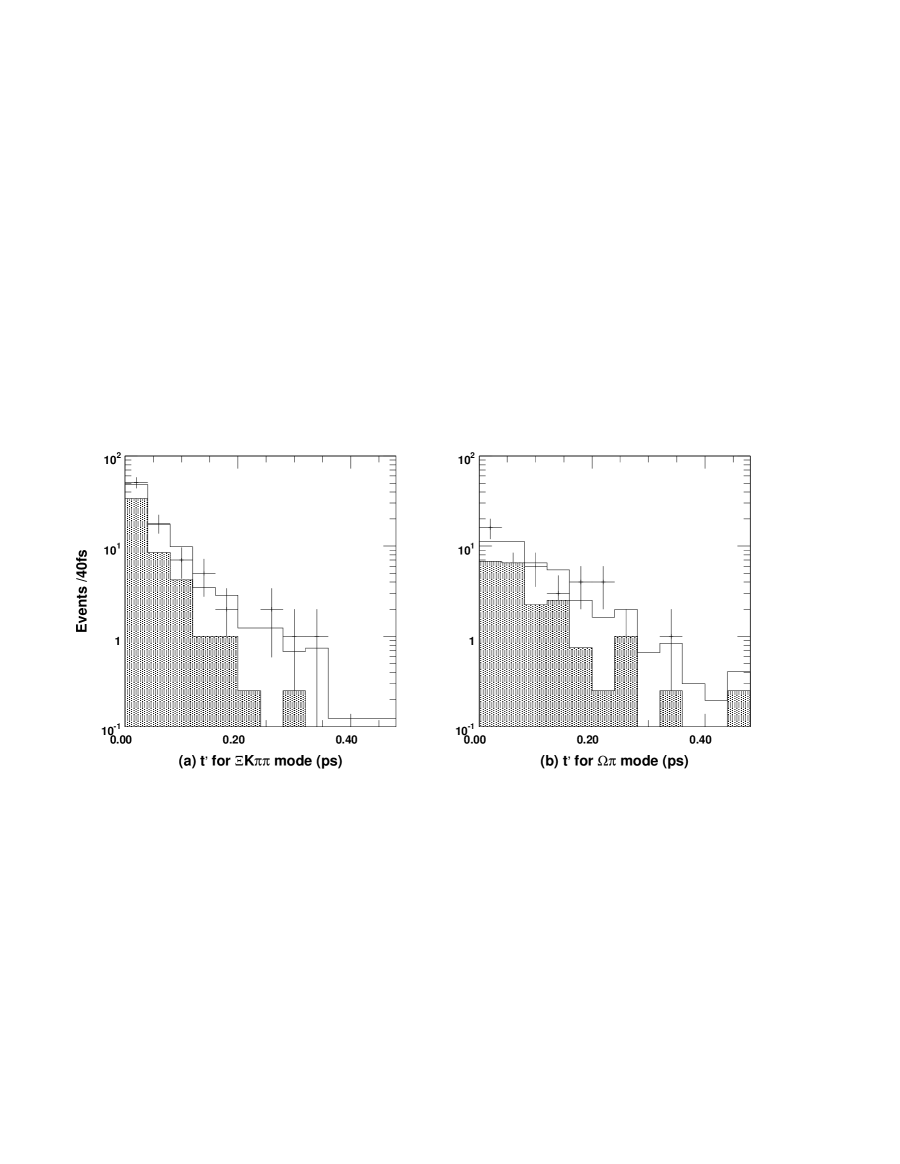
The lifetime fit finds signal events rather than due to the mass window used.Figure 4: The predicted events (histogram) are superimposed on the observed events (points)
while the shaded distribution displays the distribution of the
background for (a) the mode and (b) the mode.
V Studies of systematic errors
Figure 5: Lifetime measurements for systematic studies.
The solid line represents the best determined value for the lifetime
and the two dotted lines show the extent of the statistical error.
Table 1: The itemized list of the systematic uncertainties. The numbers in the Items column refer to
the entry numbers in Fig. 5.
Systematic Source
Items
Uncertainty (fs)
Split Sample Method
Particle and antiparticle (1,2)
Upstream and downstream target (3,4)
High and low momentum (5,6)
Primary vertex multiplicity (7,8)
Fit variant
Bin size (10,11) and fitting region (9)
Resolution
Toy Monte Carlo studies
Background
Sideband (12,13,14) and signal band (15,16,17)
Total
Table 2: The lifetime measurements
Experiment
Lifetime
Decay Modes
E687
86 28 fs
WA89
55 fs
,
PDG2002
64 20 fs
FOCUS
72 11 11 fs
,
We have studied various systematic uncertainties associated with the Monte Carlo modeling
by computing the lifetimes of
independent data samples split by particle/antiparticle, primary vertex position
(upstream and downstream target region), momentum
(greater than 70 GeV / less than 70 GeV) and production vertex multiplicity (5 / ).
All lifetimes from these samples are consistent within the statistical error as
shown in Fig. 5 points 1–8, indicating a negligible systematic error due to the
Monte Carlo simulation.
Since the binned likelihood method has been used to measure the lifetime, we have
investigated the uncertainty from the fit range and binning effects by examining the
variance in lifetime for different bin sizes (Fig. 5 points 10–11) and
for different fitting ranges (Fig. 5 point 9).
The proper time resolution of our fully simulated Monte Carlo for the data is about
40–50 fs. We have tested the accuracy of the fitting procedure when the
lifetime is comparable to the proper time resolution. We used a toy Monte Carlo study to test
the fitting procedure using the proper time from
which we extracted a systematic uncertainty of 4 fs. The toy Monte Carlo test was also
used to validate the statistical error determination.
The systematic uncertainty due to the background contamination is examined by investigating the reflections
from other charm baryon decays and by varying the sideband
and signal regions (Fig. 5 points 12–17).
The studies of the systematic uncertainties are summarized in Table 1.
The total systematic uncertainty of the lifetime measurement is determined to
be 11 fs by adding all of the systematic uncertainties in quadrature.
VI Conclusion
We measure an lifetime of fs using events in the
two decay modes, and
.
We compare our result with previous measurements
in Table 2. Our lifetime result is consistent with
previous lifetime results. This 20% measurement of the lifetime
substantially improves upon the current (30%) world average.
VII Acknowledgements
We wish to acknowledge the assistance of the staffs of Fermi National
Accelerator Laboratory, the INFN of Italy, and the physics departments
of
the
collaborating institutions. This research was supported in part by the
U. S.
National Science Foundation, the U. S. Department of Energy, the Italian
Istituto Nazionale di Fisica Nucleare and
Ministero della Istruzione, Università e
Ricerca, the Brazilian Conselho Nacional de
Desenvolvimento Científico e Tecnológico, CONACyT-México, and
the Korea Research Foundation of the
Korean Ministry of Education.
References
(1)
S. F. Biagi et al., Z. Phys. C28 (1985) 175.
(2)
J. Stiewe (ARGUS Collab.), Proc. 26th Int. Conf. in High Energy Physics (Dallas, 1992), Vol. 1,
ed. J. R. Sanford, (AIP Conf. Proc., New York, 1993) p. 1076.
(3)
P. L. Frabetti et al., Phys. Lett. B338 (1994) 106.
(4)
P. L. Frabetti et al., Phys. Lett. B357 (1995) 678.
(5)
P. L. Frabetti et al., Phys. Lett. B300 (1993) 190.
(6)
M. I. Adamovich et al., Phys. Lett. B358 (1995) 151.
(7)
D. Cronin-Hennessy et al., Phys. Rev. Lett. 86 (2001) 3730.
(8)
Hai-Yang Cheng, Phys. Lett. B289 (1992) 455.
(9)
K. Hagiwara et al. (Particle Data Group), Phys. Rev. D66, (2002) 010001.
(10)
J. M. Link et al., Nucl. Instrum. Meth. A484 (2002) 270.
(11)
J. M. Link et al., Nucl. Inst. Meth. A484 (2002) 174.
(12)
P. L. Frabetti et al., E687 Collaboration, Nucl. Inst. Meth. A320 (1992),
519.
(13) P. L. Frabetti et al., Phys. Lett. B268 (1991) 584.