Pulse Shape Discrimination in the IGEX Experiment
Abstract
The IGEX experiment has been operating enriched germanium detectors in the Canfranc Underground Laboratory (Spain) in a search for the neutrinoless double decay of 76Ge. The implementation of Pulse Shape Discrimination techniques to reduce the radioactive background is described in detail. This analysis has been applied to a fraction of the IGEX data, leading to a rejection of 60 % of their background, in the region of interest (from 2 to 2.5 MeV), down to c/(keV kg y).
D. Gonzáleza, J. Moralesa111Corresponding author: jmorales@posta.unizar.es, S. Cebriána, E. Garcíaa, I.G. Irastorzaa222Present address: CERN, EP Division, CH-1211 Geneva 23, Switzerland,
A. Moralesa, A. Ortiz de Solórzanoa, J. Puimedóna, M.L. Sarsaa, J.A. Villara
C.E. Aalsethb333Present address: Pacific Northwest National Laboratory, Richland, WA 99352, USA, F.T. Avignone IIIb
R.L. Brodzinskic, W.K. Hensleyc, H.S. Mileyc, J.H. Reevesc
I.V. Kirpichnikovd, A.A. Klimenkoe
S.B. Osetrove, A.A. Smolnikove, , A.A. Vasenkoe, S.I. Vasilieve
V.S. Pogosovf, A.G. Tamanyanf
aLaboratory of Nuclear and High Energy Physics, University of
Zaragoza,
50009 Zaragoza, Spain
bUniversity of South Carolina, Columbia, South Carolina 29208
USA
cPacific Northwest National Laboratory, Richland, Washington
99352 USA
dInstitute for Theoretical and Experimental Physics, 117 259
Moscow, Russia
eInstitute for Nuclear Research, Baksan Neutrino
Observatory,
361 609 Neutrino, Russia
fYerevan Physical Institute, 375 036 Yerevan, Armenia
1 Introduction
The nuclear Double Beta Decay (DBD) is an unique laboratory to investigate the nature and properties of the neutrino [1, 2]. The neutrinoless decay mode, if it exists, would provide an unambiguous evidence of the Majorana nature of the neutrino, its non-zero mass, and the non-conservation of lepton number. After the definitive confirmation that neutrinos have indeed non-zero mass, as the solar and atmospheric neutrino oscillation results imply [3, 4], the neutrinoless Double Beta Decay (DBD) has become a most relevant subject of research because it is a process able to provide, in a relatively short time, the neutrino mass scale and its hierarchy pattern. The current best sensitivity limits of the effective Majorana electron neutrino mass -derived from the neutrinoless half-life lower bound- stands around meV [5, 6] (the dispersion range is due to the uncertainties in the evaluation of the nuclear matrix elements), whereas most of the neutrino mass models indicate that the mass region where the Majorana nature of the neutrino would be resolved lies two orders of magnitude below ( a few meV). To achieve the sensitivity required for such new objectives, it will require a large number of double beta emitter nuclei, a very low background and a sharp energy resolution in the Q-value region, and/or methods to disentangle signal from noise.
A typical example of this type of search is IGEX. The International Germanium EXperiment (IGEX) has been running in the Canfranc Underground Laboratory at a depth of 2450 m.w.e. in a search for the neutrinoless Double Beta Decay. Details and results of the experiment can be found in ref. [5]. Three Germanium detectors (RG1, RG2 and RG3), of 2 kg each, enriched to 86% in 76Ge were used.
This paper presents the development and application of one technique used to reduce part of the radioactive background by discriminating it from the expected signal by comparison of the shape of the pulses (PSD) of both types of events. As an example, the method has been applied to the data recorded by two Ge detectors of the IGEX Collaboration, which has produced one of the two best current sensitivity limits for the Majorana neutrino mass parameter [5, 6].
The rationale for PSD is quite simple: in large intrinsic Ge detectors, the charge carriers take 300 - 500 ns to reach their respective electrodes. These drift times are long enough for the current pulses to be recorded at a sufficient sampling rate. The current pulse contributions from electrons and holes are displacement currents, and therefore dependent on their instantaneous velocities and locations. Accordingly, events occurring at a single site (-decay events for example) have associated current pulse characteristics which reflect the position in the crystal where the event occurred. More importantly, these single-site events (SSE) frequently have pulse shapes that differ significantly from those due to the background events that produce electron-hole pairs at several sites by multi-Compton-scattering process, for example (the so-called Multi-Site Events (MSE)). Consequently, pulse-shape analysis can be used to distinguish between these two types of energy depositions: DBD events belong to the SSE class of events and will deposit energy at a single site in the detector while most of the background events belong to the MSE class of events and will deposit energy at several sites.
The IGEX detectors have modified preamplifier electronics to route and record the current pulses at a very early stage of preamplification, thus producing unique high-bandwidth pulse shape signals. Furthermore, to develop PSD techniques it would be highly desirable to obtain an earlier signal, even before it passes through the few unavoidable electronic components at the first stage of the detector preamplifier, resembling as much as possible the displacement current of the detector. This allows the development of algorithms that do not depend strongly on the preamplifier electronics in use. To this end, the transfer function of the preamplifier and associated front-end stage has been measured for each detector. This allows the reconstruction of the displacement current and an easy comparison to computed pulse shapes.
The paper is organized as follows: in Section 2, the properties of the digitized experimental pulses are shown and the work performed to understand and reproduce their shapes is presented. In Section 3, the PSD method is described. Finally, Section 4 displays the results of this analysis for the IGEX data.
2 Experimental and calculated pulses
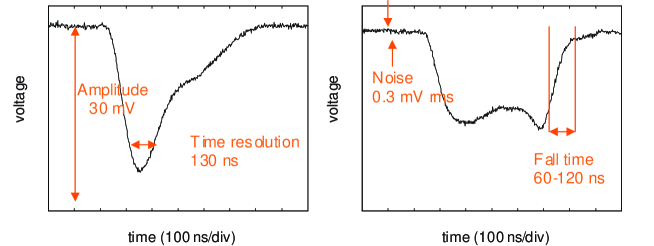
The data acquisition system of the IGEX experiment is based on standard NIM electronics, each Ge detector having an independent electronic chain. Preamplifiers were modified for pulse shape analysis and each preamplifier fast-pulse output is routed to a LeCroy 9362 digital oscilloscope (800 MHz analog bandwith). The digitized pulse signal covers a total time of 1 s using 500 points; it is worth noting that the time resolution, of about 100 ns (as inferred from the width of the peaked features or the fall time), limits the ability to resolve nearby features in the pulse such as lobes or discontinuities characteristic of a multiple-site interaction signal. Figure 1 shows the main features of the digitized pulses. These output pulses are taken at the very first stage of the amplification chain, but even so, there is an unavoidable instrumental distortion due to the preamplifier. This has been studied to determine its transfer function . To take into account this distortion in the pulse shape analysis, either the calculated pulse is folded with the transfer function,
| (1) |
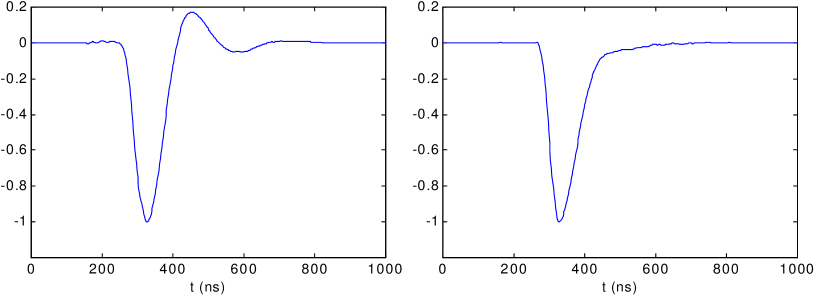
or the experimental signal unfolded. The latter allows the recovery of some information lost because of the instrumental distortion [7]. The transfer function of the preamplifiers, , depicted in figure 2, has been directly measured as the response of the preamplifier for a narrow -like signal. Studies were also made following several methods including analog simulation of the preamplifier circuits and the analysis of the shapes of selected populations of experimental pulses. It was observed that the shape of the rise and the fall of the folded pulses is the same that the shape of the transfer function for those events in which the energy is released in some particular regions of the crystal; in particular, the left side of the transfer function can be deduced by studying pulses of events in the inner and lower part of the crystal, while the right side is derived from those produced in the outer and upper region. Measurements and estimates for the transfer function are found to be in quite good agreement.
The pulse shapes of the output signals can be reproduced numerically. An energy deposition in a Ge crystal produces a proportional number of electron-hole pairs, which move towards the electrodes. The induced current , and consequently the electric pulse taken from the detector, is the sum of the contributions due to each type of charge carriers:
| (2) |
The current is calculated as [8]:
| (3) |
where is the so-called weighting field444The weighting field is the field that would appear in the crystal if a unity voltage was applied to the sensor electrode (assuming no impurity in the crystal). In principle, the drift velocity of charge carriers is proportional to the electric field : , where is the mobility in the material medium. However, at high values of the electric field, a saturation velocity is reached. The dependence of the velocity on the electric field has been obtained empirically [9]:
| (4) |
The values commonly used for the parameters involved in expression 4 (the mobility , the numerical parameter and the electric flield for saturation ) are summarized in table 1 [10].
| electrons | holes | |
| (V/cm) | 275 | 210.5 |
| (cm2/Vs) | 36000 | 42000 |
| 1.32 | 1.36 |
The solution for the electric field () in the crystal is derived from the Poisson equation, applied for the depleted and non-depleted regions:
| (5) |
| (6) |
| (7) |
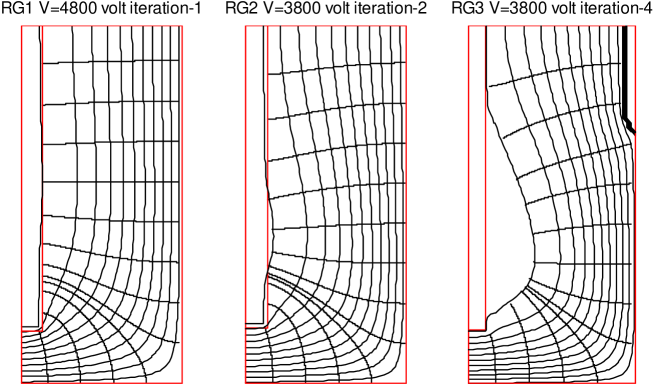
The electric field depends on the geometry of the crystal (true coaxial or closed-end), the supplied voltage and on the residual space charge density . The parameters and correspond to the locations of the internal and external electrodes of the detector. A solution (depicted in figure 3) has been obtained for the cases of depleted and non-fully depleted, closed-end crystals of the IGEX experiment by using an iterative method of calculation. For a non-fully depleted detector, the boundary between the depleted and non-depleted regions in the crystal is unknown a priori. An invalid solution is obtained when using the boundary condition of eq. (7), because a region with a field having inverse direction appears (which means that this region is not depleted). Therefore, the boundary condition is changed by using the deduced limit for the depleted region instead of ; then, a new solution is found for the electric field and, consequently, a new limit for the non-depleted region is obtained. This procedure is repeated until the solution does not change significantly between two successive iterations.
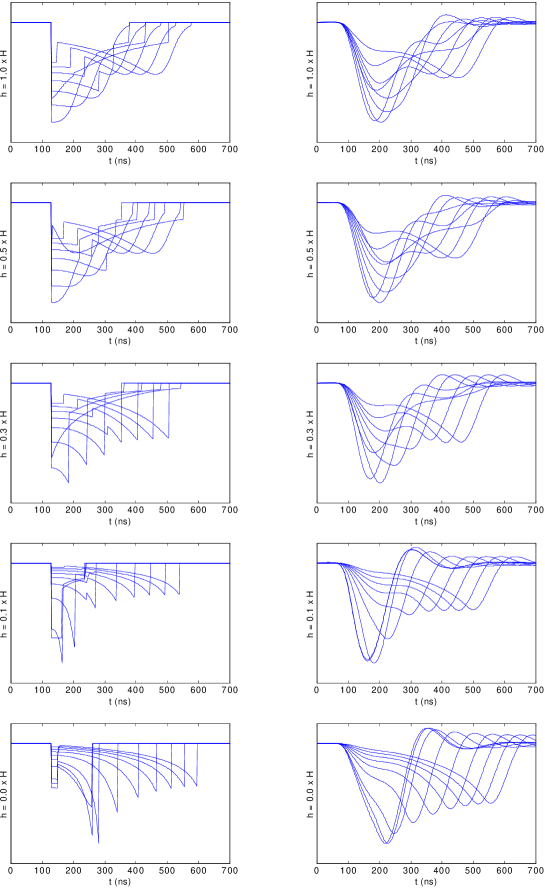
Once the electric field is known, the pulse shapes can be calculated. Some examples for SSE are shown in figure 4. Different radial positions have been considered in each plot for several vertical coordinates; the effect of the instrumental distortion is shown on the right plots. To reproduce MSE pulses, the shapes due to each individual interaction should be properly added weighted by the fractional amount of energy released in the crystal, obtained by Monte Carlo simulation.
3 PSD Method
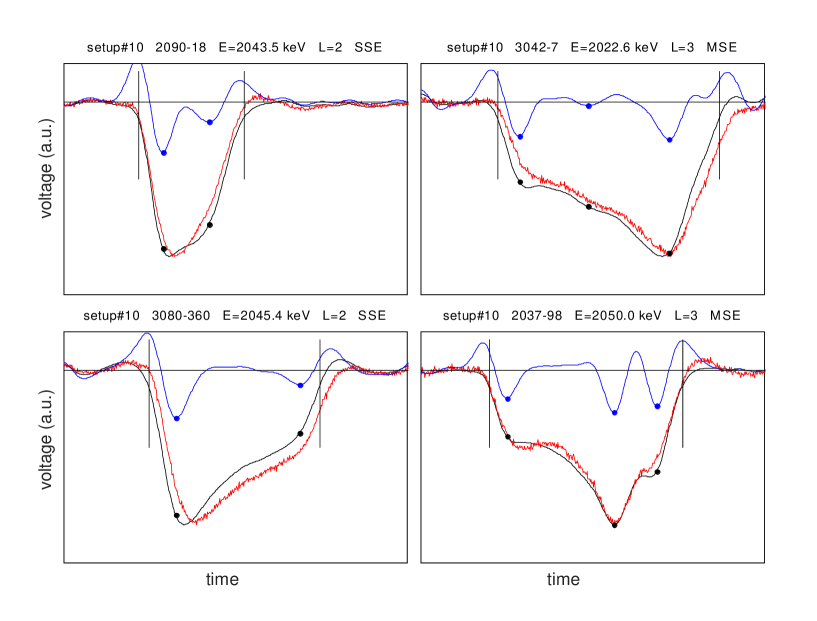
The PSD method we have used consists in counting the number of lobes of the pulses and rejecting those events having more than two significant lobes or peaks. A SSE pulse is expected to have at most two lobes, one due to electrons and the other due to holes. Experimental pulses are first unfolded using the transfer function of the preamplifier. Then, to detect lobes a ”mexican-hat” filter of the proper width is applied to the pulse. In fact, this filter is the second derivative of a gaussian:
| (8) |
and the filtered signal has a null mean value where there is no lobe in the original signal and a peak where a lobe is present. Therefore, it is straightforward to reject all the events having more than two lobes. Figure 5 shows the results of applying this method to four different pulses.
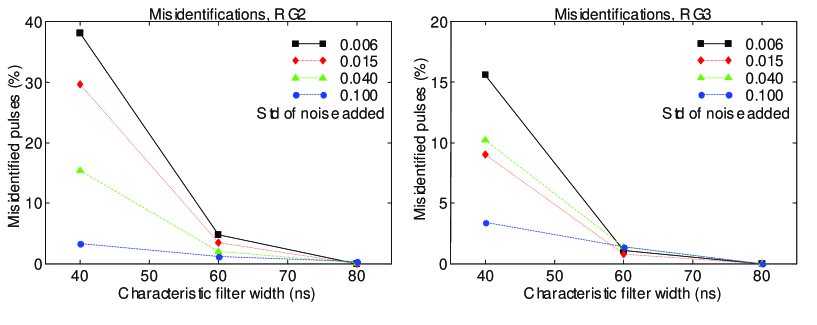
This robust method is nearly model-independent. Its effectiveness has been evaluated on calculated SSE. A test population of 2000 SSE pulses was generated for each detector. The locations were randomly chosen, uniformly distributed in the volume of the crystals. Each calculated pulse was folded with the proper preamplifier transfer function, then scaled to unit height, and a variable amount of gaussian noise was added, to reproduce experimental pulses of different energies and noise levels. Finally, the number of lobes of each pulse was obtained by applying ”mexican-hat” filters derived from gaussians of different widths. After the analysis, the fraction of pulses with three o more lobes was retained. This is an estimation of the expected number of misidentified SSE pulses with this technique. The results are shown in figure 6. When applied to a mixed set of SSE and MSE pulses, to obtain the best discrimination results, a narrow filter should be preferred over a broad filter, but it would produce a large fraction of misidentifications. Conversely, a safer, broader filter would not find as many lobes as a narrower filter, and its discrimination power would be smaller. As a compromise, we choose the filter with a characteristic width of 60 ns, thus keeping the misidentification error for the calculated SSE pulses under 5% for all pulses in the whole noise range considered. Notice that those MSE in which the separation of the interactions in the (r,z) plane is too small or the amounts of energy deposited at each point are extremely unbalanced will not be rejected by this technique.
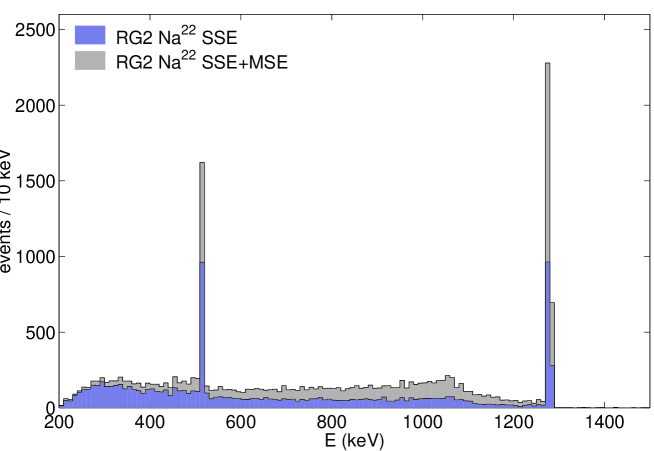
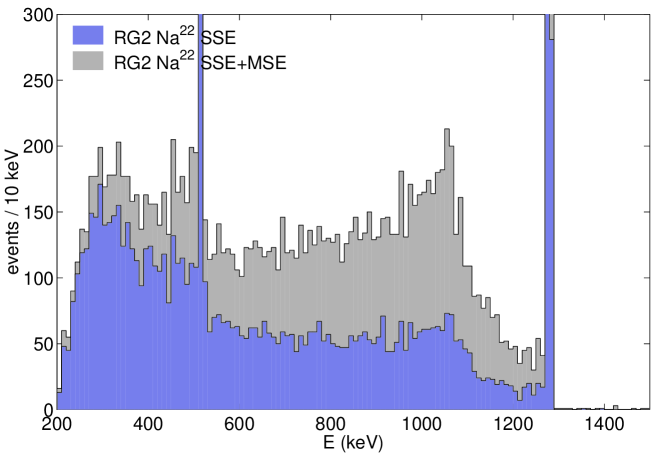
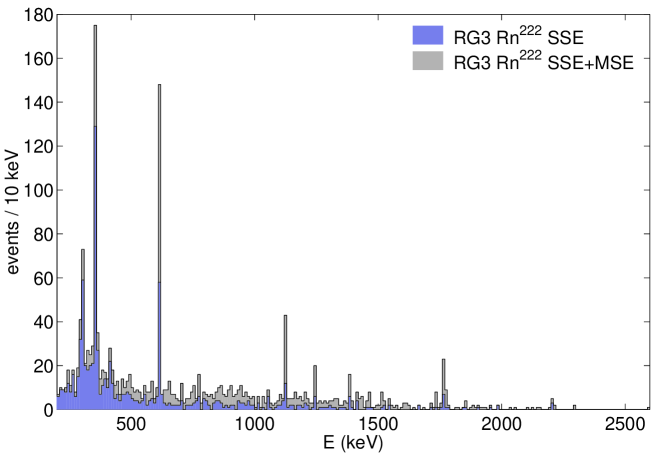
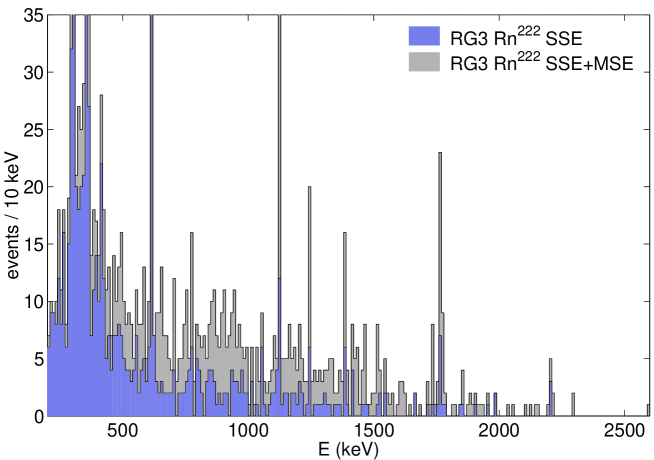
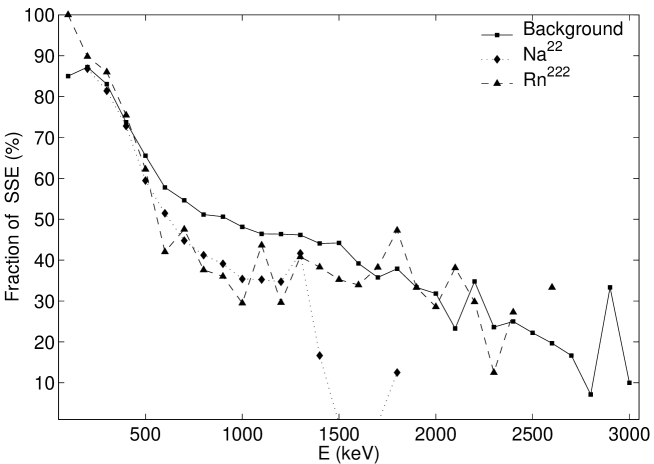
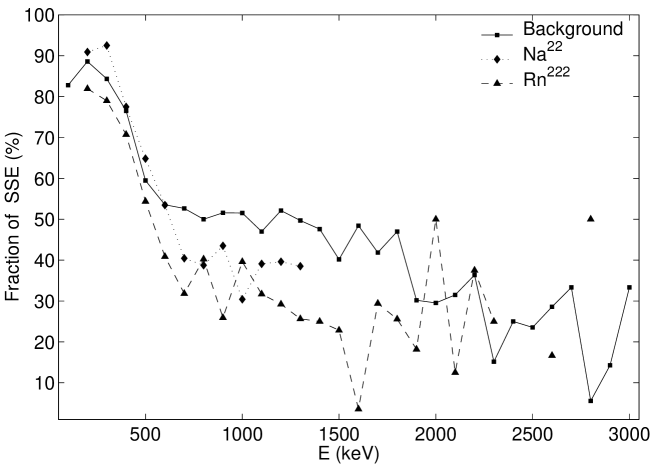
This method of counting the number of lobes of the pulses has been applied also to a 22Na calibration spectrum and to a set of data taken following a large intrusion of radon in the shielding. Fig. 7 illustrates the reduction in the case of 22Na spectrum for detector RG2 and Fig. 8 the case of radon for detector RG3. A comparison of the results of the method for the cases of background, 22Na calibration and radon is shown in Fig. 9.
4 Results
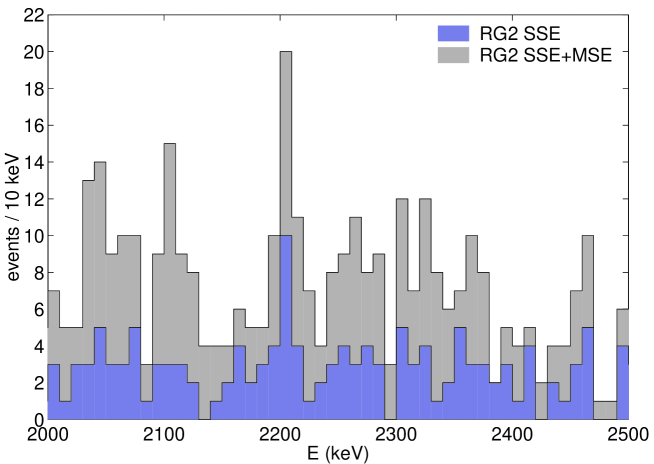
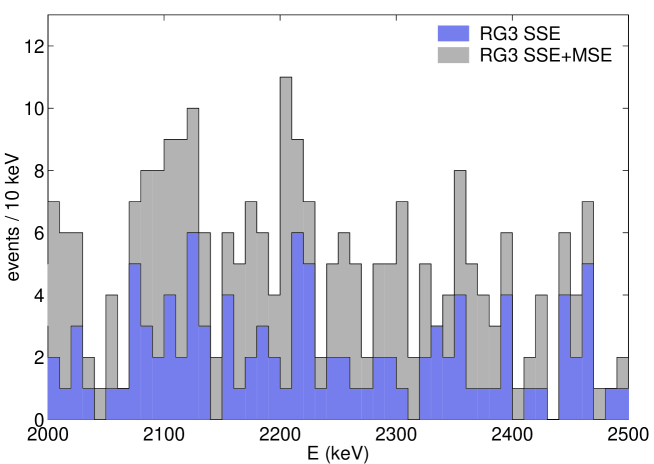
The background reduction technique described above has been applied to the IGEX data whose pulse shape was recorded (those events whose pulse shape was not available are conservatively considered SSE). Table 2 summarizes the results (exposure, background levels in the region of interest from 2 to 2.5 MeV before and after the PSD, rejection factor) for each detector. Figure 10 shows the spectra before and after application of the PSD technique to the data of detectors RG2 and RG3. This method results in an efficient rejection leading to a background level (in the best case) of 0.10 c/(keV kg y) in detector RG2, as can be seen in Table 2. This value can be considered as the background limit achieved with the present PSD technique. The overall final background level of the set of detectors RG2 and RG3 together turns out to be of 0.10 c/(keV kg y), in the region of interest.
| exposure | b before | b after | rejection | |
| factor | ||||
| kg y | c/(keV kg y) | c/(keV kg y) | (%) | |
| RG2 | 2.75 | 0.27 | 0.10 | 62.19 |
| RG3 | 1.90 | 0.26 | 0.11 | 57.61 |
| total | 4.65 | 0.26 | 0.10 | 60.36 |
The PSD analysis has been applied to only 52.51 mole y out of the total 116.75 mole y (8.87 kg y) accumulated in the IGEX experiment. In Table 3 the IGEX data correponding to 8.87 kg.y in 76Ge in the region between 2020 and 2060 keV, in 2-keV bins, are given, with and without application of PSD (see also ref. [2]). The obtained half-life lower bounds are for the complete data set and of for the complete data set with application of PSD to 52.51 mole y. Accordingly, the upper limits on the neutrino mass parameter are 0.38–1.55 eV for the first data set and 0.33–1.31 eV for the second data set [5]. The uncertainties originate from the spread in the values of the calculated nuclear matrix elements.
| E(low) keV | SSE data set | Complete data set |
|---|---|---|
| 2020 | 2.9 | 3.9 |
| 2022 | 9.1 | 10.1 |
| 2024 | 2.4 | 4.4 |
| 2026 | 2.0 | 6.0 |
| 2028 | 5.6 | 7.6 |
| 2030 | 6.5 | 7.5 |
| 2032 | 3.3 | 5.3 |
| 2034 | 0.6 | 1.6 |
| 2036 | 1.0 | 4.0 |
| 2038 | 2.0 | 3.0 |
| 2040 | 0.5 | 2.5 |
| 2042 | 3.5 | 5.5 |
| 2044 | 4.0 | 7.0 |
| 2046 | 2.7 | 2.7 |
| 2048 | 5.3 | 7.3 |
| 2050 | 3.4 | 5.4 |
| 2052 | 4.6 | 7.6 |
| 2054 | 5.0 | 7.0 |
| 2056 | 0.6 | 1.6 |
| 2058 | 0.1 | 0.1 |
| 2060 | 3.3 | 6.3 |
| Expected counts | 13.0 | 20.3 |
| Observed counts | 4.1 | 11.1 |
| Upper limit A | 3.1 | 4.3 |
| (90%CL) | ||
| ln2.Nt/A | y | y |
5 Conclusions
A Pulse Shape Discrimination technique to reject the radioactive background in the region in which the double beta decay signal is expected has been developed and applied to the data collected in the IGEX experiment, searching for the neutrinoless double beta decay of 76Ge. A satisfactory understanding of the pulse shapes has been achieved. The method described in this paper is based on the counting of the number of lobes of the pulses, using a proper filter. It has provided a rejection of 60 % of the events in the region of interest, accepting the criterion that those events having more than two lobes cannot be due to a double beta decay. Accordingly, the improved background levels provided by the PSD technique have allowed the improvement of the limits for the half-life of 76Ge and consequently, the effective electron neutrino mass bound.
6 Acknowledgments
The Canfranc Underground Laboratory is operated by the University of Zaragoza under contract No. FPA2001-2437. This research was partially founded by the Spanish Ministry of Science and Technology (MCYT), the US National Science Foundation and the US Department of Energy. The isotopically enriched 76Ge was supplied by the Institute for Nuclear Research (INR), Moscow, and the Institute for Theoretical and Experimental Physics (ITEP), Moscow.
References
- [1] S. R. Elliot and P. Vogel, submitted to Annu. Rev. Nucl. Part. Sci. 52, [arXiv:hep-ph/0202264]. O. Cremonesi, Review Talk at NEUTRINO 2002, Munich, to appear in Nucl. Phys. B (Proc. Suppl.).
- [2] A. Morales and J. Morales, Review Talk at the XXXth International Winter Meeting on Fundamental Physics, Jaca, Huesca (Spain), 2002, Nucl. Phys. B (Proc. Suppl.) 114 (2003) 141, [arXiv:hep-ph/0211332].
- [3] T. Toshito et al., [the SuperKamiokande Collaboration], [arXiv:hep-ex/0105023]; Y. Fukuda et al., Phys. Rev. Lett. 82 (1999) 2644.
- [4] Q. R. Ahmad et al., [arXiv:nucl-ex/0204009]; Phys. Rev. Lett. 89 (2002) 011302.
- [5] C. E. Aalseth et al., Phys. Rev. C 59 (1999) 2108. D. González et al, Nucl. Phys. B (Proc. Suppl.) 87 (2000) 278. C. E. Aalseth et al, Phys. Rev. D 65 (2002) 092007.
- [6] H. V. Klapdor-Kleingrothaus et al., Nucl. Phys. B (Proc. Suppl.) 100 (2001) 309.
- [7] The Fast Fourier Transform and its Applications, E. Oran Brigham. Edited by Prentice-Hall Inc., 1988. ISBN 0-13-307505-2
- [8] V. Radeka. Ann. Rev. Nucl. Part. Sci. 38 (1988) 217-277.
- [9] C. Canali, G. Majni, R. Mindes, G. Ottaviani. IEEE Trans. On Elec. Devices. (1975) 1045. G. Ottaviani, C. Canali and A. Alberigi Quaranta. IEEE Trans. Nucl. Sci. NS-22 (1975) 192.
- [10] T. W. Raudorf, M. O. Bedwell, T. J. Paulus. IEEE Trans. Nucl. Sci. NS-29 (1982) 764.