A bolometric measurement of the antineutrino mass
Abstract
High statistics calorimetric measurements of the spectrum of 187Re are being performed with arrays of silver perrhenate crystals operated at low temperature. After a modification of the experimental set-up, which allowed to substantially reduce the background of spurious counts and therefore to increase the sensitivity on the electron antineutrino mass, a new measurement with 10 silver perrhenate microbolometers is running since July 2002. The crystals have masses between 250 and 350 g and their average FWHM energy resolution, constantly monitored by means of fluorescence X-rays, is of 28.3 eV at the end-point. The Kurie plot collected during 4485 hoursmg effective running time has an end-point energy of eV, while the half lifetime of the decay is found to be Gy. These values are the most precise obtained so far for 187Re. From the fit of the Kurie plot we can deduce a value for the squared electron antineutrino mass of eV2. The corresponding 90% C.L. upper limit for is 21.7 eV.
pacs:
14.60.Pq, 23.40.Bw,12.15.Ff,91.35.NmThe interest in direct measurements of the neutrino mass from the decay spectrum has been recently stimulated by the evidence of a non zero value of detected in searches on solar and atmospheric neutrino oscillations Fukuda et al. (2001); Ahmad et al. (2001); Nishikawa et al. (2002).
Limits on direct measurements of have been so far obtained by experiments with electrostatic spectrometers investigating the decay of tritium. Recent results Bonn et al (2002); Particle Data Group (2002), have set an upper limit of 2.2 eV at 90% C.L. These experiments are based on the measurement of the spectrum of the emitted electron. One cannot therefore exclude ”a priori” that the decay could partially occur on a excited state of the daughter molecule. This and other systematic effects have given in the past years a negative value for mν2. Even if now these problems seem to be almost completely solved we think it is important to carry out a measurement in a different approach.
Calorimetric measurements where all the energy released in the decay is recorded, appear therefore complementary to those carried out with spectrometers. In addition they allow to measure the entire decay spectrum, and can therefore test any possible distortion of the Kurie plot. A particularly suitable approach appears the bolometric one Twerenbold (1996); Booth et al. (1996) where detectors, operated at low temperature, include absorbers of a material containing the active nucleus. If the absorbers are diamagnetic and dielectric crystals their heat capacity can be very low, since it is proportional to the cube of the operating temperature. As a consequence even the tiny energy delivered by a particle can give rise to a measurable pulse in a suitable thermal sensor.
The present experiment is carried out on the first forbidden unique decay:
which is particularly promising Vitale (1985) due to its low transition energy (2.5 keV). In addition the large isotopic abundance of 187Re (62.8 %) allows the use of absorbers made with natural Rhenium. We note also that a precise direct measurement of the half lifetime of this decay ( 43 Gy) is of great interest in geochronology for the determination of the age of minerals and meteorites from their Re-Os abundance W.Herr and E. Merz (1955); L.Reisberg and J.P.Lorand (1995); Pearson (1999); S.B.Shirey and R.J.Walker (1998); O.Alard, et al. (2002). Measurements of the spectra of 187Re have been reported by the Genova group Galeazzi et al. (2001) with single crystals of metallic Rhenium and by our group Alessandrello et al. (1999) with an array of four crystals of Silver Perrhenate (AgReO4), a dielectric compound of Rhenium.
In this paper we report on new high statistics measurements carried out in two successive runs with arrays of ten crystals of AgReO4 with masses ranging from 250 to 350 g. These crystals are thermally coupled to thermometers made of doped silicon chips implemented by the ITC-irst institute in Trento and tested and calibrated at low temperature in Milan Alessandrello et al. (1999). Special care is put on the calibration of the energy scale and on the monitoring of the stability and performance of all detectors. This is achieved by means of the 5.9 keV K line of 55Mn and the fluorescence K lines produced by two 55Fe primary sources at 1.5, 2.6, 3.7 and 4.5 keV in Al, Cl, Ca, and Ti, respectively. During the runs all detectors are exposed to the fluorescence X-rays produced by the sources for 20 minutes every two hours to allow a continuous energy calibration. In a first run totaling 2354 hoursmg effective running time we have collected 187Re decays above an energy threshold of 700 eV.
The Kurie plot corresponding to the sum of all detectors was fit to the spectrum calculated by W. Buhring Buhring (1965). The end-point energy for 187Re was found to be eV. The systematic error is due to the uncertainties in the energy resolution, in the detector response function, in the shape of the background below the beta spectrum and in the theoretical spectral shape for the 187Re beta decay. We have also attempted to determine the half lifetime of 187Re, by precisely measuring the mass of all absorbers and the total counts from each of them.

There were however spurious counts which our Data Acquisition System could not eliminate. This did not allow to determine precisely the dead time of the measurement. As a consequence we could only assume that all the running time was effective, thus determining an upper limit of 45.1 Gy for the half lifetime of 187Re. No evidence was found for deviations from the calculated Kurie plot. The squared electron antineutrino mass was found to be eV2, where the systematic error has the same origin as for the end-point energy quoted above. A preliminary upper limit of 31.9 eV at 90 % C.L. could be set on the electron antineutrino mass. In this measurement the sensitivity on the antineutrino mass is mainly limited by the background of spurious counts, shown by the upper curve of Fig. 1. By means of a Monte Carlo simulation and of a dedicated measurement with the same set-up, but without the 55Fe primary sources, we found out that the background was mainly caused by the Internal Bremsstrahlung accompanying the 55Fe E.C. decay, with a branching ratio of % Firestone et al. (1998). Most of the peaks appearing in this spectrum are due to fluorescence in the copper of the detector holders and in a lead shield placed near the detectors.
As a consequence we decided to substantially change the calibrating set-up with a new system which automatically moves the sources in a massive shield of Roman lead Alessandrello et al. (1998). The consequent reduction of the background is shown by the lower curve of Fig. 1. The second run is being carried out in these improved conditions and with a new acquisition system which allows to precisely determine the live time of the measurement. A partially renewed array of 10 AgReO4 crystals with a total mass of 2.683 mg is running since July 2002. The data from two detectors, with poor resolution, are not included in our statistics: the corresponding effective total mass is therefore of 2.174 mg. The present analysis refers to five months of continuous run totaling 4485 and 1070 hoursmg of effective measurement and calibration times, respectively. The FWHM resolution of the 8 detectors at 1.5 keV (the Al K line) ranges from 21.2 to 28.7 eV with an average of 25.4 eV, while the FWHM resolution of the array extrapolated at the energy of the end-point (2.46 keV) is 28.3 eV. The 10 to 90 % risetime of the detectors is in the range 340 - 680 s with an average value of 492 s. The check of the stability of the gain, which we consider essential for a correct measurement of the Kurie plot, is shown for a typical detector in Fig. 2.

The Kurie plot obtained from the sum of all 8 detectors is shown in Fig. 3.
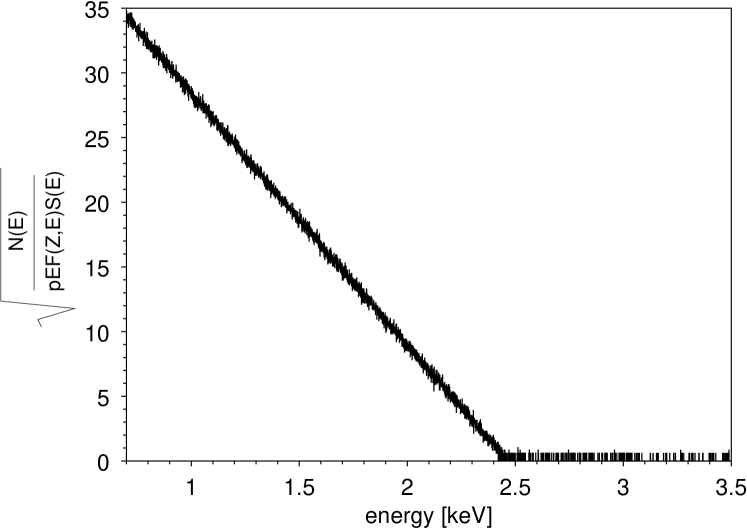
It corresponds to 187Re decays above the common energy threshold of 700 eV. As in the preceding run, we find no deviation from the above mentioned calculation of Buhring for the spectrum expected in absence of the neutrino mass. The measured value for the end-point is eV. The systematic error is again determined by the uncertainties in the energy resolution, in the detector response function, in the shape of the background below the beta spectrum and in the theoretical spectral shape for the 187Re beta decay. Due to the substantial absence of spurious counts we could precisely determine the effective decay rate from the distribution of the time intervals between two successive decays. The half lifetime is thus found to be years, where the statistical error is mainly due to the uncertainties in the measurement of the mass of the absorbers and the systematic error is due to the uncertainties in the pile-up discrimination. The values for the end-point energy and for the half lifetime are the most precise existing in the literature. The latter, as noted before, has considerable impact in geocronology.
The squared electron antineutrino mass is eV2, where the systematic error has again the same origin as for the end-point energy quoted above. The 90 % C.L. upper limit to the electron antineutrino mass is 21.7 eV. This result is in agreement with the expected sensitivity deduced from a Monte Carlo simulation of an experiment with the same statistical significance as our present data set. The limit on the electron antineutrino mass is not improved by a combined analysis of the two runs because of the substantial improvements in the new run, both on the statistics and on the background.
This result even if not yet competitive to those obtained with spectrometers has to be considered, in our opinion, complementary to them and show the potential of future bolometric measurements of the neutrino mass. As pointed out before it measures the total released energy and not only the electron one, unless long living metastable states are formed. In addition it allows to investigate over the entire energy range all possible deviations from the standard theory of beta decay. The measurement is still presently running, but improvements are planned, based on the use of better and more massive crystals and improved thermal coupling between them and the thermistors. A new experiment is planned based on a larger array and different and faster thermal sensors.
Thanks are due to C. Callegaro, R. Cavallini, G. Ceruti, R. Gaigher,
S. Parmeggiano, M. Perego,
and to our student L. Soma for continuous and constructive help in
various stages of this experiment. We also gratefully acknowledge contributions of
A. Alessandrello and L. Zanotti in the first stage of this search.
This experiment has been supported in part by the
Commission of European Communities under contract FMRX-CT98-0167.
References
- Fukuda et al. (2001) S. Fukuda et al., Phys. Rev. Lett. 86, 5651 (2001), and references therein.
- Ahmad et al. (2001) Q.R. Ahmad et al., Phys. Rev. Lett. 89, 011301 (2002).
- Nishikawa et al. (2002) K. Nishikawa et al., in Proceedings of the XXth International Conference on Neutrino Physics and Astrophysics, Munich, May 25–30, 2002, Nucl. Phys. B (to be published).
- Bonn et al (2002) J. Bonn et al., Nucl. Phys. B (Proc. Suppl.), 110, 395 (2002).
- Particle Data Group (2002) K. Hagiwara et al., Review of Particle Physics, Phys. Rev. D 66, 010001 (2002).
- Twerenbold (1996) D. Twerenbold, Rep. Prog. Phys. 59, 349 (1996).
- Booth et al. (1996) N. Booth, F. D. Cabrera, and E. Fiorini, Ann. Rev. of Nucl. Sci. 46, 471 (1996).
- Vitale (1985) S. Vitale, INFN internal report INFN/BE-85/2, (1985).
- W.Herr and E. Merz (1955) W. Herr and E. Merz, Naturforshung 10a, 613 (1995).
- Pearson (1999) D.G. Pearson, Lithos 48, 171 (1999).
- S.B.Shirey and R.J.Walker (1998) S.B. Shirey and R.J. Walker, Ann. Rev. Earth Planet Sci. 26, 423 (1998).
- L.Reisberg and J.P.Lorand (1995) L. Reisberg and J.P. Lorand, Nature 376, 159 (1995).
- O.Alard, et al. (2002) O. Alard et al., Earth and Planet. Sci. Lett. 203, 651 (2002), and recent references therein.
- Galeazzi et al. (2001) M. Galeazzi et al., Phys. Rev. C 63, 014302 (2001), also for previous references.
- Alessandrello et al. (1999) A. Alessandrello et al., Phys. Lett. B 457, 253 (1999), also for previous references.
- Alessandrello et al. (1999) A. Alessandrello et al., J. Phys. D: Appl. Phys. 32, 3099 (1999).
- Buhring (1965) W. Buhring, Nucl. Phys. 61, 190 (1965); private communication by prof. Buhring (1999).
- Firestone et al. (1998) R.B. Firestone, C. Baglin, and S.F. Chou, Tables of Isotopes (eight edition) CD-ROM update (1996).
- Alessandrello et al. (1998) A. Alessandrello et al., Nucl. Instrum. and Meth. B 142, 163 (1998), also for previous references.