Apparatus for a Search for T-violating Muon Polarization in Stopped-Kaon Decays
Abstract
The detector built at KEK to search for T-violating transverse muon polarization in () decay of stopped kaons is described. Sensitivity to the transverse polarization component is obtained from reconstruction of the decay plane by tracking the through a toroidal spectrometer and detecting the in a segmented CsI(Tl) photon calorimeter. The muon polarization was obtained from the decay positron asymmetry of muons stopped in a polarimeter. The detector included features which minimized systematic errors while maintaining high acceptance.
keywords:
Separated stopped beams; Decays; T-violation; Transverse muon polarization; Toroidal spectrometer; Muon Polarimeter; Scintillation fiber target; CsI(Tl) photon detector.PACS:
29.27.Eg; 29.27.Fh; 29.30.Aj; 29.40.Cs; 29.40.Gx; 29.40.Ka; 29.40.Mc; 29.40.Vj; 13.88.+e; 07.05.Hd; 11.30.Er; 12.60.-i; 13.20.Eb; 13.35.Bv(E246 KEK-PS COLLABORATION)
1 Introduction
Violation of time-reversal invariance (T) could be inferred from a weak interaction induced transverse polarization () of muons normal to the decay plane in the decays () and (). Standard Model (SM) contributions to are at about the level [1] and final state interactions in contribute at the level [2]. A measurement in excess of this has the potential to reveal new CP violation physics, given CPT invariance. The value of can be as large a – in models with multi-Higgs doublets, leptoquarks, left-right symmetry or SUSY [3]. Motivation to search for additional sources of CP violation arises from the observed baryon asymmetry in the universe, which cannot be explained by the CP violation in the Standard Model alone such as the SM T-violation observed in the neutral kaon system [4]. At the High Energy Accelerator Research Organization (KEK) in Japan, the E246 collaboration is completing a search for in at the level.
In 1999, the first result, , was published [5], based on good events from the data taken during 1996 and 1997, indicating there is no evidence for T violation. The T-violating parameter Im was then extracted as Im. The 90% confidence limits are given as and . Further data were collected during 1998 – 2000, and the final E246 sensitivity to in is expected to be corresponding to Im of about . Since statistics will dominate the sensitivity, the detector will have a capability to improve the sensitivity by a factor of 3–4 using a more intense kaon beam in the future. In this paper we give a description of the apparatus.
2 Experimental Method and Detector Overview
2.1 Principle of measurement
The measurement of the T-violating transverse muon polarization requires first that the detectable constituents of the decay with a branching ration of 3.2% be distinguished and that the decay plane be established from the kinematic parameters. Secondly, a polarimeter must be sensitive to the polarization component normal to the decay plane. For example, if events are selected whose decay plane includes the beam axis, then would appear as an azimuthal component of the polarization around the beam axis. The muon polarization is measured from the asymmetry of the decay positron angular distribution relative to the polarization axis.
2.2 Stopped beam method
In our experiment we used a stopped kaon beam in contrast to the previous search [6] which used the in-flight decay of a 4-GeV kaon beam. Although a low-momentum stopped-kaon beam risks a potential disadvantage of reduced kaon flux compared to the high momentum beam used for in-flight measurements, the stopped method offers several potential advantages in minimizing backgrounds and systematic uncertainties which compensate the reduced beam intensity, and can result in a measurement with improved overall sensitivity.
In a stopped-kaon decay, the kinematics can be determined with high resolution which allows a precise definition of the decay plane as well as powerful tools to reject backgrounds and reduce systematic instrumental sources of asymmetry. In our apparatus, muons are accepted in a range of polar angles around with respect to the beam axis and are momentum analyzed in one of the 12 gaps of a superconducting toroidal spectrometer magnet. The decay vertex is determined by tracking in scintillators and/or wirechambers of the charged incoming kaon and outgoing muon. The muon momentum is obtained with adequate resolution to reject the dominant decay modes () and (). The momentum is obtained from a high-solid-angle segmented CsI(Tl) calorimeter, and the kaon momentum is, of course, zero.
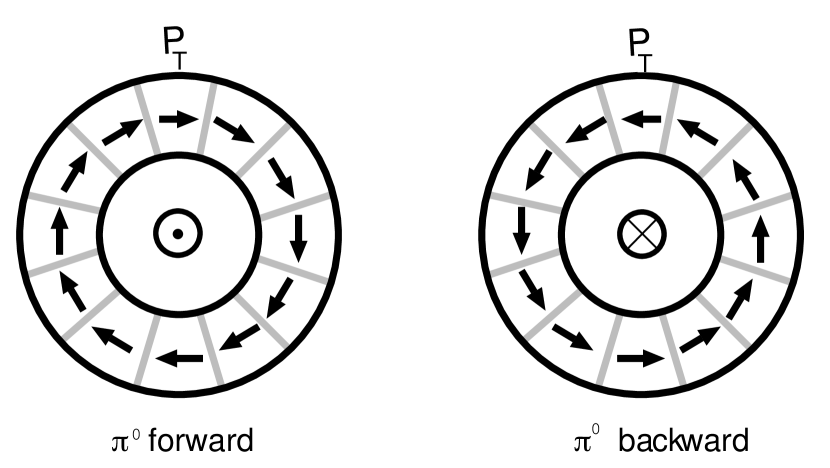
Good determination of the decay kinematics in the segmented calorimeter allows one to identify and include events in the muon polarimeter corresponding to both forward (downstream) and backward (upstream) going s, and events, respectively. The two classes of events give opposite asymmetries in the polarimeter due to as illustrated in Figure 1. That is, a properly normalized sum of - and -type events must give a zero asymmetry. In the previous in-flight experiment only a forward-decaying () was inferred from the forward boost from the rest frame and an energy threshold on one of the decay photons.
From the kinematics it is also possible to optimize the instrumental sensitivity to the physics parameter of T violation in this decay, . The value of varies by an order of magnitude over the phase space. A figure of merit combining the statistical sensitivity of the decay rate and peaks for energies above 50 MeV and energies below MeV, well away from the kinematic peak. The muon acceptance in particular can therefore be optimized to enhance the sensitivity to from .
2.3 Longitudinal field and double ratio method
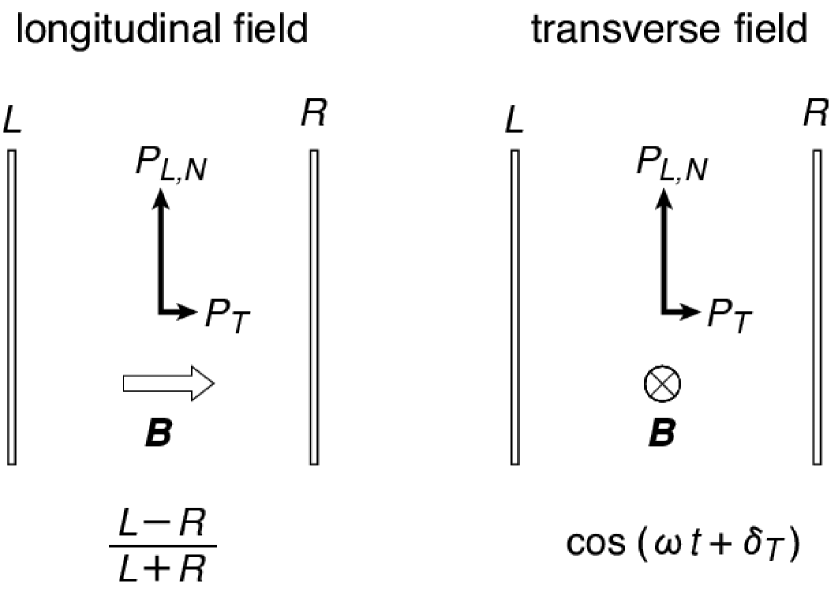
Instead of using the transverse field method which was adopted in the previous experiment[6] we adopted the longitudinal field configuration. In this case the transverse component of the muon polarization is held, and the non-T-violating in-plane components precess, while in the transverse field method the in-plane component parallel to the muon momentum is held and the T-violating component was sought as a possible phase shift of the precessing component. The comparison is shown in Figure 2.
In our apparatus the polarimeter is similar in general concept to that used in [6], except that the fringe magnetic field from the toroid is shimmed to produce an azimuthal field at the muon stoppers. Muons are stopped in an annular array of aluminum stoppers surrounding the beam axis. Positrons from muon decay are detected in scintillator arrays located azimuthally between the muon stoppers so that an asymmetry between clockwise, - and counter-clockwise, -decaying muons can be measured. In our case, the 12-segment polarimeter accepts muons exiting the gaps of the toroid and is located well removed from both the stopping target and beam axis where background rates can be reduced to a low level. This minimizes the problems of accidental rates in detecting the decay positrons and allows a long acceptance time for the muon decay (s) in order obtain higher statistical sensitivity and detailed determination of the background.
One advantage of using the longitudinal field method in the present experiment is higher statistical significance from a given number of positron events compared to a reduction of in the case of the precession measurement. Although usually it is problematic how to remove instrumental misalignment which gives rise to a spurious asymmetry effect in the longitudinal field method, in the present experiment such effects can be canceled out by taking the ratio of and pions.
would be indicated by an asymmetry between and decay positrons as
| (1) |
where is the effective analyzing power and is the kinematical attentuation relating the polarization axis to the decay plane.
Furthermore, it is possible to obtain the polarization from the double ratio
| (2) |
with a doubling of the sensitivity to . Several sources of potential systematic errors due to instrumental misalignments cancel out to first order in this double ratio. A direct measurement of the analyzing power can be obtained from the component, which is the in-plane component parallel to the pion momentum, by selecting events with a transverse decay. The field requires good mapping and stability, but it does not need to be reversed as did the axial field in the previous experiment [6]. This avoids potential systematic effects due to the reversing field itself as well as its effect on photomultiplier tube (PMT) gains.
2.4 Overall assembly
General assembly views of the apparatus are shown in Figure 3 as end and side views. Our detector’s three main analytical elements are the toroidal spectrometer, the CsI(Tl) photon calorimeter [7], and the polarimeter.
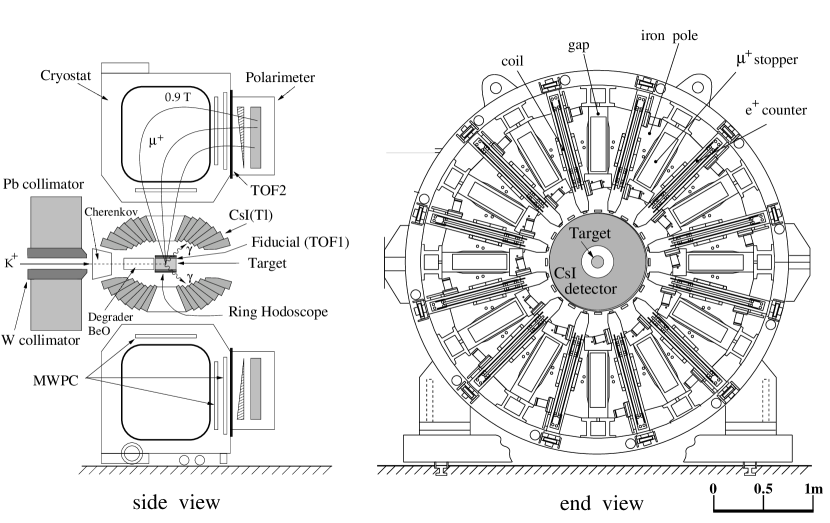
The space available for the CsI(Tl) array is limited by the 1-m inner diameter of the toroidal magnet and cryostat. The crystal length of 250 mm (13.5 radiation lengths) is adequate to keep shower leakage for photons up to 250 MeV acceptable while still allowing sufficient space for the PIN diode and preamplifier readout system. The crystal array has 12 holes aligned with the magnet gaps which provide the acceptance for charged particles in the spectrometer.
Two additional holes in the crystal array were required on the beam axis: The upstream hole allowed for the incoming kaon beam and instrumentation which included a Čerenkov detector, a scintillator hodoscope and a degrader. This hole had to accommodate not only the kaon beam phase space but also the six-times-higher pion contamination including an asymmetric halo around the kaon beam, which could result in unacceptable rates in the crystal elements near the beam axis. This problem was partially alleviated by a Pb and W collimator upstream of the apparatus. Downstream, the beam-axial hole provided access for the support and readout of the segmented stopping target assembly and inner tracking elements. The latter include the 12 close-packed fiducial counters used in the event trigger and for muon time-of-flight measurements, and a stack of ring scintillators and a cylindrical drift chamber both used for muon tracking.
The target size was matched to the measured kaon beam profile at the stopping location at the center of the toroid. It is necessary to minimize the target size to avoid excess mass in the path of exiting muons and photons from s, as well as to economize on the number of segmented elements in the target to be instrumented.
The polarimeter was mounted immediately downstream of the spectrometer to maximize acceptance for s in the 12 pure aluminum stopping arrays, and to take advantage of the shimmed fringe field of the toroid which serves as a holding field for . A wedge shaped copper degrader preceded each aluminum muon stopping array, and compensated for the momentum dispersion from the analyzing magnet so that all muons would come to a near uniform stopping depth. In addition to the stoppers and positron detectors, the polarimeter included several veto counters used to help identify good stopping muons and valid decays while rejecting backgrounds.
2.5 Acceptance optimization
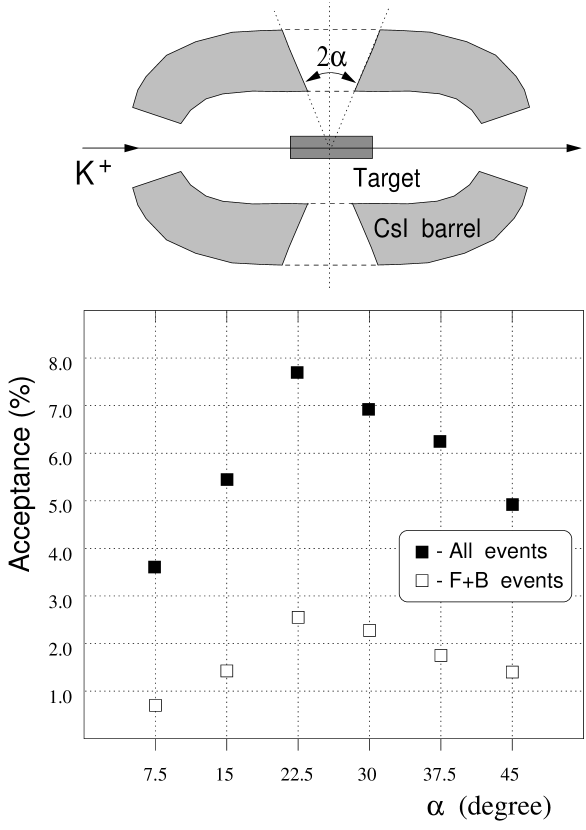
The first design goal was to simultaneously optimize the acceptance for s from in the 12 magnet gaps, and to maximize the acceptance for s in the CsI(Tl) calorimeter. This required careful matching of the 12 holes in the CsI(Tl) array to allow muons from the distribution of stopped kaons in the central stopping target to enter the magnet gaps and be accepted in the polarimeter at the magnet exit. A Monte Carlo study [7] lead to a design with 10% acceptance for s from , while maintaining 70% coverage for detection. Optimum overall acceptance of 8% was obtained for the angle of 22.5 degrees as illustrated in Figure 4.
2.6 Systematic error reduction by symmetry
Our apparatus is constructed with 12-fold azimuthal symmetry set by the 12-gap toroidal spectrometer magnet. The summation of events from the 12 spectrometer gaps contributes to the acceptance, and also allows additional capabilities to reduce systematic asymmetry effects due to the instrumentation and the kaon beam phase space. For example, each positron detector in the polarimeter serves as a counter for one gap and a counter for the neighboring gap, and an apparent asymmetry due to variations in counter efficiencies cancel. Similarly, asymmetries induced by an asymmetric kaon stopping distrubution also cancel in the azimuthal sum over 12 gaps. In this case also, since the decay vertex is determined event-by-event, residual higher order asymmetry can be tested for and corrected.
3 Beamline and Beam Instrumentation
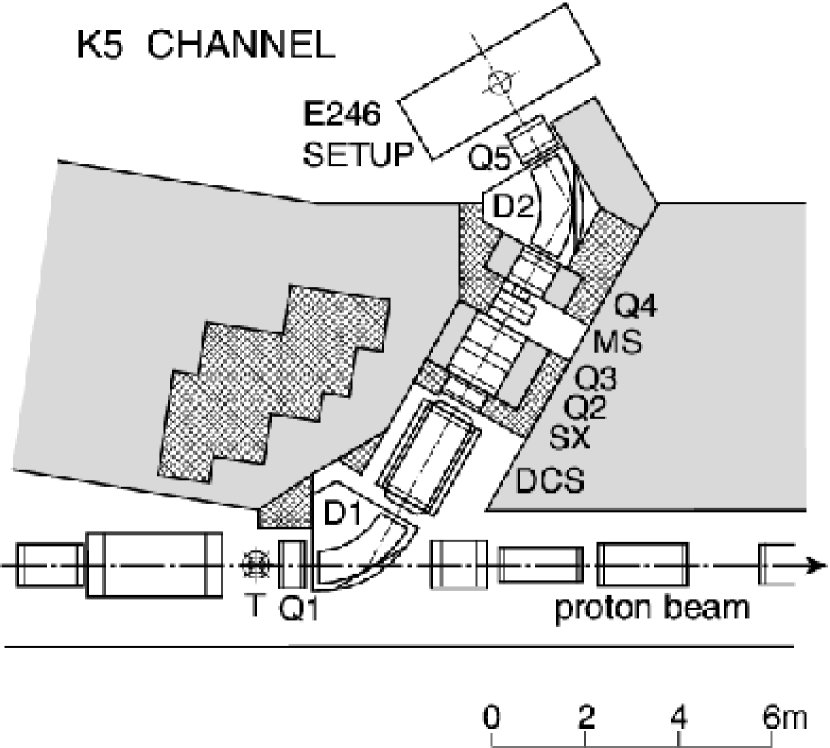
3.1 Low momentum beam line K5
The experiment was set up at the low-momentum separated kaon beam line K5 [8] in the North Hall of the KEK proton synchrotron. The layout of the beam line is shown in Figure 5 and the main parameters are listed in Table 1. This channel was originally designed for 550-MeV/ maximum momentum, but it was upgraded to 660 MeV/ for this experiment. It is equipped with a single-stage electrostatic separator (DCS) with an electric field of 50 kV-cm-1 and can deliver a beam with : ratio of 5 – 10 making a nearly achromatic spot on the experimental target.
| maximum momentum | 660 MeV |
|---|---|
| production target | 6(H)10(W)60(L)mm3 |
| take-off angle | degrees |
| solid angle | 10 msr (mr(H)mr(V)) |
| channel length | 12.5 m |
| momentum bite | |
| beam size on target | cm |
| dispersion on target | 0.28 cm/% |
| beam intensity | protons |
| ratio |
Secondary particles were produced at a 6(H) 10(W) 60(L) mm3 Pt target in the 12-GeV proton beam with a typical intensity of protons per pulse of 0.7-s duty with 3.0-s repetition. The secondary beam was collected at 0 degrees with a large solid angle of msr. Two bends D1 and D2 and a horizontal acceptance slit at the intermediate point selected the beam momentum bite. The slit serves also to reduce the intensity if necessary. The mass separation is done after the DCS at the vertical mass slit after the intermediate quadrupole doublet of Q2 and Q3. The last doublet of Q4 and Q5 focuses the beam on the target with a round spot. The momentum dispersion at the target is 0.28 cm-. The total length of the channel is 12.5 m.
In a Monte Carlo simulation it was shown that the optimum momentum to obtain the maximum kaon stopping rate in the fiducial region of our target was 700-800 MeV/ taking into account the momentum dependence of the kaon production cross section and scattering of the beam from the degrader. Accordingly, the maximum channel momentum of 660 MeV/ was chosen for the experiment.
Beam tuning was done to maximize both the number of stopped kaons and the : ratio as well as to realize a symmetric kaon stopping distribution in the target. Since the channel has only one stage of DCS, it was difficult to reduce pion contamination which arises from decay near the proton target. In addition, a pion beam halo made background hits in the CsI(Tl) calorimeter. In order to remove this halo a ray-tracing study was performed for kaons and pions identified separately by a Čerenkov counter and back-tracking the beam by means of a MWPC at the target position and a horizontal counter hodoscope placed after the mass slit. Rejection of the pion halo was realized by installing a beam slit inside the second bend D2. The typical beam intensity at 660 MeV/ of is per proton with a ratio of 6 – 7.
3.2 Beam collimation and degrader
Between the last quadrupole of the K5 channel and the beam Čerenkov counter a collimator system was inserted. It consists of a 45-cm thick lead wall with a rectangular hole with an additional insert made of Hevimet for shaping the beam profile. The thickness was determined so as to stop the 660-MeV/ halo pions. The shape of the insert was designed to transmit the kaon profile while also blocking the pion halo in the CsI(Tl) region. This collimator system cut the pion halo background by 70% while sacrificing only 15% of the kaon yield, and reduced the singles counting rate of the affected CsI(Tl) crystals drastically.
After passing through the Čerenkov counter the beam was slowed by a degrader system consisting of 65 mm of Al followed by 242 mm of BeO located close to the stopping target. The 100-mm diameter was enough to cover the beam profile. The use of light-element materials is essential to achieve high stopping power with minimum multiple scattering; in addition, using BeO near the target helped to reduce the interaction of photons from the target in the degrader while the use of Al further upstream served to reduce the cost. The combination of lengths was optimized for a stopping distribution centered in the 20-cm long fiducial region of the target. The broadening of the beam through the degrader was not negligible but acceptable.
3.3 Beam detectors
3.3.1 Čerenkov
In order to trigger on kaons in the beam, a Fitch type differential Čerenkov counter was employed [9]. Figure 6 shows the crossection side view and end view of the counter. Incident pions and kaons emit Čerenkov light in a 4-cm thick acrylic radiator with a velocity dependent emission angle. The index of refraction of the radiator is such that at our chosen momentum the kaon light emerges from the rear surface while the pion light is internally reflected and transmitted to emerge from the circumference of the radiator. Two circular arrays of PMTs are arranged so that the inner circle detects the pion light from the radiator circumference, and the outer circle detects the kaon light which is reflected by a curved mirror behind the radiator. Each array comprises 14 PMTs with a Winston cone in front.
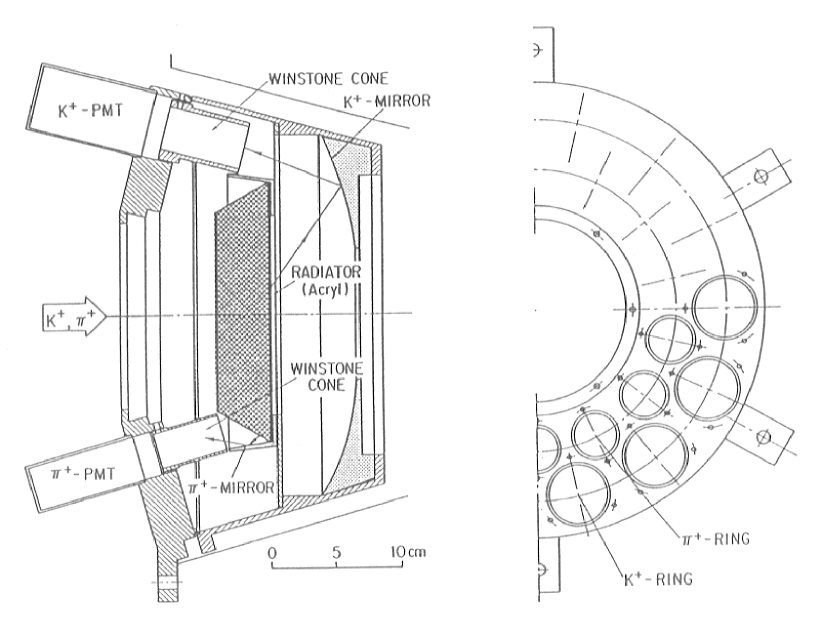
The configuration of the radiator, mirrors and PMTs was optimized to maximize the total number of PMT sensitive photons for incident beam momenta in the range 620 – 700 MeV/. Additionally, the design was constrained to minimize the thickness of the radiator to avoid excessive multiple scattering of the beam, to optimize its effective aperture to cover the whole beam, and to minimize overall dimensions in order to fit inside the entrance aperture of the CsI(Tl) array.
The number of PMTs was determined by the available room. The parabolic kaon mirror and kaon Winston cones were made of acrylic with a reflective coating of evaporated Al. The pion mirror was made of aluminized Mylar and the pion ring Winston cones were coated with white BaSO4. Preceding the experiment the basic characteristics of the counter were tested at the KEK 12-GeV synchrotron using a pion beam of the same velocity as the pions and kaons in the experiment. The effective radius with more than 90% detection efficiency was measured to be 6 cm. The main parameters of the counter are summarized in Table 2.
| kaon momentum range | 620 to 700 MeV/c |
|---|---|
| radiator material | acrylic () |
| radiator thickness | 4.0 cm |
| effective aperture | 12-cm diameter |
| beam angular tolerance | for cm |
| kaon ring | |
| PMTs | Hamamatsu R580UV 14 |
| Winston cone | 5.3 cm with Al coating |
| pion ring | |
| PMTs | Hamamatsu R1398 14 |
| Winston cone | 3.8 cm in diameter with BaSO4 coating |
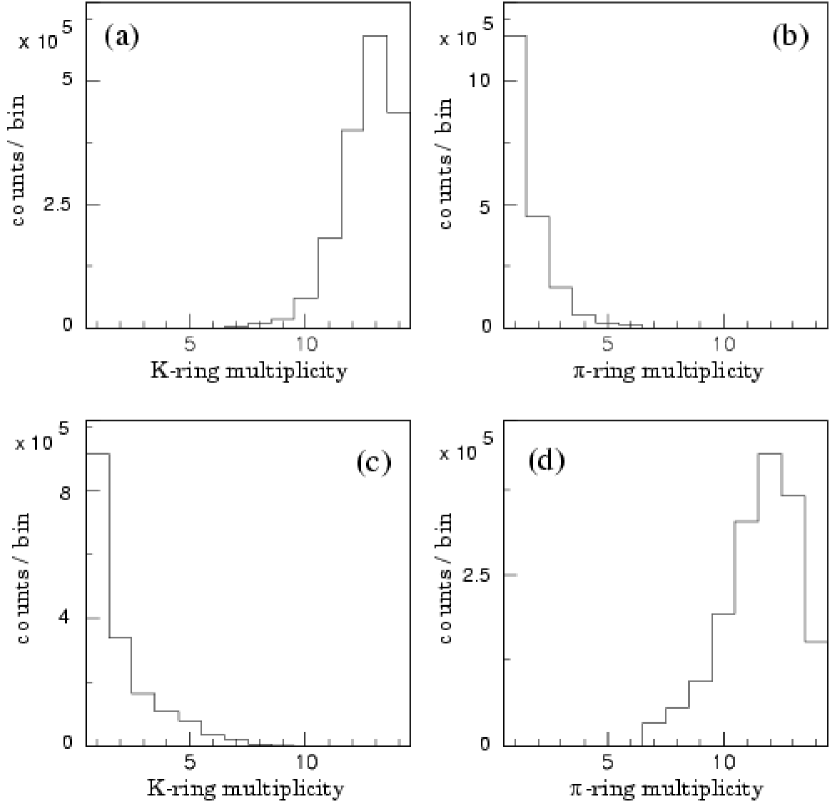
For the online trigger, the multiplicity of each PMT ring was used. The trigger condition was investigated in a test experiment by identifying particles using time-of-flight. Figure 7 shows the typical multiplicity spectra of both rings for both kaons and pions incident. In normal operation the kaon trigger threshold was set to multiplicity of with a trigger efficiency of more than 99%. The probability of mis-identification of a pion as a kaon was less than 1% under the typical beam intensity conditions.
3.3.2 Hodoscope
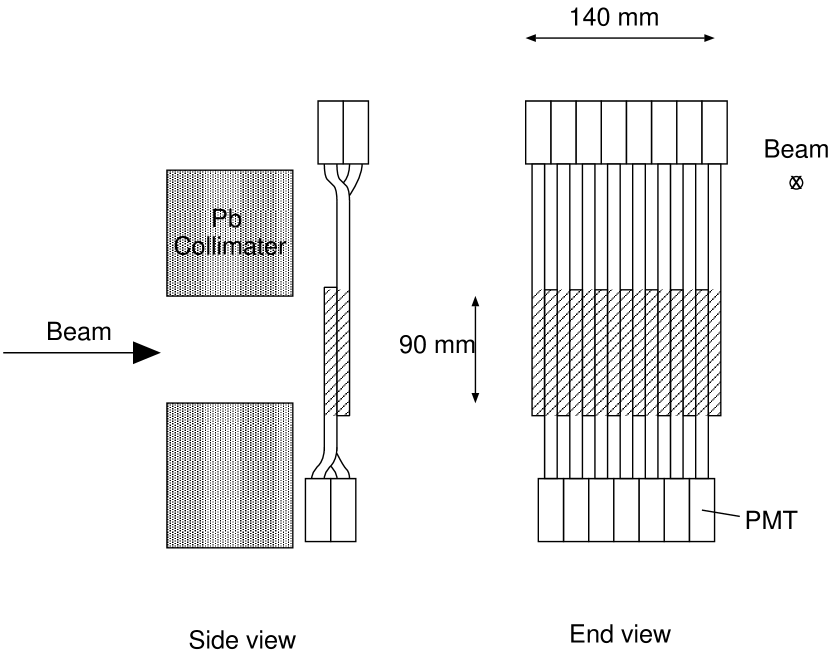
The B0 hodoscope shown in Figure 8 was placed downstream of the Pb collimator, and is an assembly of 22 plastic scintillating counters. and beam profiles were obtained in coincidence with the Čerenkov counter. The beam profile was monitored to check the stability of both the primary proton beam and the secondary particle beam. The trajectories of beam particles were also obtained by using the entrance position determined by the active target.
Timing data of charged particle hits in the B0 hodoscope were recorded by multi-hit TDCs during the gate for the decay. Hits in the polarimeter positron counters in time with B0 formed part of the constant background in the decay spectra related to beam particles and were rejected by vetoing on coincident events in the B0 hodoscope.
4 Charged Particle Measurement
4.1 Component overview
Several detector elements were used to measure charged particles from the decay of stopped kaons. The main functional goals of this system are particle identification and kinematic reconstruction using time-of-flight (TOF) and tracking through the magnetic spectrometer before entering the polarimeter.
In the central region, the segmented active target gave the lateral coordinates () for the stopping position and decay vertex of the kaon as well as the initial track of exiting charged particles. The fiducial counters surrounding the target provided the initial trigger information and the start for the TOF measurement. Immediately outside the fiducial counters, the ring hodoscope gave the first axial () track coordinate before passing through the gaps in the CsI(Tl) calorimeter to enter the toroidal spectrometer. A cylindrical drift drift chamber (C1) just outside the ring hodoscope gave additional tracking information. At the entrance and exit of each spectrometer gap were sets of planar wire chambers (C2, C3, C4) which gave the necessary coordinates for momentum analysis. Finally, the charged particles entered the polarimeter by passing first through the second time-of-flight counter (TOF2) and then a defining polarimeter trigger counter (PL).
4.2 Target and ring counters
4.2.1 Active target
A segmented active target identified the stopping kaon and its decay vertex, and provided the initial tracking information for the decay muon as well as an energy-loss correction to the momentum measurement in the spectrometer. The segmentation level is a trade-off between position resolution and rate handling from fine segmentation on the one hand, and energy and timing resolution from minimum ionizing decay muons and lower cost from coarse segmentation on the other hand. Based on studies of scintillating fibers of various sizes as well as from the experience with the target used in the E787 experiment at Brookhaven [10], we chose an array of mm2 Bicron BCF-12 fibers.
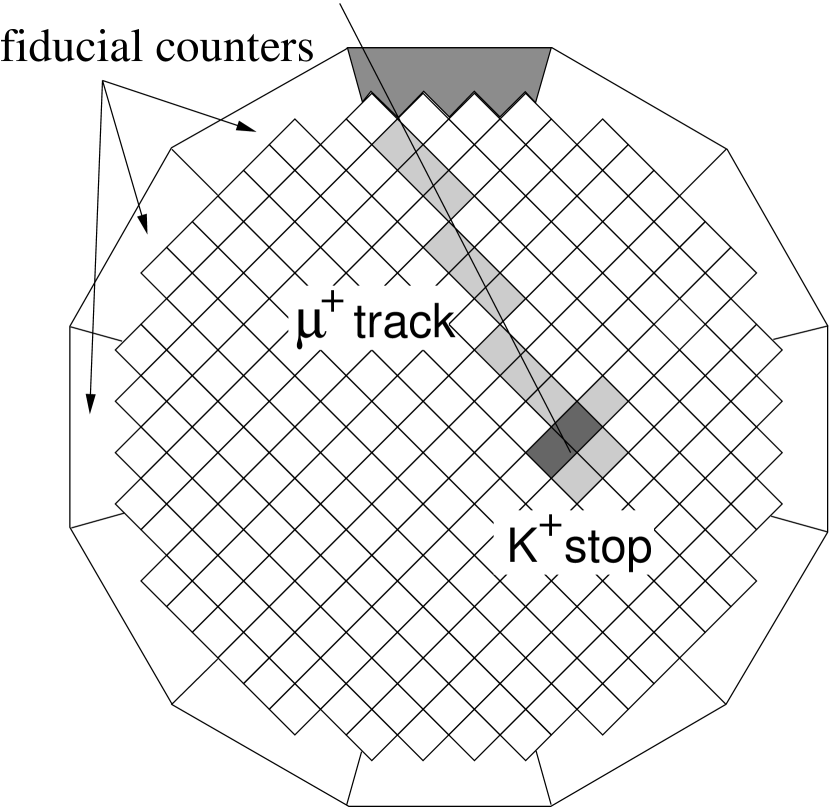
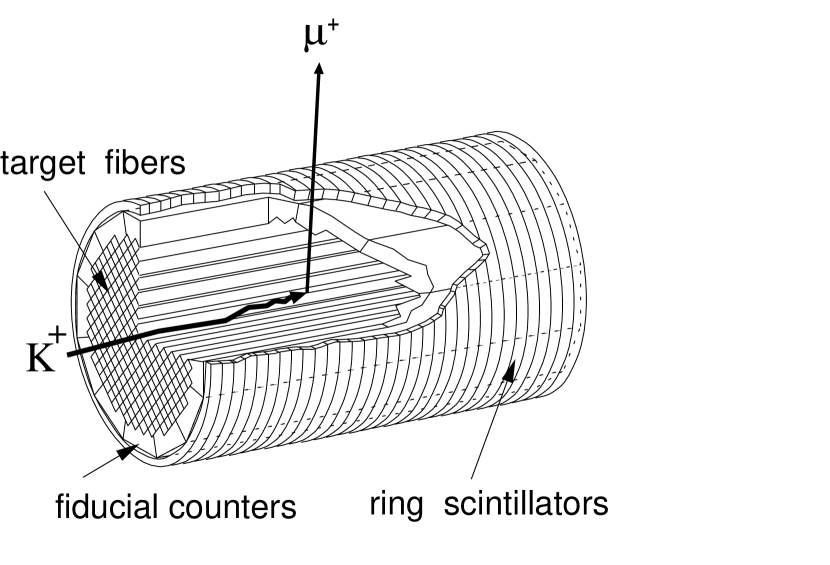
The radial extent of the target was optimized to match the kaon beam profile, while minimizing the material to be traversed by exiting decay muons and photons from s. The optimum was a 9-cm diameter array of 256 fibers shown in Figure 9. The 45∘-diagonal orientation was chosen to maximize the vertical moment of inertia of the individual fibers to resist sagging under gravity, since the array is cantilevered from its support downstream of the active center region of the detector.
In order to determine the target stopping efficiency with respect to incident kaons several measurements with a special trigger consisting only of the kaon Čerenkov counter were carried out. The efficiency was 38% for kaons identified in the target as events with a large energy deposit in one fibre ( MeV) normalized by the number of triggers. The same efficiency was obtained when the 3-cluster events in the CsI(Tl) detector were taken into account. The stopping efficiency of 38% was consistent with preliminary estimations () based on the beam profile and target dimensions.
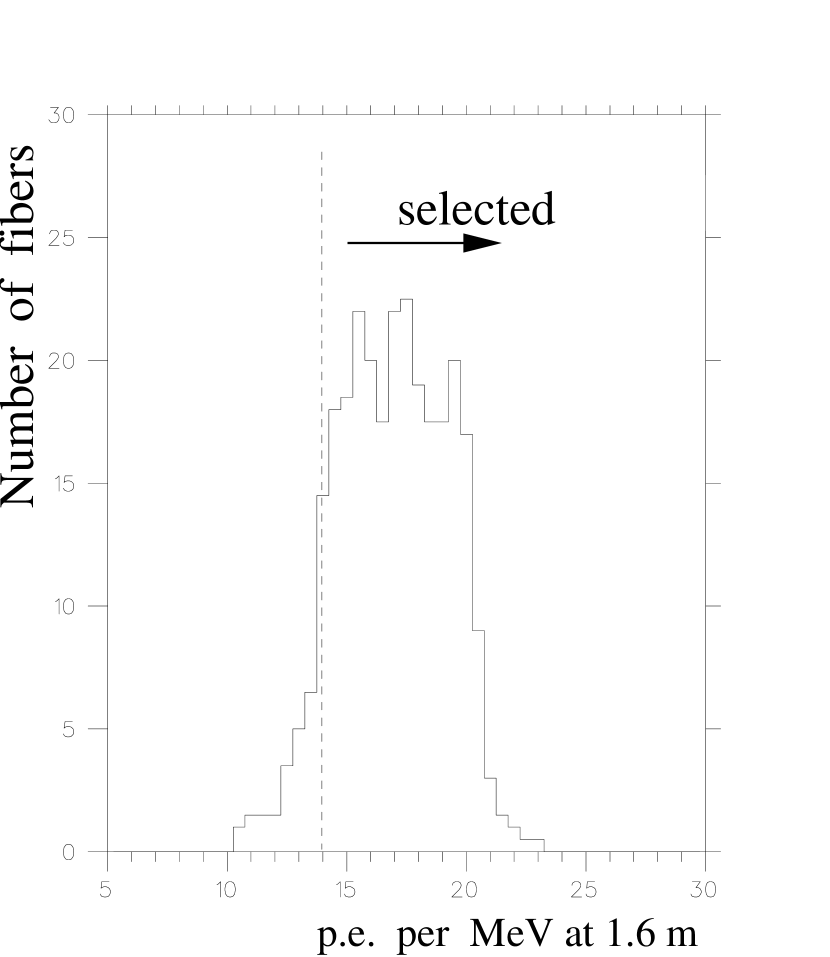
After selection for crossection dimensions and lack of “pin cushion” distortion, one end of each 2-m long BCF-12 fiber received from Bicron was machined with a diamond cutter to be coupled to a PMT in a test setup where scintillation light output and attenuation length were measured. The measured attenuation lengths of most fibers fell in a range 200 – 400 cm, however the parameter of practical concern is the light output in photo-electrons per MeV (p.e./MeV) measured at a fixed distance of 1.6 m from the PMT, which approximated the conditions in the actual target. The distribution is shown in Figure 10 for the 282 fibers measured. Fibers with a minimum light yield of 14 p.e./MeV were accepted for the target with an average for the 256 target fibers of 17.3 p.e./MeV. It was found that changing the PMT coupling from an air gap to a silicone gel coupling increased the light output by 12%. Nevertheless, since the light output was adequate with an air gap, this simpler arrangement was adopted in the target assembly.
The selected fibers were then diamond machined to the finished length of 185 cm, and spiral wrapped with 6.4-m aluminized mylar. The main purpose of the mylar wrapping was to protect the fibers in the target array and to avoid the possibility of light cross talk between fibers. Wrapping with white teflon tape was also investigated but neither material produced a significant improvement in the light output. This can be largely attributed to the air gap coupling to the PMT which preselects light rays with near normal exit angles and thus shallow angles of reflection propogating in the fiber, where the dominant effect is internal reflection at the fiber cladding and not the outer surface.
Figure 9 also shows the close-packed fiducial counters surrounding the fiber array. These counters will be discussed further in Section 4.5. The array of target fibers and fiducial scintillators/lightguides was assembled in a jig and the active end was wrapped to form a rigid light tight “log”. The position of each fiber in the array was documented so that balancing of higher-gain PMTs with lower-light-yield fibers was possible. The “log” was then clamped in a support collar from which the active end of the target array was cantilevered in the final assembly. The opposite ends of the fibers were free to fan out to individual PMTs (Hamamatsu H3164PX MOD).
Two support assemblies are attached to the support collar. One extends below to a base which slides on a track allowing the target to be positioned and aligned in the detector and easily moved for access to other systems. The other support consists of six struts which hold the PMTs mounted on a facetted plate approximating a section of a spherical surface, where the fibers are fanned out to the PMTs. The facetted plate is also mounted on the sliding base.
The 256 PMT signals from the target fibers were fed to custom made postamplifier-discriminator modules housed in a TKO crate. The postamplifiers had a ten-fold gain output delayed by a built-in hybrid circuit for 100 ns. The analog output fed the ADC and the output of an incorporated leading-edge discriminator was used for the TDC.
Figure 9 illustrates the on-line display of a typical event showing the cluster of fibers hit by the stopping kaon, and the track from the exiting decay muon. The decay vertex in the plane perpendicular to the beam axis is obtained from the target scintillating fibers with an accuracy of = 1.4 mm. The main parameters of the target are summarized in Table 3.
| Target parameters | |
|---|---|
| number of elements (fibers) | 256 |
| scintillator type | Bicron BCF12 |
| fiber dimensions | mm3 |
| array “diameter” | mm |
| light yield (av.) | p.e./MeV (MIP) |
| PMTs | Hamamatsu H3164 PX MOD |
| PMT – fiber coupling | air gap |
| Ring parameters | |
| number of elements (rings) | 32 |
| scintillator type | Bicron BC408 |
| WLS type | Kurraray Y11 ( 1-mm diam.) |
| ring dimensions | ID 118 mm, OD 128 mm, -thickness 6 mm |
| light yield (typ.) | 46 p.e./MeV (MIP) |
| PMTs | Hamamatsu R580-17 |
| PMT – WLS coupling | optical grease |
4.2.2 Ring counters
The coordinate along the beam axis (-coordinate) was recovered with the hodoscope surrounding the target and fiducial counter assembly. The design is a cylindrical array of plastic scintillator rings employing wavelength-shifting fiber readout [11]. The hodoscope parameters were optimized to obtain high efficiency for detection of minimum ionizing particles (MIPs) in the high rate environment, and to achieve better than 2-mm spatial resolution. The main parameters are summarized in Table 3.
A schematic view of the ring system is shown in Figure 11. The rings of 118-mm inner and 128-mm outer diameters were cut from 6-mm thick BC408 scintillator sheet using a diamond cutter. The 5-mm radial ring thickness was a compromise between high light output and minimal additional material causing particle scattering and photon conversions.
Scintillation light is trapped inside the ring by using a highly reflective wrapping until it is captured by the WLS fiber. Since the light is susceptible to inevitable losses before entering the fiber, the optimization requires high reflectivity at the scintillator-wrapping boundary, high transmittance at the scintillator-fiber boundary, and large geometrical acceptance of the fiber. The first factor is dependent on the wrapping and scintillator surface treatment, while the second is determined by the optical couplant, the surface quality in the contact area and the ratio of refractive indices between the scintillator and fiber.
The spectral matching of multi-clad Kuraray Y11 WLS fiber in combination with Bicron BC408 scintillator provides high light yield [12]. The Y11(K27) emission peak of 495 nm is shifted to 510 nm after the light travels 1.5 m through the fiber to the PMT. A fiber with a diameter of 1.0 mm was chosen as a reasonable compromise between light output and fiber flexibility. To increase the geometrical acceptance, the fibers are placed in spiral grooves machined into the outer circumference of the scintillator rings and glued using a colorless silicone adhesive SE777111Toray Dow Corning Silicone, Japan..
The two 1.3-m long ends of the fiber were inserted into a light-tight flexible tube and the tips were glued into an acrylic holder. After gluing the fiber into the holder its ends were cut off and polished. The holder provides a mechanical fiber-phototube interface and accurately controls the perpedicular alignment between the fiber axis and the PMT window. The supporting acrylic also prevents any erosion or chipping of the fiber edge.
The 32 ring-fiber assemblies were positioned on a support cylinder made of 0.5-mm thick G10 sheet. The rings are interleaved with aluminized mylar to prevent light crosstalk. The wrapping material causes a 0.30-mm gap between neighboring rings which resulted in a dead fraction of 4% for the hodoscope. The hodoscope outer diameter is limited by the available space requiring that the fibers be bent and held with adhesive tape to the detector surface using a minimum 2-cm bending radius to route the fibers downstream of the target to the PMTs. The assembled detector was shielded by a protective outer cylinder wrapped with black light tight tape. After installing the hodoscope and fiber readout “tails” onto the target, the acrylic holders were attached to the Hamamatsu R580-17 phototubes using high-viscosity optical grease.
4.3 Superconducting spectrometer magnet
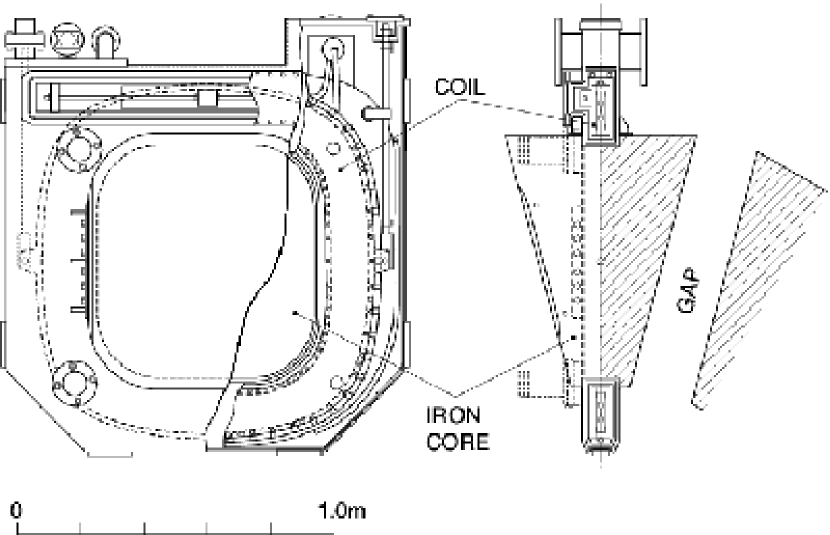
The heart of the muon spectrometer is a superconducting toroidal magnet with 12 iron sectors separated by 12 gaps [13]. Each iron sector is magnetized by a superconducting coil, and a field up to 1.8 T can be excited across the 20-cm uniform gaps. At a field strength of 0.9 T used for this experiment the field is nearly completely dipole with a slight toroidal component superposition. Charged particles from the target located in the center of the magnet are bent by degrees and tracked by MWPCs at the entrance and exit of the gap. One sector of the magnet is illustrated in Figure 12.
In manufacturing the magnet special care was taken to assure the dimensional accuracy necessary for high precision experiments. Each iron core was machined with a precision of 50 m. The positioning of the superconducting coil relative to the core to form a sector was achieved within an accuracy of 2 mm. Assembly of the entire structure was performed using a special positioning device ensuring a rotational symmetry of 30 degrees. The 12 median planes of the gaps converge to a virtual central axis with an accuracy of 0.3 mm. The difference of the diameters in the horizontal and vertical directions is less than 2 mm over a diameter of about 4.0 m.
As a superconducting magnet this device is unique in its structure. The coil windings are NbTi monolith stabilized by Cu operated at about half of the critical current density at 4.5 K at the maximum excitation. The windings are cooled indirectly by two-phase He flow through one turn of cooling channel around the windings.
The twelve coils are connected in series and equal field distributions are generated in the 12 gaps. A power supply with stability of is used. Because high quality magnet steel was used for the cores, there is no significant hysteresis in magnetization. Nevertheless, a definite excitation cycle from 0 T up to 0.9 T and from 0.9 T down to 0 has been followed for the E246 experiment in order to assure the reproducibility of the field strength.
The field map necessary for tracking was calculated by using a 3-dimensional code TOSCA[14]. The validity of the map could be checked from the measured monochromatic momentum spectra of muons from and pions from .
4.4 Tracking chambers
Charged-particle tracking through the spectrometer is crucial in rejecting other kaon decay modes such as and () by momentum measurement, and in fixing the kinematics of for the determination of the decay plane.
To meet these objectives the tracking chambers needed to have position resolution better than 500 m in sigma in the direction parallel to the magnet pole. They must also be able to measure the position of particles with steep incident angles (maximum 40∘), and have the capability to operate in the non-uniform magnetic fringe field of the toroid up to 4 kG.
4.4.1 C1
Before the ring hodoscope was installed, the first tracking element outside the active target/fiducial counters was an annular cylindrical drift chamber, C1. It consisted of four layers of drift cells with a central anode wire in each, between cylindrical cathode planes at the inner and outer radii of the annular cylinder. The anode signals from the drift cells provided additional () coordinates outside the target, and were also able to detect photon conversion in the outermost layers of the target.
The cathode planes were etched to form spiral strips, with the inner and outer planes of opposite pitch, so that a measure of the axial track coordinate , was obtained from the induced charge distribution from the inner- and outermost drift cell layers. Under the conditions of high intensity beam operation, the high rate experienced so near the stopping target proved the ring counter hodoscope (Section 4.2.2) to be more reliable in extracting the coordinate rather than the C1 cathodes.
4.4.2 C2, C3 and C4
Sets of three planar multiwire proportional chambers (MWPC) were installed at each magnet gap. One MWPC was installed at the entrance of the magnet gap (C2) and two were installed at the exit (C3 and C4).
These MWPCs utilize cathode readout in order to save readout space around the chamber and to offer high position resolution in the non-uniform magnetic field. Each chamber has two sets of cathode planes: one for the azimuthal (or ) coordinate and the other for the polar (or radial) coordinate. The 20 m-diameter Au-coated W anode wires run with 2-mm spacing parallel to the magnet gap median plane in order to provide higher position resolution for the cathode plane measuring the most sensitive coordinate for the momentum reconstruction. The cathode strips running perpendicular to the anode wires, are 9-mm wide, spaced 1-mm apart and consist of an 18-m thick Cu coating on Kapton foil. The half-gap between the anode and the cathode planes is 6 mm.
A schematic view of the MWPC is shown in Figure 13. Given the spatial constraints near the gap, one important feature (in partuicular for C2) is the thin Al frame which maximizes the sensitive area in the space available.
The chambers were operated in proportional mode with a 50:50 Ar:ethane gas mixture. The three chambers in each gap are connected in series with a gas flow of 30 cc-min-1 from the gas circulating system. The main parameters are summarized in Table 4.
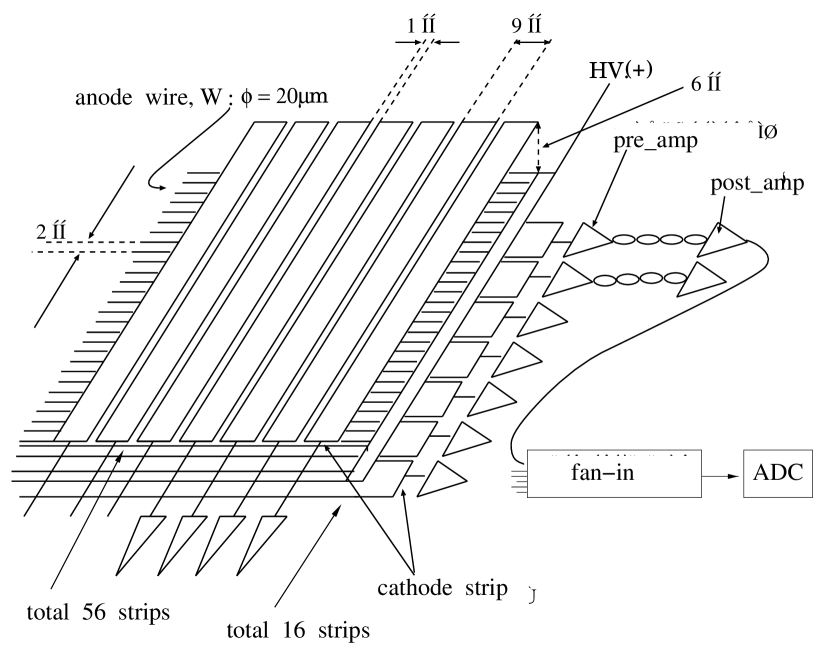
| anode wires | 20 -diameter Au-coated W |
|---|---|
| anode pitch | 2 mm |
| half gap | 6 mm |
| cathode strips | 9-mm width with 1-mm spacing |
| effective area | |
| C2 | cm2 |
| C3 | cm2 |
| C4 | cm2 |
| gas mixture | Ar:ethane 50:50 |
| readout | x,y cathode strips |
Signals from each cathode strip were amplified in two stages. The first was the preamplifier mounted on the MWPC which drove the cable going into the counting house where the signal was further amplified by the main amplifier. After the main amplifier, charge information of each cathode was digitized in an ADC, after being multiplexed with signals from six chambers into one output in order to reduce the number of ADC channels.
The MWPC hit position was obtained using the “charge-ratio method”[15]. In this method, the analog signals of three strips — the strip with the maximum charge and the two adjacent strips — are used. Using data, the value
| (3) |
is calculated, where , , are the maximum induced charges in the three strips, and tabulated. The hit position is then estimated by table lookup of values of determined for 2-m steps across the 10-mm wide strip pitch using the induced charge distribution as in eq.(3).
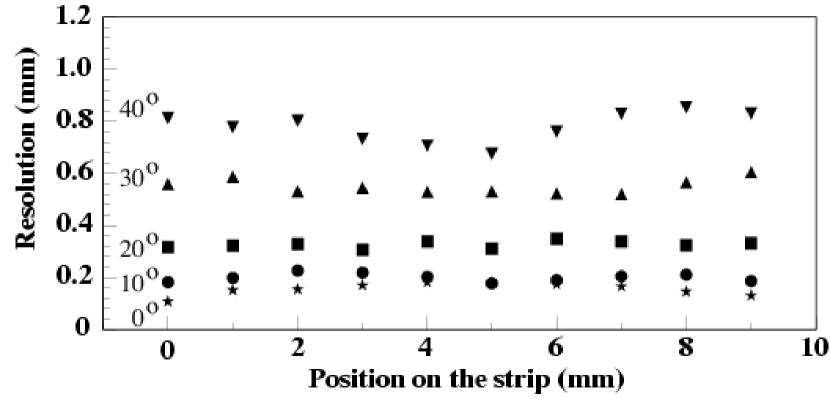
Using the charge-ratio method there are two major problems which cause systematic shifts of the reconstructed position. One is caused by oblique incident particles. In our case the incident angle could be as large as 40∘. In such a steep incident angle, the gas multiplication is no longer point-like. Rather, it is distributed on the anode wire along a limited path. As a result, the induced charge distribution differs from that in normal incident tracks. To manage the oblique incident case, charge-ratio tables for various incident angles were prepared and used in the analysis. This treatment reduced the systematic position shift from 600 m to 50 m. The position resolution () was measured as a function of incident angle and is shown in Figure 14.
The other problem is caused by non-uniformity of the amplifier gains. From test results the maximum fluctuation of the gains was as large as 20 and would result in a 500 m systematic shift in the reconstructed position. To minimize this effect, gain calibration using ADC pedestal information was applied for each amplifier channel[16]. Using the calibration, the hill-valley structure seen in the reconstructed position caused by non-uniform amplifier gain was removed and the overall position resolution was improved about a factor of two.
4.4.3 Gas recycler
The recycler was designed to provide gas flows up to 3.5 -min-1 with recycle ratios from 0% to 100%. Reusable active filters in the system reduce water vapor and oxygen concentrations to below 5 ppm. A schematic diagram of the system is shown in Figure 15.
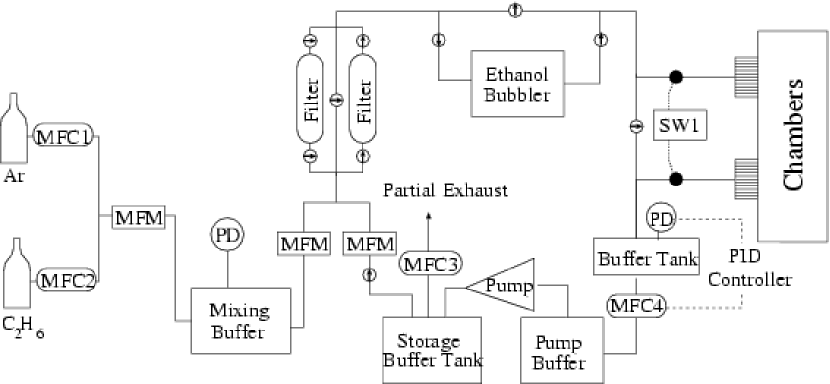
Mass flow controllers (MFCs) are set to deliver argon and ethane to prepare the required mixture at a high flow rate( 5 -min-1 Ar/ethane 50:50). The flow of the mixture is monitored by a mass flow meter (MFM) and the mixed gas flows into a mixing buffer. The pressure of the mixing buffer measured by a pressure transducer (PD) controls the MFCs, i.e., the MFCs are turned on whenever the pressure in the buffer falls below the lower set point and are turned off when the pressure rises above the upper set point.
The gas supplied from the mixing buffer combines with the recirculated gas from the pump and flows into one of two filtration cartridges. Each cartridge contains one third 4-Å molecular sieve to remove water, and two thirds BASF R3-11 activated copper for removal of oxygen. A particulate filter removes all particulates larger than 2 m. After filtration the gas flows through the temperature-controlled (typically -15 C) ethanol bubbler which adds ethanol if there is too little in the gas stream and removes ethanol if there is too much.
The gas then flows through a manual valve and a solenoid valve to the distribution rack. To protect the chambers from excessive over or under pressure, the solenoid valve will automatically close if the pressure measured by the pressure transducer moves beyond the preset upper and lower set points.
The returned gas from the chamber distribution system flows to a return buffer tank. The pressure with respect to atmosphere at this point is controlled by a pressure transducer, PID controller, and mass flow controller and remains constant at the preset value of the PID controller.
The distribution rack allowed the gas supplied from the recycler to be partitioned into 17 separate gas circuits, then recombined into a single return flow back to the recycler. Manual flowmeters (rotameters) and mass flow controllers were used to control and measure supply flows in each circuit, and mass flow meters measured return flows from the chambers.
Gas contamination was checked periodically with a gas chromatograph222Shimazu Model GC-4C, Kyoto, Japan.. When a filter was saturated and no longer able to absorb oxygen, a regenerated one was put into service by redirecting the gas, and the saturated one was removed for regeneration in a controlled heating cycle in an H2/N2 gas flow.
4.5 Time of flight counters
Charged particles were identified by measuring time of flight () between the fiducial counter next to the target (see Figure 9) and the TOF2 counters placed at the exit of the magnet gaps, just behind the C4 chambers, as shown in Figure 3. Ideally for measurement, scintillation light should be collected from both ends of the scintillator to cancel the time jitter due to the light propagation time. However, the fiducial counters are restricted to one-side readout because of limited space around the target. Therefore, we had to correct for the time walk related to the particle hit position. The 20-cm axial length of the fiducial counters was chosen to match acceptance of the spectrometer and the stopping distribution of the 660-MeV/ kaon beam with momentum spread of .
The size of the TOF2 counter was 20 cm in width, 2 cm in thickness, and 80 cm in length. The scintillation light was read from both ends. Since there was a relatively strong fringing field at the exit of the toroidal magnet, the phototubes had to be located remotely ( cm from the scintillators). The scintillation light was reflected once and transported to the phototube (Hamamatsu H1161) through acrylic light guides. Output signals of the fiducial counters and TOF2 counters were split by an analog divider to feed the leading edge discriminator and the charge ADC. For timing adjustment, the discriminator output signal was delayed and fed to 25-ps bin TDC.
The hit time for the TOF2 counter () was defined as the mean time measured by both phototubes, while the time for the fiducial counter () was corrected to give
| (4) |
where is the particle hit position and is the speed of light in the plastic counter used to apply the photon propagation time correction. The value of =18 cm-ns-1 was obtained in a test experiment. A time-walk correction of the leading edge discriminator was also applied. The actual between the fiducial and TOF2 counter was obtained using an offset term to account for fixed relative time differences between the counters.
| (5) |
The offset term, , was calibrated using the mono-energetic charged particles of and from Kπ2 and Kμ2 decay. In these decays, the particle identification could be done by analyzing their momenta, and therefore an actual was calculated by using the information on flight path length and momentum. Then, the velocity ratio of and mass squared of the charged particle () were deduced as,
| (6) |
where is the flight length and is momentum of the charged particle. Figure 16 shows a typical spectrum integrated for all momentum regions. The timing resolution is approximately 270 ps which is adequate to separate Kμ3 and () decays.
| flight path | 2 m (typical) | |
|---|---|---|
| TOF resolution | 270 ps () | |
| Fiducial-TOF1(start) | TOF2 (stop) | |
| scintillator type | Bicron BC408 | Bicron BC408 |
| PMT | Hamamatsu H3171-03 | 2 Hamamatsu H1161 |
| dimensions | mm3 | mm3 |
| ∗ irregular (see Figure 9) | ||

5 Photon Detector
The photon calorimeter was segmented into 768 CsI(Tl) crystals covering a large solid angle surrounding the kaon stopping target of approximately 70% of sr in order to measure the from decay with high acceptance. The detector was optimized for the photon energy range of 10 – 250 MeV and the high degree of segmentation provided good kinematic resolution for the s. In order to reject background from other beam-associated accidentals, good timing resolution is necessary. The very limited space in the central part of the spectrometer magnet required a compact design with a read-out technique immune to the significant fringe magnetic field. Details of the system have been described in ref. [7] and [17]. In this section the basic features are summarized.
5.1 Barrel structure
Figure 17 shows the crystal arrangement in the detector. It has a barrel structure with two holes on the beam axis, and 12 azimuthal holes for muons to enter the spectrometer magnet gaps. The optimization of the crystal array to maximize overall acceptance was described in Section 2.5, and the diameter of the beam-axis holes was determined so as to accommodate beam instrumentation upstream, and the target and central tracking assembly downstream.
The whole structure is upstream-downstream symmetric. Around the target in the center of the barrel, the inner diameter is 40 cm and the outer diameter is 100 cm. There are 10 different crystal shapes (see Figure17) used as a function of the polar angle position. The angular segmentation is 7.5 degrees in both the polar and azimuthal directions except for the crystals nearest the beam axis (Type 10). The axis of each crystal points to the center of the target and has a length of 25 cm corresponding to 13.5 radiation lengths. The main parameters of the barrel are summarized in Table 6.
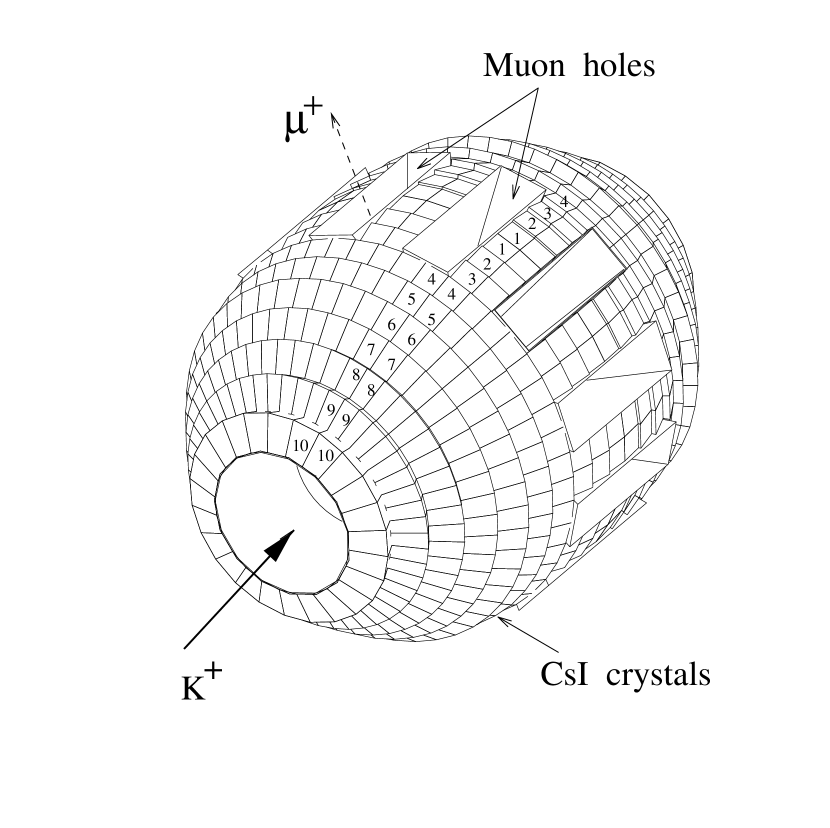
The crystal assembly is mounted in a cylindrical housing with high mechanical precision. An aluminum support structure bears the total weight of 1700 kg while minimizing material between the stopping target and the CsI(Tl) volume. Each crystal module is suspended from an outer rib structure avoiding a load on the inner 3-mm thick Al cylinder. Care was taken in the precise mounting to minimize gaps between crystal modules which would degrade energy resolution. The total assembly rolls on 4 small wheels on two rails into position in the inner bore of the toroidal spectrometer magnet.
| Barrel | |
|---|---|
| segmentation | |
| total crystal weight | 1700 kg |
| inner diameter | 40 cm |
| outer diameter | 100 cm |
| detector length | 141 cm |
| solid angle coverage | 75% of 4 |
| Modules | |
| crystal length | 25 cm (13.5) |
| surface treatment | mirror polished(partially sanded) |
| reflector | two layers of 120 thick GSWP00010 |
| mean light yield (Type 1-9) | 10920 p.e./MeV |
| mean light yield (Type 10) | 17400 p.e./MeV |
| container | 100 thick Al can |
| PIN diode | mm, 300 (Type 1-9) |
| mm, 500 (Type 10) | |
| power consumption | 0.25W per preamplifier |
5.2 CsI(Tl) modules
The crystals were grown at the Institute of Single Crystals in Kharkov, Ukraine, and shaped with a precision of 150 m for each type. The structure of a crystal module is shown schematically in Figure 18. The typical size of the modules is cm2 at the front end and cm2 at the back end. Each crystal was wrapped with two layers of 120-m thick white diffuse filter paper333Millipore Corporation, GSWP00010.. and contained in a 100-m thick Al shell. To achieve good light-yield uniformity along the crystal axis, before wrapping the mirror-polished surface of the crystals was “tuned” in the region nearest the readout by roughening by sanding. The light yield uniformity is as good as % which is sufficient to provide linearity in energy measurement.
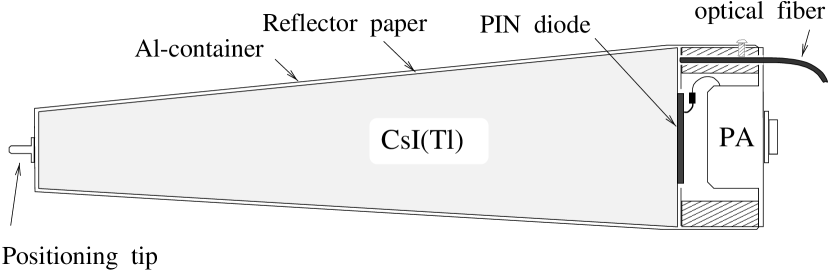
PIN photo-diodes of the type S3204-03 (1818 mm2, 300-m thick wafer) and S3584-05 (2828 mm2, 500-m thick wafer) were chosen for Type 1-9 crystals and the larger Type 10 crystals, respectively 444Hamamatsu S3584–05 ( =200 pF, 100 nA) and S3204–03 ( =140 pF, 20 nA).. They were glued directly to the rear face of the crystal using a single component type SE777 silicone glue 33footnotemark: 3 with short curing time and excellent adhesion between the crystal and diode. A charge sensitive preamplifier was mounted just behind the diode attached to an Al frame. Power consumption is 0.25 W for each preamplifier for a total detector heat load of 200 W, which is cooled by temperature-controlled dry air flow into the barrel cylinder. The outside of each Al shell was painted black to obtain electrical isolation and absorb any stray reflected light. An optical fiber feeds calibration light to the back end from a Xe-lamp monitoring system.
Average light yields for the modules are summarized in Table 6 and almost all the modules have light yield more than 8000 photoelectrons (p.e.)/MeV. The energy resolution of the modules was measured using a 1.27-MeV 22Na source to be 13-14%(FWHM), and the average equivalent noise level (ENL) was determined to be 63 keV.
5.3 Readout electronics
Each low-noise pre-amplifier feeds a main amplifier (MA) with low-gain and high-gain outputs and incorporated Timing-Filter-Amplifier (TFA). The low-gain signal is fed to a peak-sensing ADC as well as to a transient digitizer (TD) for energy measurement. The TFA provides a 450-ns wide pulse to a constant-fraction discriminator (CFD) whose output signal is fed to a 0.7-ns bin TDC for time measurement. The gain and time constant of the preamplifiers were optimized for the average energy deposit and counting rate. The adjustable shaping time constant of the MA was typically 1.0s, and a pole-zero cancelation circuit and baseline restorer in the main amplifier allowed good high rate performance; at 10 kHz average rate, energy resolution did not degrade appreciably, keeping 92% counting efficiency.
The TD is based on a switched-capacitor-array (SCA) integrated circuit which allows waveform recording with 12-bit accuracy at the maximum sampling rate of 10 MHz[18]. It provided additional double-pulse resolving ability at higher rate, supplementing the ADC and TDC systems. The main characteristics are summarized in Table 7.
5.4 Xenon lamp monitoring system
The Xe-lamp monitor system provided test light pulses to each module to detect failed photo-diodes and to do other diagnosis of the readout electronics. The light is distributed to each crystal module through an optical glass fiber and a mixer fanout box. The light signal is split in two stages, 24 32 to feed the 768 crystals. The distributors provide uniform light to each crystal to within with overall loss of 18dB. The Xe lamp 555Hamamatsu L2189 operates at a repetition rate of 10 Hz, and has an emission spectrum similar to CsI(Tl). The typical response of a crystal corresponds to an energy deposit of 50 to 100 MeV. The short term stability of pulse height was 2% (FWHM) which was monitored by a PMT which also provided the trigger signal in the calibration measurement.
| type | switching capacitor array + ADC |
|---|---|
| bin size | 640 ns |
| number of bins | 128 |
| dynamic range | 12 bit |
| conversion time | 820s for 4 multiplexed SCAs |
| linearity | 0.1% |
5.5 detection performance
The CsI(Tl) calorimeter performance is summarized in Table 8. The energy resolution was measured using tagged photon beams with variable energy in a prototype assembly of 30 similar crystals assembled in a matrix. Energy resolutions of 2.8% and 4.3% were obtained for 200 MeV and 100 MeV photons, respectively. In the actual detector with the 12 muon holes, however, the resolution is dominated by lateral leakage of a shower resulting in a low-energy tail. Typical resolution for the sum energy of two photons from decay is 4.1%. The single crystal resolution of 1.7% was measured using the 152-MeV from decay by selecting events with no energy deposit in the neighboring crystals. The muons were used for the crystal gain calibration. The electronic noise contribution to the energy resolution was found to be negligibly small; from an ADC pedestal measurement the incoherent contribution was 250 keV when summed over 9 crystals while the coherent contribution was 11 keV per module.
For kinematics determination, the photon spatial resolution is essential. The directional resolution of s was =2.3 degree using a back-to-back correlation between the and of decay, corresponding to a spatial resolution of 7.6 mm. A typical time spectrum is shown in Figure 19(a). For the energy range of 10-200 MeV the resolution was 3.8 ns in the experiment. Figure 19(b) shows the energy dependence of the resolution.
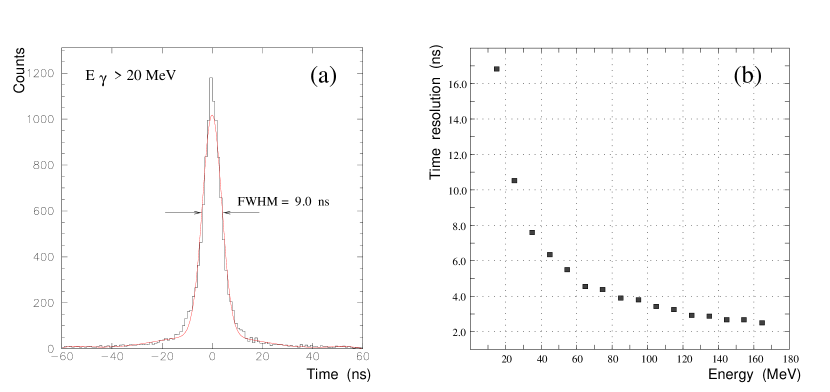
Figure 20 shows the invariant mass spectrum of two photons from decay using crystal clustering: (a) is the spectrum of the whole detector with = 6.7% at 129.6 MeV/ which includes the deterioration due to shower leakage. The resolution improves to 5.6% for events away from the muon holes (b) [19].
| energy resolution /E | 4.3% at 100 MeV |
|---|---|
| 2.8% at 200 MeV | |
| electric noise (incoherent) | 250 keV () for 9 modules |
| electric noise (coherent) | 11keV per module |
| linearity | 2% for 5 – 250 MeV |
| spatial resolution (rms) | 7.6 mm at 200 MeV |
| angular resolution (rms) | 2.2 – 2.4 degree |
| time resolution (rms) | 3.5 ns at 100 MeV |
| mass resolution | MeV/ |

6 Muon Polarimeter
By using the longitudinal field method introduced in Section 2.2, the transverse polarization component is preserved under the holding field and the in-plane components and are precessed as illustrated in Figure 2. The transverse component is then detected as a left-right, or clockwise-counter-clockwise asymmetry of decay positrons with respect to the muon stopper.
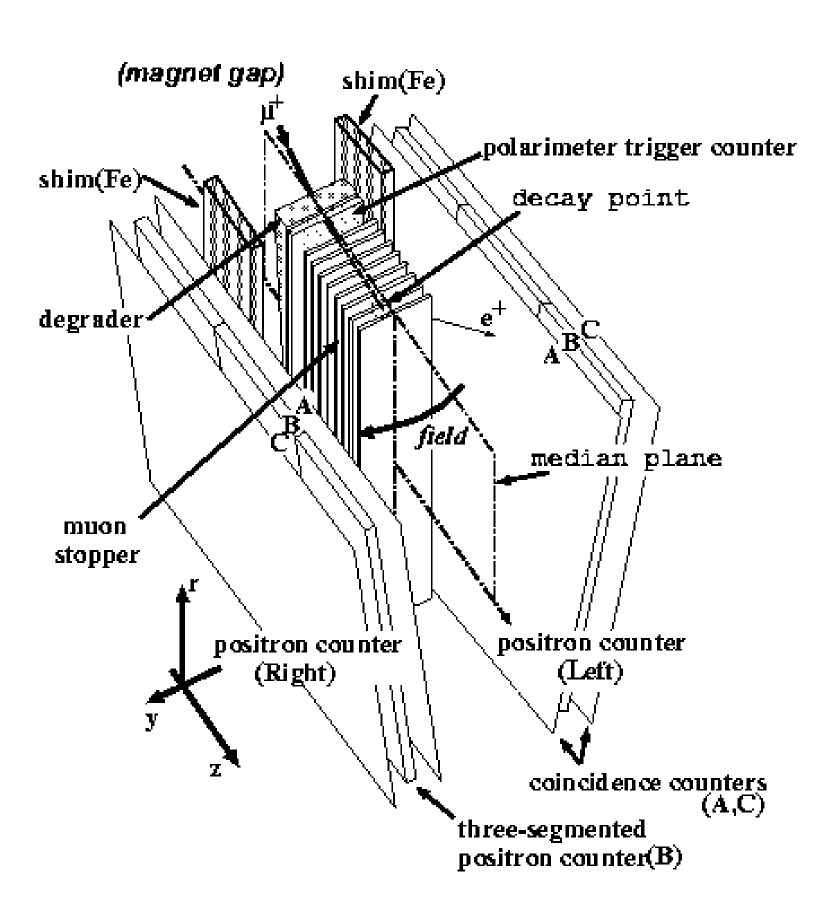
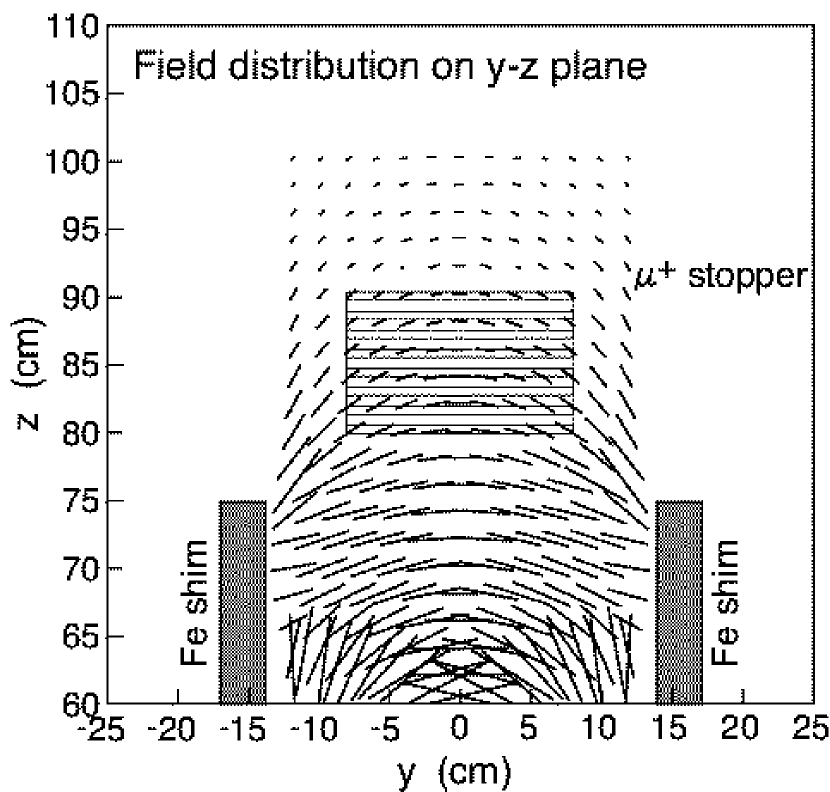
The structure of the polarimeter is shown in Figure 21. The field on the stopper was formed by iron shim plates which shaped the superconducting magnet fringing field. Its distribution on the muon stopper was symmetric but not uniform as can be seen in Figure 22.
To detect a tiny effect of the analyzing power should be as large as possible, and there must be no depolarization of the stopped muon spin. Any depolarization which could be material and field strength dependent not only reduces the effect but also has the potential to introduce spurious effects.
6.1 Rotation of the polarization vector in flight
As the muon goes through the magnetic field in the magnet gap its spin rotates around the B field axis along with the trajectory. The effect of the spectrometer magnetic field on the rotation of the muon polarization vector was studied in a GEANT3 simulation [20] which included the relativistic Bargmann-Michel-Telegdi equation [21] to treat polarization dynamics. Muon depolarization due to multiple scattering was evaluated [22] separately and found to be unimportant. After being bent by about 90 degrees through the gap, the projection of polarization on the median plane of the gap is conserved as well as the median-plane perpendicular component. By integrating forward or backward pion regions the net perpendicular component, which should be , remains the azimuthal polarization at the exit of the gap.
On entering the Cu degrader and Al stopper, depolarization takes place due to the relativistic effect in multiple scattering. The degree of depolarization can be evaluated both for longitudinal component () and transverse components ( and )[22] and was found to be negligibly small. The spin dependence of Mott scattering was also considered, since it may generate left-right asymmetry in the muon stopping distribution giving an opposite effect for forward and backward pions potentially resulting in a spurious T-violating asymmetry. However, this asymmetry is very small for small scattering angles in multiple scattering where the cross section is large.
6.2 Spin rotation field
The configuration of the muon degrader, stopper, positron counters, and magnetic field shim plates was designed to optimize the polarization sensitivity and minimize spurious instrumental effects. This required a careful balance between ensuring the necessary solid angle for positron detection and avoiding asymmetries in the field distribution. The field distribution the in plane is shown in Figure 22. If seen locally and are admixed to the azimuthal component in the course of precession around the tilted field line. It was therefore essential to realize a perfect symmetry of the field distribution across the magnet-gap median plane so that any effect from the in-plane components vanishes in total.
The position and structure of the shim plates was designed using a three dimensional field calculation code TOSCA[14]. The field on the muon stopping distribution should be as high as possible by guiding the fringing field from the superconducting magnet so that it decouples the stray fields in the experimental area. In addition a possible effect from coil misalignment in the cryostat should be negligible. There should be no saturation in the iron in order to suppress unwanted effects which might be material dependent and have hysteresis characteristics. Finally, a simple structure was prefered for ease of precise installation.
In the designed configuration an average field strength in the region of stopping muons of 130 Gauss was realized for the 0.9-T magnet excitation. The magnetization in the shim plates made of high quality magnet steel is 300 Gauss maximum and well below saturation.
Each plate was manufactured with a precision of 50 m and the installation was done with an accuracy of 200 m relative to the magnet gap median planes by using a specially prepared jig. Field mapping was performed at 0.9-T excitation using a 3-dimensional Hall element mounted on a specially made scanning device. The four-Euler-angle method was employed. Details of the measurement in which the strength accuracy of 0.1 Gauss and an angular accuracy of 1.0 mr are achieved was described in [23]. Three tilt angles of the distribution were deduced from the measured field maps, and are summarized in Table 9. These characteristics of the muon spin rotation field are adequate for the present experiment.
| average field strength | 130 Gauss |
| accuracy of field mapping | |
| field strength | 0.07 Gauss |
| field vector angle | 1.0 mr |
| asymmetry of the distribution | |
| offset in direction | 0.9 mm |
| rotation around axis | 0.15 mr |
| rotation around axis | 1.58 mr |
6.3 Al stopper and material test
The muon stopper was required to be thick enough to stop muons, but it must also allow the positrons to escape. An array of eight 6-mm thick pure aluminum slabs, 160-mm wide by 550-mm long, with 8-mm spacing was used. The stopping efficiency for muons was 78%. The material we used was type 1N99 which corresponds to a purity of more than 99.99%. It is well known that muons imbedded in pure Al show neither intitial loss of polarization nor spin relaxation[24]. Actual material was studied in a SR experiment with polarized muons at the Meson Science Laboratory of the University of Tokyo (UT-MSL). Muons from the beam were stopped and allowed to decay in the aluminum located in the center of two Helmholtz coil magnets, allowing the application of both transverse and longitudinal magnetic fields of variable strength. Located symmetrically upstream and downstream from the stopper were two arrays of positron detectors.
The forward/backward asymmetry of muon decay positrons was determined as the ratio
| (7) |
where and are the time-dependent positron counts in the forward and backward counters, respectively. After subtracting constant background components in and and normalization, the asymmetry was fit to a function
| (8) |
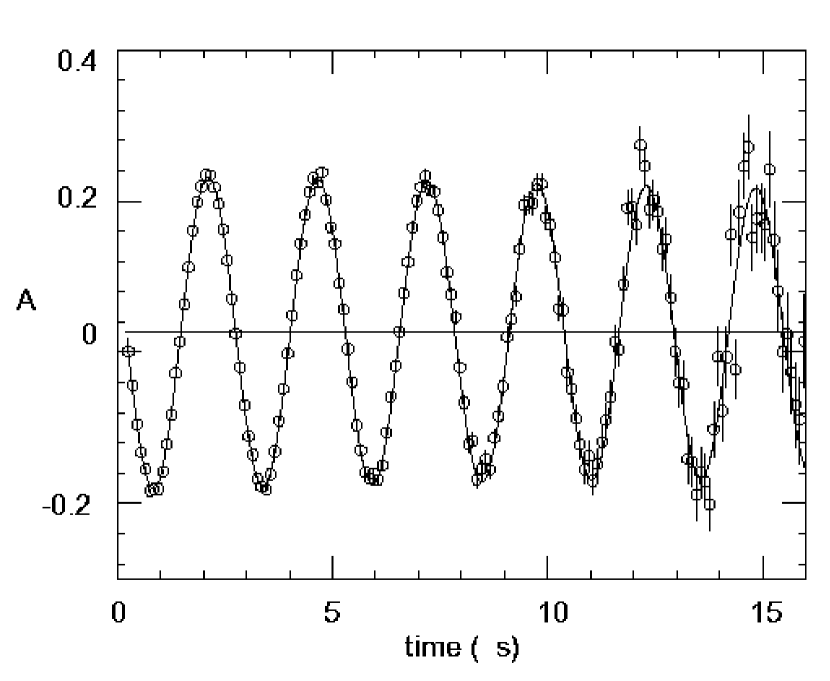
where is the initial asymmetry, is the damping rate determined by spin relaxation and field inhomogeneity, is the precession angular velocity, and is the small initial phase shift. Figure 23 shows a typical asymmetry spectrum for a 30-Gauss field. The measured damping rates for three different field strengths are listed in Table 10. They are all small enough to indicate that spin relaxation in this Al material is negligible.
| Field (Gauss) | Initial asymmetry | Damping rate () |
|---|---|---|
| 30 | 0.208 0.001 | 0.0062 0.0012 |
| 50 | 0.205 0.001 | 0.0081 0.0010 |
| 70 | 0.199 0.001 | 0.0051 0.0010 |
6.4 Positron counter system
6.4.1 Structure
Two adjacent muon stopper arrays share one positron counter assembly between them, being the clockwise counter with respect to one gap and the counter-clockwise counter of the neighboring gap. Each of the 12 positron counter assemblies comprises a three-fold segmented positron counter sandwiched between two coincidence counters, depicted as (B) and (A,C), respectively, in Figure 21. Each segment of the positron counter is 10-mm thick, 100-mm wide, and 840-mm long, so that the total width is 300 mm. Each segment is read by two mesh-type PMTs (Hamamatsu H6154), which retain high gain in a magnetic field. The 3 380 920-mm3 coincidence counters were designed so that their solid angles from any point in the muon stopper are larger than that of the positron counter. The triple coincidence among all three layers confirmed a positron free from the background, mainly photons and neutrons. The geometrical acceptance of the positron counter assembly is about 13% of 4 solid angle.
Each element in the polarimeter was accurately positioned to better than 1 mm in order to minimize false asymmetry in the positron counting due to instrumental mis-alignment. The maximum alignment deviations of the positron counters and muon stoppers are listed in Table 11, and are smaller than the calculated limitations.
| [mm] | [mm] | [mm] | |
|---|---|---|---|
| muon stopper | 1 | 0.2 | 0.2 |
| positron counter | 0.5 | 0.2 | 0.2 |
6.4.2 Coincidence
A block diagram of the positron detection logic is shown in Figure 24. In order to obtain the time spectrum of the positron from muons, the coincidence information between the three-fold segmented positron counter and the coincidence counters was used as the TDC stop signal. The TDC start was generated by the coincidence of TOF2, the polarimeter trigger counter and the fiducial counters. To reject other decay modes, additional signals from other detectors were available. The discriminator thresholds of the counters were set to be sufficiently low (200 mV) in order to achieve close to 100% efficiency for positrons. The triple coincidence reduced the count rate to about 40% of that without the coincidence counters by suppressing the background of mainly neutral particles. The PMT gain drifts were monitored using the MIP peak position in the ADC spectra.

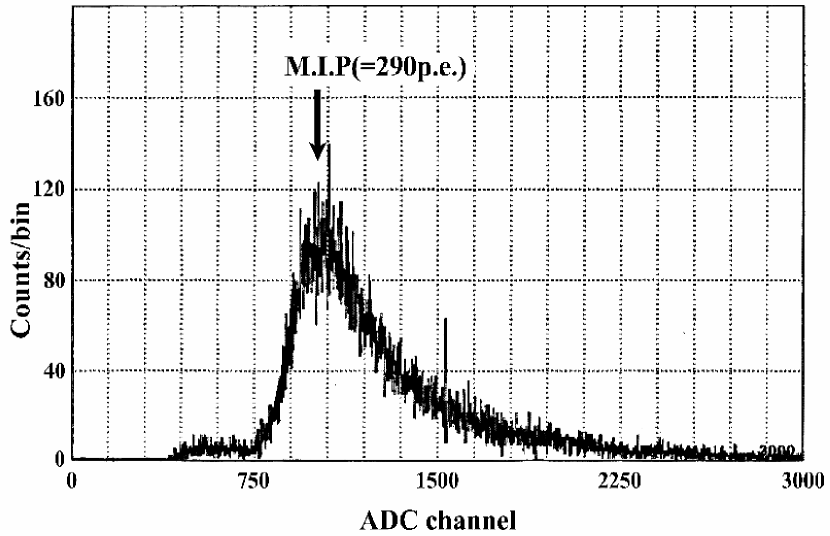
Figure 25 shows a typical ADC spectrum of the energy deposition of minimum ionizing cosmic rays in one positron counter, corresponding to a light yield at the peak of 290 photoelectrons. An additional calibration system using a Xenon lamp was also employed. Optical fibers distributed the light to all 36 scintillators of the three-segmented positron counters. The system supplied a stable photon yield to each PMT larger than that for MIP, with a fluctuation of less than 10 %.
6.5 Asymmetry measurement and polarization
The measurement of muon polarization is based on the asymmetry of positrons emitted in muon decays with a lifetime of s. In the longitudinal field method, the angular distribution of the energy integrated positron counting rate, is expressed as
| (9) |
Here, is the analyzing power, is the longitudinal muon polarization, and is the emission angle relative to the axis. (For an ideal case of no interaction with matter of the emitted positron and no trajectory distortion, is 1/3.) In the present configuration, the longitudinal component is the average transverse polarization in the azimuthal direction, which can be determined from clockwise/counter-clockwise () asymmetry of time integrated positron counting rates as,
| (10) |
The analyzing power, , included three experimental effects from (1) the finite solid angle of the counters, (2) scattering and absorption in the Al stopper, and (3) spin precession around the magnetic field which is not everywhere parallel to the azimuthal direction (see Figure 22). The analyzing power could be optimized to provide the maximum figure of merit, . Experimentally, it was checked using the data. By selecting s normal to the beam on the left side and right side, one orients the in-plane polarization azimuthally in the stopper rather than in the case of or s. The positron asymmetry was measured as the and difference of the counting rate as in Eq. 10. The average was calculated from a Monte Carlo simulation. is then deduced as to be typically 0.28 – 0.30.
6.6 Veto counter system
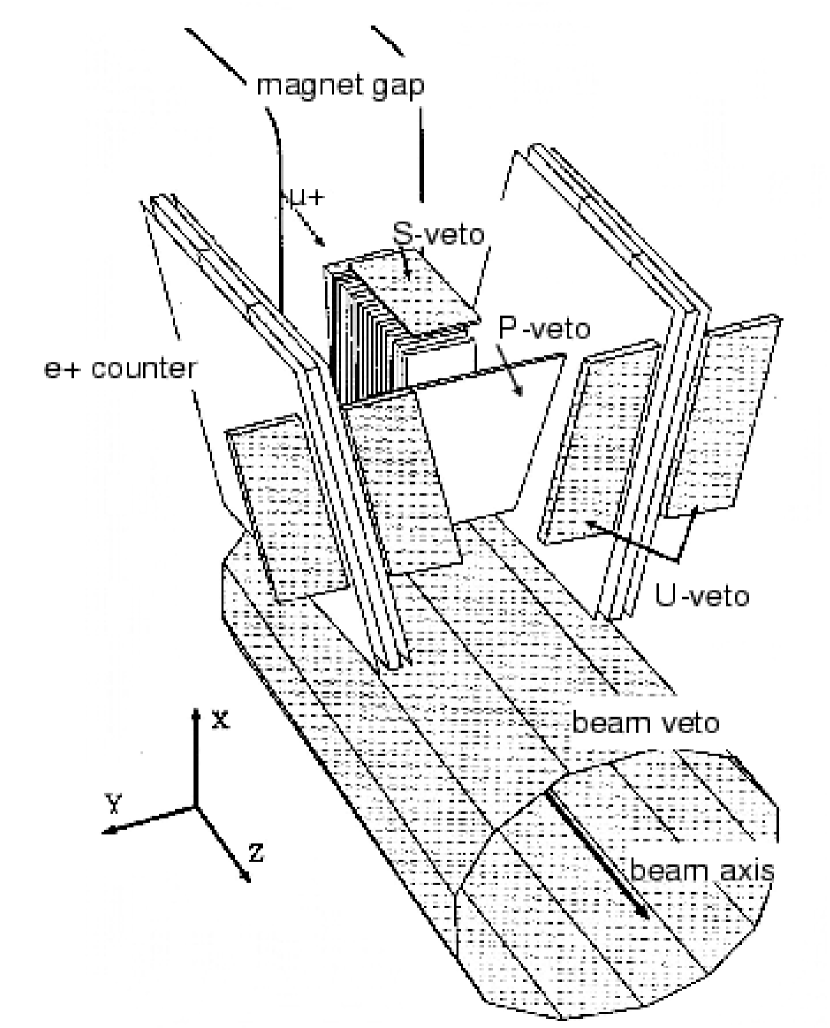
One of the advantages of the present experiment is a relatively low background level at the polarimeter compared with the previous in-flight experiments. However, the influence of the backgrounds due to beam particles cannot be eliminated completely. In order to reduce these backgrounds and study their characteristics, an array of veto counters was installed, as shown in Figure 26.
The main components are the B-veto counters, which cover the inner-radius region of the polarimeter to isolate the polarimeter from the beam. The P-veto and U-veto counters counters located behind the muon stopper and positron counter, respectively, were aimed at rejecting events such as muons passing through or scattering off the muon stopper. The S-veto counters, covering the outer-radius region of the polarimeter, rejected muons exiting the muon stopper to the outside of the polarimeter. About 30% of the accidental background in the positron time spectrum could be rejected by these veto counters. Also, by using calibration data which were collected with a special trigger, we found that 10% of decay muons escaped the polarimeter and were rejected.
7 Trigger
The overall trigger scheme is shown in Figure 27. The first level trigger requires an incoming kaon followed by its decay daughter particle hitting a fiducial counter and passing through a toroidal magnet gap to the TOF2 counter. The coincidence logic is defined as
| (11) |
where is the kaon Čerenkov counter with multiplicity larger than 6 PMTs hit, is a hit of the i-th fiducial counter or its immediate neighbors, and and are hits in the TOF2 and polarimeter trigger counters, respectively, in the i-th gap.

The first level trigger rate was about 200/beam-spill per gap, i.e. /pulse in total, for incident kaons/beam-spill with a ratio of . The second level trigger required hits in the CsI(Tl) photon detector. Analog signals from the CsI(Tl) crystals were discriminated by constant fraction discriminators (CFD) with an energy threshold of 5 MeV, and then the existence of at least one discriminated signal within a coincidence time window of 150 ns was required. Hits in the crystals surrounding the muon hole corresponding to the first level trigger vetoed the event in order to suppress muons scattering off the crystals around the muon hole. A rejection factor at the second level trigger was about 1.7.
The third level trigger required hits in the triple coincidence of the positron counter arrays adjacent to gap i within 20 s after the first level trigger. The rejection factor of the 3rd level trigger is about 13. Events which did not satisfy either the second or third level triggers by 20 s after the first level trigger were cleared. As a consequence, about 110 events/pulse survived, and 100 events were recorded to tape for analysis offline. The break down of the trigger rates is summarized in Table 12.
| protons/spill | |
|---|---|
| 1st level trigger | |
| 300 k/spill | |
| 125 k/spill | |
| 7.7 k/spill | |
| 2.4 k/spill | |
| 1st level photon | 1.4 k/spill |
| 1st level photon positron | 110 /spill |
| Live time fraction = 90% | 100 /spill |
8 Data Acquisition
8.1 Hardware
The E246 DAQ system was designed as a parallel processing system based on a VME bus, a TKO bus, and standard Fastbus and CAMAC systems linked with workstations. The VME bus was used as the main back-end system which collected all the data using a single-board computer on the VME bus.
The TKO system was developed and has been used as a standard at KEK[25]. It was used to read data from ADC and TDC modules connected to the scintillation counter systems and the MWPCs.
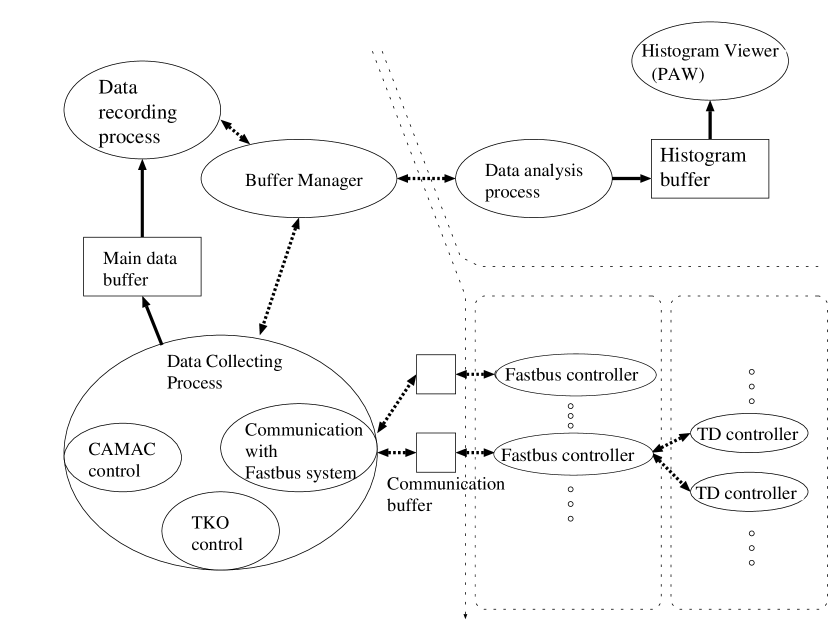
Fastbus was used to read data from multi-hit TDC modules fed from the polarimeter positron counters and from the high rate beam counters. The SCA transient digitizers for the CsI(Tl) photon counters were also mounted and read out in Fastbus crates. CAMAC was used only for slow monitoring and for trigger control. Workstations were used for online monitors. The configuration of the DAQ system is shown in Figure 28.

TKO and Fastbus have intelligent controllers and buffer memories and work independently crate by crate. The KEK-PS beam has a spill structure that is 0.7-s beam on and 2.3-s beam off and the DAQ system took advantage of this structure. During the spill beam-on period, the system only read data from the front-end modules and stored the data into local memories in each crate. During the between spill beam-off period, the stored data were transfered to the back-end system, and gathered by the managing process. The gathered data were stored in a large main buffer which has typically about 32 Mbytes capacity and then recorded onto DLT tape. A part of the data were distributed to analysis processes via ethernet for online monitoring.
8.1.1 TKO system
The TKO intelligent sequencer, the SCH (VME version of the Control Header, CH [26]), has many functions for reading modules and works as a bridge between TKO and the VME bus. On the VME bus side, a partner module called the SMP (S Memory Partner[26]), functions as a local buffer memory for the TKO data and for controlling the SCH. A total of eight TKO crates are used to read out the ADCs and TDCs for the plastic scintillator PMTs and the CsI(Tl) PIN diodes, as well as the ADCs for the MWPCs.
8.1.2 Fastbus system
Fastbus was used to read multi-hit LeCroy 1877/1879 TDC modules with a time range long enough to cover several 2-s lifetimes of the muon decay. The LeCroy 1877/1879 has local buffer memory in each module which was used in pipeline mode. The conversion time of the multi-hit TDC could be ignored in this experiment, which was done at a trigger rate of a few hundred Hz.
To communicate between Fastbus and the VME bus, we used a master processor unit in each of the four Fastbus crates which controlled the 1877 and 1879 modules. This unit has a dual-port memory (DPM) which is connected to both the inner bus and the VME bus to handle communication between the two.
A command interpreter for controlling the Fastbus system running on each unit received a command from the VME system via the DPM to acquire data independently. During beam-off this command interpreter initiated the data transfer from each of the local memories to the VME bus system also via the DPM.
8.1.3 CAMAC system
The CAMAC system was used as a trigger control and condition monitor. In the CAMAC system, output registers, scalers, input registers, scanning ADCs and a crate controller were used. The Kinetic Systems 3922 crate controller received commands from a partner Kinetics 2940 which resided in the VME crate. After each beam-on spill, the CAMAC system scanned the spill information, trigger conditions, and counter voltages for monitoring.
8.1.4 VME bus system
The VME bus system functioned as master of these systems, controlling the other systems and reading the data collected by each system during the spill. An HP-753 VME master module (PA-RISC, 64 Mbytes memory) was used as the main DAQ controller, running HP-RT, a real time operating system based on LynxOS. This module was connected to a DLT tape drive for data logging.
The slave modules for the other bus systems that communicated with the VME bus masters were eight SMP modules for the TKO system and four AMSK DPM modules for the Fastbus system. A second HP-753 module on the VME bus running the UNIX-based HP-UX operating system provided the development environment for the HP-RT system. When the DAQ system was running, this module was available to run online analysis.
8.1.5 Data recording and online analysis
Two major features of the DLT tape format are high recording speed (1.5 Mbytes-s-1) and large capacity (20 Gbytes). Our data rate was typically 2.4 Mbytes in each 0.7-s long spill every 3.0 seconds for an average 0.8 Mbytes-s-1, well within the capability of the DLT.
The online analysis mainly for monitoring data quality used a distributed system over ethernet. A fraction of the data were transfered via TCP/IP to typically three workstations — Sun ipx, Sun ipc and intel-PC/Linux.
8.2 Software
The DAQ software was based on UNIDAQ[27], a UNIX-like OS which was developed at KEK and the Tokyo Institute for Technology (TIT). It includes a buffer manager using eight 4-Mbyte standard memory data buffers, and a process control system. The data acquired during one spill were stored into one buffer. This DAQ program is an ensemble of single-function modular processes which work together:
-
•
novad is a buffer manager which accepts requests from the other processes and issues buffer pointers.
-
•
xpc manages a process database, and checks process status, e.g., whether the processes are stopped illegally or not.
-
•
collector is a data collector, which controls many devices and reads data, assembles and packs data, and writes data into a buffer.
-
•
operator is a system control interface for users through which runs are started and stopped.
-
•
recorder is a data recorder, which writes data from a buffer onto tape.
-
•
analyzer is an online analysis process, which gets a part of the data and makes low-level and high-level histograms.
A schematic view of the DAQ software is shown in Figure 29.
8.2.1 Collector
The data collection system consists of two programs, the collector working on the VME HP-753, and the CIP working on the Fastbus 68020FPI in each crate. The collector communicates with the buffer manager, controls and collects data from TKO, and communicates with the CIP and gets data from Fastbus. The CIP communicates with the collector, and handles control and data collection in each Fastbus crate.
8.2.2 Online analysis
The online monitor system is also divided between two programs. The analyzer gets data from the buffer manager via ethernet and forms the histograms, and the other is a histogram viewer. The analyzer was compiled to run on both Sun UNIX and Linux based computers on the network, requiring Sun compatible IPC (Internal Process Control) and socket libraries. The analyzer and histogram viewer worked independently with shared memory.
Viewers based on PAW/Hbook, an analysis tool developed by CERN666CERN Program Library, IT division/CERN, http://cernlib.web.cern.ch/cernlib/ and on Histo-Scope which was developed by FNAL777Fermilab Computing Div. Library, http://www-pat.fnal.gov/nirvana/histo.html, were used. PAW includes many powerful functions useful for online analysis, while Histo-Scope is convenient to use interactively.
8.3 DAQ system performance
The detector has about 2000 output channels in total. One event consisted of about 1600 32-bit words, and at a typical trigger rate of about 100 to 200 events per spill, the data size of one spill was about 0.7 to 1.4 Mbytes.
The data taking speed differed in each crate of the TKO system depending on module configuration. The trigger timing and the wait for A/D conversion were tuned individually. The slowest crate needed 150 s for conversion and 350 s for reading for a dead time of 500 s. The Fastbus system used a pipeline mode so that A/D conversion time was negligible, but the readout time was about 500 s, so that the dead time of this system was also about 500 s. The efficiency of the DAQ system depends on the trigger rate and the correlation between the trigger rate and the live time efficiency is shown in Figure 30. The DAQ system typically operated with a live time efficiency from 85% to 95%.

9 Summary
The detector built for the search for a T-violating transverse muon polarization in decay at rest included systems for identifying and stopping the low-momentum kaon beam, and precise measurement of the kinematics of charged decay daughters in a toroidal spectrometer and of photons in a segmented Cs(Tl) calorimeter. The muon polarimeter used pure aluminum stopping material to avoid depolarization, and used the shimmed fringe magnetic field of the superconducting toroid to provide a longitudinal holding field for the azimuthal polarization component. Emphasis on precision component alignment and a high degree of detector symmetry allowed many sources of potential systematic errors to be eliminated or minimized.
10 Acknowledgments
This work was supported in Japan by a Grant-in-Aid from the Ministry of Education, Science, Sports and Culture, and by JSPS; in Russia by the Ministry of Science and Technology, and by the Russian Foundation for Basic Research; in Canada by NSERC and IPP, and by infrastructure of TRIUMF provided under its NRC contribution; in Korea by BSRI-MOE and KOSEF; in the U.S.A. by NSF and DOE.
The authors thank S. Iwata, M. Kobayashi, V.M. Lobashev, V.A. Matveev, K. Nakai, K. Nakamura, J.-M. Poutissou, V.A. Rubakov, H. Sugawara, E. Vogt, S. Yamada and T. Yamazaki for encouragement in executing the present work. They gratefully acknowledge the excellent support received from several staff members of KEK, INR and TRIUMF, in particular, T. Fujino, E. Shabalin and N. Khan. They also recognize the early contributions of P. Bergbusch, C. Chen, D. Dementyev, M. Grigoriev, W. Keil and I.S. Park.
References
- [1] E. Golovich and G. Valencia, Phys. Rev. D40 (1989) 112; I.I. Bigi and A.I. Sanda, CP violation, Cambridge University Press, Cambridge, England, 2000.
- [2] A.R. Zhitnitskii, Sov. J. Nucl. Phys. 31 (1980) 529 [Yad. Fiz. 31 (1980) 1024]; V.P. Efrosinin et al., Phys. Lett. B493 (2000) 293.
- [3] G. Bélanger and C.Q. Geng, Phys. Rev. D44 (1991) 2789; C.Q. Geng and S.K. Lee, Phys. Rev. D51 (1995) 99; M. Kobayashi, T.-T. Lin, and Y. Okada, Prog. Theor. Phys. 95 (1995) 361; M. Fabbrichesi and F. Vissani, Phys. Rev. D55 (1997) 5334; G.-H. Wu and J.N. Ng, Phys. Lett. B392 (1997) 93.
- [4] CPLEAR Collaboration, Phys. Lett. B 444 (1998) 43; A. Alavi-Harati et al., Phys. Rev. Letters 84 (2000) 408.
- [5] M. Abe et al., Phys. Rev. Lett. 83 (1999) 4253.
- [6] S.R. Blatt et al., Phys. Rev. D27 (1983) 1056.
- [7] D.V. Dementyev et al., Nucl. Instr. and Meth. A440 (2000) 151.
- [8] K.H. Tanaka et al., Nucl. Instr. and Meth. A363 (1995) 114.
- [9] M.P. Grigor’ev et al., Instrum. Exp. Tech. 41 (1998) 803 [Prib. Tekh. Eksp. N6 (2000) 65].
- [10] J.S. Frank and R.C. Strand, private communication.
- [11] A.P. Ivashkin et al., Nucl. Instr. and Meth. A394 (1997) 321.
- [12] S. Aota et al., Nucl. Instr. and Meth. A352(1995) 557; G. Apollinari et al., Proc. 4th Int. Conf. on Calorimetry in High Energy Physics, La Biodola, Italy, Sept. 1993; V. Hagopian et al., Proc. 5th Int. Conf. on Calorimetry in High Energy Physics, BNL, Sept.–Oct. 1994; R. Wojcik et al., Nucl. Instr. and Meth. A342 (1994) 416.
- [13] A. Kawachi et al., Nucl. Instr. and Meth. A416 (1998) 253.
- [14] J. Simkin and C.W. Trowbridge, Rutherford report RL-79-097, Dec 1979.
- [15] J.Chiba et al., Nucl. Instr. and Meth. 206 (1983) 451.
- [16] T. Yokoi, M.Sc. thesis, Physics Dept., Tokyo University, 1995, and T. Yokoi et. al., KEK E246 Technical Note 54, 1995.
- [17] Yu.G. Kudenko et al., Nucl. Instr. and Meth. A411 (1998) 437.
- [18] R.L. Wixted et al., Nucl. Instr. and Meth. A386 (1997) 483.
- [19] M.M. Khabibullin et al., Instrum. Exp. Tech. 43 (2000 )589 [Prib. Tekh. Eksp. N5 (2000) 9].
- [20] R. Brun et al., GEANT3 Users Guide, CERN Program Library W5013 (1994); P. Gumplinger, Proc. 11th Int. Symp. on High Energy Spin Physics (SPIN94), AIP Conf. Proc. 343 (1995) 686.
- [21] V. Bargmann, L. Michel and V.L. Telegdi, Phys. Rev. Lett. 2 (1959) 435.
- [22] V.L. Lyuboshits, Sov. J. Nucl. Phys. 31 (1980) 509 [Yad. Fiz. 31 (1980) 986]; V.L. Lyuboshits, Sov. J. Nucl. Phys. 32 (1980) 362 [Yad. Fiz. 32 (1980) 702].
- [23] T. Ikeda et al., Nucl. Instr. and Meth. A401 (1997) 243.
- [24] A. Jodidio et al., Phys. Rev. D34 (1986)1967, Erratum-ibid. D37 (1988) 237; M. Aoki et al., Phys. Rev. D50 (1994) 69.
- [25] T.K. Ohska et al., IEEE Trans. Nucl.Sci., NS-33(1986)98; Y. Arai, ibid p.771.
- [26] KEK Data Aquisition Development Working Group, TKO Specification, KEK Report 85-10 (1985).
- [27] M. Nomachi et al., Proceedings of the International Conference on Computing in High Energy Physics (CHEP94), LBL-35822, p.114(1994).
- [28] K. Horie et al., Phys. Lett. B513 (2001) 311; S. Shimizu et al., Phys. Lett. B495 (2000) 33; Y.H. Shin et al., Eur. Phys. J. C12 (2000) 627.