EUROPEAN ORGANIZATION FOR NUCLEAR RESEARCH (CERN)
CERN-EP/2003-02
10th January 2003
Measurement of the inclusive D∗± production
in collisions at LEP
The ALEPH Collaboration∗)
The inclusive production of D∗± mesons in two-photon collisions is measured with the ALEPH detector at centre-of-mass energies from 183 to 209. A total of D∗± meson events were observed from an integrated luminosity of . Contributions from direct and single-resolved processes are separated using the ratio of the transverse momentum of the D∗± to the visible invariant mass of the event. Differential cross sections of D∗± production as functions of and the pseudorapidity are measured in the range and . They are compared to next-to-leading order (NLO) perturbative QCD calculations. The extrapolation of the integrated visible D∗± cross section to the total charm cross section, based on the Pythia Monte Carlo program, yields .
Submitted to European Physical Journal C
See next pages for the list of authors
The ALEPH Collaboration
A. Heister, S. Schael
Physikalisches Institut das RWTH-Aachen, D-52056 Aachen, Germany
R. Barate, R. Brunelière, I. De Bonis, D. Decamp, C. Goy, S. Jezequel, J.-P. Lees, F. Martin, E. Merle, M.-N. Minard, B. Pietrzyk, B. Trocmé
Laboratoire de Physique des Particules (LAPP), IN2P3-CNRS, F-74019 Annecy-le-Vieux Cedex, France
S. Bravo, M.P. Casado, M. Chmeissani, J.M. Crespo, E. Fernandez, M. Fernandez-Bosman, Ll. Garrido,15 M. Martinez, A. Pacheco, H. Ruiz
Institut de Física d’Altes Energies, Universitat Autònoma de Barcelona, E-08193 Bellaterra (Barcelona), Spain7
A. Colaleo, D. Creanza, N. De Filippis, M. de Palma, G. Iaselli, G. Maggi, M. Maggi, S. Nuzzo, A. Ranieri, G. Raso,24 F. Ruggieri, G. Selvaggi, L. Silvestris, P. Tempesta, A. Tricomi,3 G. Zito
Dipartimento di Fisica, INFN Sezione di Bari, I-70126 Bari, Italy
X. Huang, J. Lin, Q. Ouyang, T. Wang, Y. Xie, R. Xu, S. Xue, J. Zhang, L. Zhang, W. Zhao
Institute of High Energy Physics, Academia Sinica, Beijing, The People’s Republic of China8
D. Abbaneo, P. Azzurri, T. Barklow,26 O. Buchmüller,26 M. Cattaneo, F. Cerutti, B. Clerbaux,23 H. Drevermann, R.W. Forty, M. Frank, F. Gianotti, J.B. Hansen, J. Harvey, D.E. Hutchcroft, P. Janot, B. Jost, M. Kado,2 P. Mato, A. Moutoussi, F. Ranjard, L. Rolandi, D. Schlatter, G. Sguazzoni, W. Tejessy, F. Teubert, A. Valassi, I. Videau, J.J. Ward
European Laboratory for Particle Physics (CERN), CH-1211 Geneva 23, Switzerland
F. Badaud, S. Dessagne, A. Falvard,20 D. Fayolle, P. Gay, J. Jousset, B. Michel, S. Monteil, D. Pallin, J.M. Pascolo, P. Perret
Laboratoire de Physique Corpusculaire, Université Blaise Pascal, IN2P3-CNRS, Clermont-Ferrand, F-63177 Aubière, France
J.D. Hansen, J.R. Hansen, P.H. Hansen, A. Kraan, B.S. Nilsson
Niels Bohr Institute, 2100 Copenhagen, DK-Denmark9
A. Kyriakis, C. Markou, E. Simopoulou, A. Vayaki, K. Zachariadou
Nuclear Research Center Demokritos (NRCD), GR-15310 Attiki, Greece
A. Blondel,12 J.-C. Brient, F. Machefert, A. Rougé, M. Swynghedauw, R. Tanaka H. Videau
Laoratoire Leprince-Ringuet, Ecole Polytechnique, IN2P3-CNRS, F-91128 Palaiseau Cedex, France
V. Ciulli, E. Focardi, G. Parrini
Dipartimento di Fisica, Università di Firenze, INFN Sezione di Firenze, I-50125 Firenze, Italy
A. Antonelli, M. Antonelli, G. Bencivenni, F. Bossi, G. Capon, V. Chiarella, P. Laurelli, G. Mannocchi,5 G.P. Murtas, L. Passalacqua
Laboratori Nazionali dell’INFN (LNF-INFN), I-00044 Frascati, Italy
J. Kennedy, J.G. Lynch, P. Negus, V. O’Shea, A.S. Thompson
Department of Physics and Astronomy, University of Glasgow, Glasgow G12 8QQ,United Kingdom10
S. Wasserbaech
Department of Physics, Haverford College, Haverford, PA 19041-1392, U.S.A.
R. Cavanaugh,4 S. Dhamotharan,21 C. Geweniger, P. Hanke, V. Hepp, E.E. Kluge, G. Leibenguth, A. Putzer, H. Stenzel, K. Tittel, M. Wunsch19
Kirchhoff-Institut für Physik, Universität Heidelberg, D-69120 Heidelberg, Germany16
R. Beuselinck, W. Cameron, G. Davies, P.J. Dornan, M. Girone,1 R.D. Hill, N. Marinelli, J. Nowell, S.A. Rutherford, J.K. Sedgbeer, J.C. Thompson,14 R. White
Department of Physics, Imperial College, London SW7 2BZ, United Kingdom10
V.M. Ghete, P. Girtler, E. Kneringer, D. Kuhn, G. Rudolph
Institut für Experimentalphysik, Universität Innsbruck, A-6020 Innsbruck, Austria18
E. Bouhova-Thacker, C.K. Bowdery, D.P. Clarke, G. Ellis, A.J. Finch, F. Foster, G. Hughes, R.W.L. Jones, M.R. Pearson, N.A. Robertson, M. Smizanska
Department of Physics, University of Lancaster, Lancaster LA1 4YB, United Kingdom10
O. van der Aa, C. Delaere,28 V. Lemaitre29
Institut de Physique Nucléaire, Département de Physique, Université Catholique de Louvain, 1348 Louvain-la-Neuve, Belgium
U. Blumenschein, F. Hölldorfer, K. Jakobs, F. Kayser, K. Kleinknecht, A.-S. Müller, B. Renk, H.-G. Sander, S. Schmeling, H. Wachsmuth, C. Zeitnitz, T. Ziegler
Institut für Physik, Universität Mainz, D-55099 Mainz, Germany16
A. Bonissent, P. Coyle, C. Curtil, A. Ealet, D. Fouchez, P. Payre, A. Tilquin
Centre de Physique des Particules de Marseille, Univ Méditerranée, IN2P3-CNRS, F-13288 Marseille, France
F. Ragusa
Dipartimento di Fisica, Università di Milano e INFN Sezione di Milano, I-20133 Milano, Italy.
A. David, H. Dietl, G. Ganis,27 K. Hüttmann, G. Lütjens, W. Männer, H.-G. Moser, R. Settles, G. Wolf
Max-Planck-Institut für Physik, Werner-Heisenberg-Institut, D-80805 München, Germany161616Supported by Bundesministerium für Bildung und Forschung, Germany.
J. Boucrot, O. Callot, M. Davier, L. Duflot, J.-F. Grivaz, Ph. Heusse, A. Jacholkowska,6 L. Serin, J.-J. Veillet, C. Yuan
Laboratoire de l’Accélérateur Linéaire, Université de Paris-Sud, IN2P3-CNRS, F-91898 Orsay Cedex, France
G. Bagliesi, T. Boccali, L. Foà, A. Giammanco, A. Giassi, F. Ligabue, A. Messineo, F. Palla, G. Sanguinetti, A. Sciabà, R. Tenchini,1 A. Venturi,1 P.G. Verdini
Dipartimento di Fisica dell’Università, INFN Sezione di Pisa, e Scuola Normale Superiore, I-56010 Pisa, Italy
O. Awunor, G.A. Blair, G. Cowan, A. Garcia-Bellido, M.G. Green, L.T. Jones, T. Medcalf, A. Misiejuk, J.A. Strong, P. Teixeira-Dias
Department of Physics, Royal Holloway & Bedford New College, University of London, Egham, Surrey TW20 OEX, United Kingdom10
R.W. Clifft, T.R. Edgecock, P.R. Norton, I.R. Tomalin
Particle Physics Dept., Rutherford Appleton Laboratory, Chilton, Didcot, Oxon OX11 OQX, United Kingdom10
B. Bloch-Devaux, D. Boumediene, P. Colas, B. Fabbro, E. Lançon, M.-C. Lemaire, E. Locci, P. Perez, J. Rander, B. Tuchming, B. Vallage
CEA, DAPNIA/Service de Physique des Particules, CE-Saclay, F-91191 Gif-sur-Yvette Cedex, France17
N. Konstantinidis, A.M. Litke, G. Taylor
Institute for Particle Physics, University of California at Santa Cruz, Santa Cruz, CA 95064, USA22
C.N. Booth, S. Cartwright, F. Combley,25 P.N. Hodgson, M. Lehto, L.F. Thompson
Department of Physics, University of Sheffield, Sheffield S3 7RH, United Kingdom10
A. Böhrer, S. Brandt, C. Grupen, J. Hess, A. Ngac, G. Prange, U. Sieler30
Fachbereich Physik, Universität Siegen, D-57068 Siegen, Germany16
C. Borean, G. Giannini
Dipartimento di Fisica, Università di Trieste e INFN Sezione di Trieste, I-34127 Trieste, Italy
H. He, J. Putz, J. Rothberg
Experimental Elementary Particle Physics, University of Washington, Seattle, WA 98195 U.S.A.
S.R. Armstrong, K. Berkelman, K. Cranmer, D.P.S. Ferguson, Y. Gao,13 S. González, O.J. Hayes, H. Hu, S. Jin, J. Kile, P.A. McNamara III, J. Nielsen, Y.B. Pan, J.H. von Wimmersperg-Toeller, W. Wiedenmann, J. Wu, Sau Lan Wu, X. Wu, G. Zobernig
Department of Physics, University of Wisconsin, Madison, WI 53706, USA11
G. Dissertori
Institute for Particle Physics, ETH Hönggerberg, 8093 Zürich, Switzerland.
1 Introduction
Heavy flavour production in two-photon events at LEP 2 centre-of-mass energies is dominated by charm production processes in which both of the photons couple directly (direct processes) or in which one photon couples directly and the other appears resolved (single-resolved processes) (Fig. 1) [1]. These two contributions are of the same order of magnitude within the experimental acceptance. Because the single-resolved process is dominated by fusion, the measurement of the cross section can give access to the gluon content of the photon. Moreover, the large masses of the c and b quarks provide a cutoff for perturbative QCD calculations, allowing a good test of QCD predictions for the corresponding reactions. Contributions from processes in which both photons appear resolved (double-resolved processes) are suppressed by more than two orders of magnitude compared to the total cross section [1]. The production of b quark is expected to be suppressed by a large factor compared to charm quark because of the heavier mass and smaller absolute charge.
In the present analysis charm production is measured in two steps. A high-purity sample is first selected, then examined for its charm content via reconstruction of D∗+ mesons in their decay to . This letter is organized as follows. A short description of the ALEPH detector is given in Section 2. Monte Carlo simulations for signal and background processes are described in Section 3. In Section 4, event selection and reconstruction of D∗+ mesons are discussed. The results of the analysis are presented in Section 5. Finally, in Section 6 a summary is given. Throughout this letter charge-conjugated particles and their decays are implicitly included.
2 ALEPH Detector
The ALEPH detector has been described in detail in [2, 3]. Here, only the parts essential to the present analysis are covered briefly. The central part of the ALEPH detector is dedicated to the reconstruction of the trajectories of charged particles. The trajectory of a charged particle emerging from the interaction point is measured by a two-layer silicon strip vertex detector (VDET), a cylindrical drift chamber (ITC) and a large time projection chamber (TPC). The three tracking detectors are immersed in a axial magnetic field provided by a superconducting solenoidal coil. Together they measure charged particle transverse momenta with a resolution of ( in GeV/). The TPC also provides a measurement of the specific ionization . An estimator is formed to test a particle hypothesis, where and denote the expected specific ionization and the estimated uncertainty for the particle hypothesis h, respectively. A mass hypothesis may be tested by means of the values themselves or by calculating confidence levels .
Photons are identified in the electromagnetic calorimeter (ECAL), situated between the TPC and the coil. The ECAL is a lead/proportional-tube sampling calorimeter segmented in projective towers and read out in three sections in depth. It has a total thickness of 22 radiation lengths and yields a relative energy resolution of , with in GeV, for isolated photons. Electrons are identified by their transverse and longitudinal shower profiles in ECAL and their specific ionization in the TPC.
The iron return yoke is instrumented with 23 layers of streamer tubes and forms the hadron calorimeter (HCAL). The latter provides a relative energy resolution of charged and neutral hadrons of , with in GeV. Muons are distinguished from hadrons by their characteristic pattern in HCAL and by the muon chambers, composed of two double-layers of streamer tubes outside HCAL.
Two small-angle calorimeters, the luminosity calorimeter (LCAL) and the silicon luminosity calorimeter (SICAL), are particularly important for this analysis to veto events with detected scattered electrons. The LCAL is a lead/proportional-tube calorimeter, similar to ECAL, placed around the beam pipe at each end of the detector. It monitors angles from 45 to 160 mrad with an energy resolution of . The SICAL uses 12 silicon/tungsten layers to sample showers. It is mounted around the beam pipe in front of the LCAL, covering angles from 34 to 58 mrad, with an energy resolution of .
The information from the tracking detectors and the calorimeters are combined in an energy-flow algorithm [3]. For each event, the algorithm provides a set of charged and neutral reconstructed particles, called energy-flow objects.
3 Monte Carlo Simulations
In order to simulate the process , the leading-order (LO) PYTHIA 6.121 Monte Carlo [4] is used. Events are generated at centre-of-mass energies ranging from 183 to 209 using the corresponding integrated luminosities for weighting. Two different samples, direct and single-resolved processes, were generated for each of the considered D∗+ decay modes using matrix elements for the massive charm quark. The charm quark mass is chosen to be 1.5 and the parameter is set to 0.291 . The invariant mass is required to be at least 3.875, which is the D threshold. In order to ensure that both photons are quasi-real, the maximum squared four-momentum transfer is limited to 4.5. In the single-resolved process, the SaS-1D [5] parametrization is used for the partonic distribution of the resolved photon. The Peterson et al. parametrization [6] is adopted as the fragmentation function of the charm quark with the nonperturbative parameter . The background process is simulated using PYTHIA 6.121 with being required to be at least 10.5, which is the B threshold. The b quark mass is set to 4.5. Again the Peterson et al. parametrization is adopted with . Other possible background processes have been simulated using appropriate Monte Carlo generators as listed in Table 1.
4 Event Selection and Reconstruction of D∗+ Mesons
4.1 Selection of Events
The data analyzed were collected by the ALEPH detector at centre-of-mass energies ranging from 183 to 209 with an integrated luminosity . The event variables used for the event preselection are based on the ALEPH energy-flow objects. The following cuts, derived from Monte Carlo studies, were applied to select two-photon events.
-
•
The event must contain at least 3 charged particles. This cut reduces the background from leptonic events.
-
•
The visible invariant mass of the event must lie between 4 and 55 while the total energy of charged particles should not exceed 35 in order to reject the annihilation background.
-
•
The visible transverse momentum of the event is required to be less than 8, as the distribution has a much longer tail for all considered background processes.
-
•
To reject further background processes a cut combining the number of charged tracks and the visible energy of the event is applied: .
-
•
Finally, in order to retain only events with almost on-shell photons an anti-tagging condition was applied, i.e., tagged events were rejected. A tag in this analysis is defined as an energy-flow object in the luminosity calorimeters (LCAL and SICAL) with an energy of at least 30.
This selection retains a sample of 4.9 million events. Monte Carlo studies of possible background sources predict a purity of .
4.2 Reconstruction of D∗+ Mesons
Charm quarks are detected using exclusively reconstructed D∗+ mesons which decay via D, with the D0 being identified in three decay modes, (1) , (2) , and (3) . As a basis for possible K± and candidates reconstructed tracks of charged particles which fulfill the following quality conditions are used:
| (momentum of track), | ||
| (distance to beam axis at closest approach), | ||
| ( coordinate at closest approach), | ||
| (number of hits in TPC), | ||
| ( polar angle with respect to beam axis). |
A track surviving these cuts is classified as a kaon if the measured specific energy loss of the track is consistent with the expectation value for the kaon mass hypothesis, i.e., if the corresponding confidence level is greater than 10%. The track is classified as a pion if is at least 1. Thus, each track can be flagged as a kaon or pion or both or neither.
The candidates are formed from pairs of photons found in ECAL with an energy of at least each and an invariant mass within of the nominal mass. In order to improve the energy resolution of these ’s the energies of the photons are refitted using the mass as constraint. If the confidence level of this fit is greater than 5% and if , where is the polar angle of the candidate with respect to the beam axis, the candidate is retained.
The D0 candidates are formed from appropriate combinations of identified kaons and pions according to three considered decay modes. The D0 candidate is retained if it has an invariant mass within 20, 65, and 20 of the nominal D0 mass for decay mode (1), (2), and (3), respectively. These mass ranges correspond to about three times the mass resolution. In order to reduce the combinatorial background in mode (3), the four tracks composing the D0 are fitted to a common vertex and the confidence level of this fit is required to be greater than 0.2%. The combination of each D0 with one of the remaining candidates is considered to be a D∗+ candidate. In order to reduce combinatorial background from soft processes and to limit the kinematic range of the D∗+ to the acceptance range of the detector with reasonable efficiency, cuts were applied to the transverse momentum and the pseudorapidity of the D∗+:
| (1) |
If there are several D∗+ candidates found in one event the corresponding D0 candidates are compared in mass and only the candidate with D0 mass nearest the nominal D0 mass is retained. If two or more D∗+ candidates share the same D0 candidate, all of them are retained. Figure 2 shows the mass difference for the selected D∗+ candidates for all three decay modes together. The spectrum rises at the lower threshold given by the pion mass. A clear peak is seen around . In order to extract the number of D∗+ events the data distribution is fitted with the following parametrization:
| (2) |
In order to exclude systematic binning effects an unbinned maximum likelihood fit is performed where and are used as free parameters. The normalization follows from the constraint that the integral of over the range of the fit, , must be equal to the number of entries in the histogram. The width of the Gaussian describing the peak is fixed to , as determined in Monte Carlo. The number of D∗+ events is then obtained by integrating the Gaussian part of (2) in the range of . As the result a total of D∗+ events are observed for all three D∗+ decay modes together. Among the possible background processes, only the contribution from is found to be sizeable. This contribution is estimated to be D∗+ events from a Monte Carlo sample and the total cross section measured in [11]. After subtraction of this background, a total of D∗+ events are found in the data sample analyzed. The mass difference distributions for three channels separately are shown in Fig. 3.
5 Cross Section Measurements
5.1 Relative Fractions of Direct and Single-resolved Contributions
As mentioned in the introduction, open charm production in collisions is dominated by contributions from direct and single-resolved processes. In the direct case the pair makes up the final state of the system (in LO) whereas in the single-resolved case the partons of the resolved photon (photon residue) in addition to the pair make up the final state. The transverse momentum of the D∗+ is correlated with the invariant mass of the system and the total visible invariant mass is in turn correlated with the invariant mass of the total system. The ratio should therefore be distributed at higher values for the direct case compared to the distribution of single-resolved events.
Figure 4 shows the distribution of in data for all events found in the signal region of the mass-difference spectrum. Combinatorial background has been subtracted using events of the upper sideband of the mass-difference spectrum. Background from production has also been subtracted. The relative fractions are determined by fitting the sum of the direct and single-resolved Monte Carlo distributions to data with the relative fraction as a free parameter of the fit. The total number of entries in this Monte Carlo sum is required to be equal to the number of entries in the data distribution. The fit yields a direct contribution of and a single-resolved contribution of .
5.2 Differential Cross Sections
Two differential cross sections for the production of D∗+ mesons are determined: the first one as a function of the transverse D∗+ momentum , and the second as a function of pseudorapidity . Both are restricted to the range defined in Eq. (1). The former is measured in three bins: [2–3], [3–5], [5–12] , and the latter in three bins: [0–0.5], [0.5–1.0], [1.0–1.5]. All considered D∗+ decay modes were treated separately.
The average differential cross section for a given bin and is obtained by
| (3) |
Analogously one obtains for a given bin in and
where
- •
-
•
, are the considered intervals in and ,
-
•
is the integrated luminosity of the data analyzed,
-
•
is the branching ratio BR [10],
-
•
is the branching ratio of the considered D0 decay mode [10],
-
•
() is the efficiency of reconstructing a D∗+ candidate in the given () bin in the considered decay mode. Since efficiencies are determined separately for direct and single-resolved processes ( and , respectively) the total efficiency is a weighted combination using the fractions as determined in Section 5.1,
Tables 2 and 3 show the number of D∗+ mesons found in the chosen and bins respectively, as well as the derived differential cross sections and with their statistical and systematic errors. The resulting cross sections for the different D∗+ decay modes are consistent with each other for all bins in as well as in , taking into account the statistical uncertainties. The weighted average over all of the considered D∗+ decay modes is given in Table 4 for each and bin, where only the dominating statistical uncertainties are used for weighting.
5.2.1 Systematic Errors on Differential Cross Sections
The study of systematic errors was performed separately for each and bin and for each of the considered D∗+ decay modes, unless otherwise specified.
The systematic error introduced by the event selection was studied by varying the cuts within the resolution obtained from the Monte Carlo detector simulation. The systematic uncertainty was estimated from the resulting relative variation of the efficiency. This yields an uncertainty of 0.6%–6.4%, depending on the considered or bin and on the D∗+ decay mode.
The selection of pion and kaon candidates depends essentially on the measurement as well as on the expectation values used to calculate the probability for a given mass hypothesis . The uncertainty of the calibration changes the efficiency by 0.5%–5.8%. These deviations are used as an estimate of the systematic error.
The systematic error due to the accepted mass range used to classify D0 candidates was examined by comparison of the mass distributions of D0 candidates which contributed to the D∗+ signal in data and Monte Carlo for each D0 decay mode separately. A Gaussian fit was applied to these distributions. The fraction of the fitted Gaussian which lies within the accepted mass range differs between data and Monte Carlo by less than . Thus, the uncertainty due to this source can be neglected.
In order to estimate the error introduced by the method for extracting the number of D∗+ events (Section 4.2) the mean of the fitted Gaussian in Eq. (2) was varied by , and the width was varied by 10% about its values as obtained in Monte Carlo. The resulting relative error on the efficiencies was 0.8%–2.1%.
A variation of the interval that defines the upper sideband yields a variation in of less than . Hence, this source is negligible. The present analysis assumes the fraction to be constant over the considered kinematic range. Monte Carlo studies show a variation of this fraction of up to 12% in this range, depending on the bin in and . A relative uncertainty of 10% is therefore added in quadrature to the statistical uncertainty of . A variation of within these uncertainties yields a variation in the cross section of 0.3%–3.4%, which is used to estimate the introduced uncertainty.
The statistical error of background subtraction and the uncertainties of the total cross section yield a systematic error of 1.2%–3.4% on the differential cross sections.
The overall trigger efficiency of the selected D∗+ events is estimated to be consistent with with a statistical uncertainty of . Thus no correction is made for this source.
The relative errors on the branching ratios given in [10] are used to estimate the corresponding relative systematic uncertainties in the cross sections.
Similarly the relative uncertainties in the efficiencies due to finite statistics in the Monte Carlo samples, 0.5%–2.3%, are taken into account.
All systematic errors are assumed to be uncorrelated and therefore added in quadrature. Table 5 shows a summary of the systematic uncertainties.
5.2.2 Comparison to Theory
Figures 5 and 6 show the measured and in comparison to two different NLO perturbative QCD calculations, the fixed-order (FO) NLO (also known as massive approach) [12] and the resummed (RES) NLO (massless approach) [13]. In both cases, the charm quark mass is set to , the renormalization scale and the factorization scale are chosen such that , where is the transverse momentum of the charm quark. For the resolved contribution the photonic parton densities of the GRS-HO parametrization are chosen [14] in the FO NLO calculation, whereas the RES NLO uses GRV-HO [15]. The fragmentation of the charm quark to the D∗+ is modelled by the fragmentation function suggested by Peterson et al. [6], with in the case of FO NLO. The RES NLO calculation uses , which was determined by using nonperturbative fragmentation functions fitted [13] to ALEPH measurements of inclusive D∗+ production in annihilation [16]. The results of the two NLO QCD calculations are represented by the dashed lines (for RES NLO) and solid lines (for FO NLO) in both Fig. 5 and Fig. 6. In order to estimate the theoretical uncertainties, the FO NLO calculation was repeated with the charm mass and the renormalization scale varied as described in the figures. The RES NLO calculation is also repeated using the AFG [17] ansatz as an alternative for parton density function and varying the renormalization and factorization scales. The resulting theoretical uncertainties are indicated by the bands around the corresponding default values in Figs. 5 and 6.
Altogether, the measurement of seems to favour a harder spectrum than predicted. The RES NLO calculation clearly overestimates the measurement in the low region, while the FO NLO calculation slightly underestimates it in the region. The measured is consistent with the almost flat distribution predicted by both NLO calculations, but the measurement of is again overestimated by the RES NLO calculation and somewhat underestimated by the FO NLO calculation.
5.3 Visible Cross Section
The visible cross section is calculated separately in the acceptance range [Eq. (1)] for the three considered decay modes by
| (4) |
where the notation is as the same as in Eq. (3). The numbers of found and the efficiencies of reconstructing a D∗+ candidate for direct and single-resolved processes are listed in Table 6 together with the derived visible cross sections and their uncertainties for the three decay modes. The systematic error is determined in the same way as for differential cross sections (Section 5.2.1). The weighted average over all of the considered decay modes using the dominating statistical uncertainties for weighting is
| (5) |
The theoretically predicted cross section [12] is
| (6) |
and is consistent with this measurement within the given uncertainties.
5.4 Total Cross Section
The total cross section for the reaction is given by
| (7) |
where the symbols are as follows:
-
•
is the visible inclusive D∗+ cross section determined in the previous section;
- •
-
•
the factor 2 in the denominator takes into account that, for the single inclusive cross sections, both the D∗+ and the D∗- mesons were counted;
-
•
and are the fractions of the direct and single-resolved contributions in the considered acceptance range, as described in Section 5.1;
-
•
is the ratio
of the total D∗+ cross section to the visible cross section in the range of Eq. (1) for direct processes. It describes the extrapolation of the measured cross section to the total phase space available. is the corresponding quantity for the single-resolved case.
Separate Monte Carlo samples are used to estimate and for direct and single-resolved processes. The parameters used to determine and are described in Section 3. This yields and .
The main theoretical uncertainties entering the calculation of the extrapolation factors stem from the uncertainty of the charm quark mass. A variation of the charm mass to and yields relative errors on of and on of +43% and , respectively.
In the single-resolved case an additional uncertainty enters by the choice of the parton density functions describing the resolved photon. Alternatively to the default choice the GRV-LO parametrization [19] was used to calculate . This yields a relative deviation of 12% and is added in quadrature to the other systematic uncertainties on . The following values are therefore obtained:
| (10) |
The uncertainties in , , and , which are assumed to be uncorrelated, are taken into account in the estimation of the statistical and systematic error on the total cross section by Gaussian error propagation. This procedure yields a total cross section for the reaction at centre-of-mass energies , corresponding to the luminosity weighted average of ,
| (11) |
Alternatively, the total cross section is determined by means of the NLO calculation referenced in the previous section; in this case the cross section is given by
| (12) |
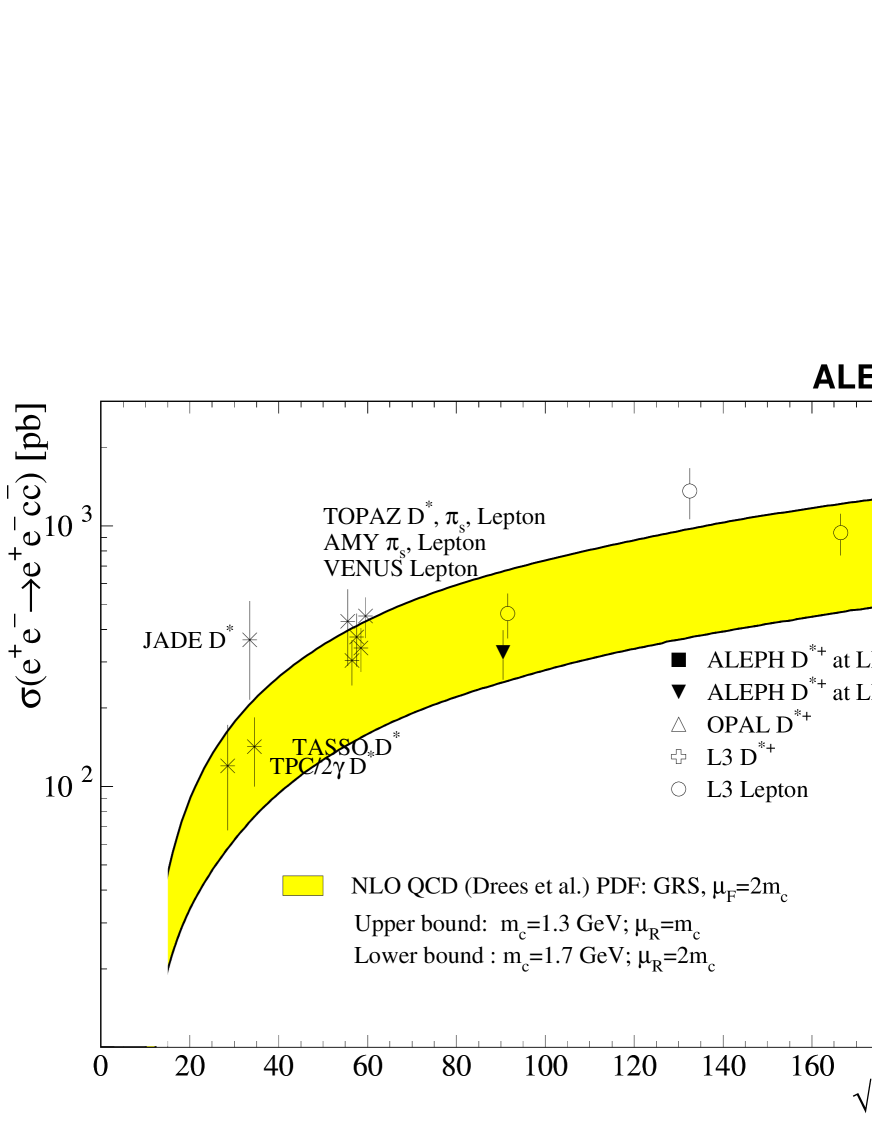
The value is extracted from [12] by determining the ratio of the calculated total charm cross section to the charm cross section calculated for the visible D∗+ range considered in the present analysis. Variation of the parameters entering the calculation yields deviations in the range from to , which are used as an estimate of the systematic error due to the extrapolation. This results in a total cross section
| (13) |
6 Conclusions
The inclusive production of D∗+ mesons in two-photon collisions was measured using the ALEPH detector at LEP 2 energies in the reaction D. The D0 mesons were identified in the decay modes K, K, and K. A total of D∗+ events from was found in the kinematic region and .
The fractions of the main contributing processes, direct and single-resolved, were determined using the event variable to be and , within the acceptance.
The differential cross sections and were measured and compared to the fixed-order (FO) NLO QCD calculation [12] and the resummed (RES) NLO QCD calculation [13]. While the data show a slightly harder spectrum in the distribution compared to both calculations, the almost flat distribution of which is predicted by the NLO calculations for the visible D∗+ region is in agreement with the measurement. Overall, the measurements of and were slightly underestimated by the FO NLO calculation and overestimated by the RES NLO calculation.
For the integrated visible D∗+ cross section a value of is obtained which is consistent with the FO NLO calculation.
The extrapolation of the visible D∗+ cross section to the total cross section of charm production introduces large theoretical uncertainties and has a large relative uncertainty. Using the LO calculation of the Pythia Monte Carlo we obtain
A different method using the results from the FO NLO calculation [12] yields a higher cross section and a larger error.
Acknowledgements
We wish to thank our colleagues in the CERN accelerator divisions for the successful operation of LEP. We are indebted to the engineers and technicians in all our institutions for their contribution to the excellent performance of ALEPH. Those of us from non-member countries thank CERN for its hospitality. We would like to thank Stefano Frixione and Bernd Kniehl for fruitful discussions.
References
- [1] M. Drees, M. Krämer, J. Zunft, and P. M. Zerwas, Phys. Lett. B 306 (1993) 371.
- [2] ALEPH Collaboration, ALEPH: A Detector for Electron-Positron Annihilations at LEP, Nucl. Instrum. Meth. A 294 (1990) 121;The Design, Construction and Performance of the ALEPH Silicon Vertex Detector, Nucl. Instrum. and Methods A379 (1996) 121.
- [3] ALEPH Collaboration, Performance of the ALEPH Detector at LEP, Nucl. Instrum. Meth. A 360 (1995) 481.
- [4] T. Sjöstrand, Comput. Phys. Commun. 82 (1994) 74.
- [5] G. A. Schuler and T. Sjöstrand, Z. Phys. C 68 (1995) 607.
- [6] C. Peterson, D. Schlatter, I. Schmitt, and P. Zerwas, Phys. Rev. D 27 (1983) 105.
- [7] S. Jadach, B.F.L. Ward and Z. Wa̧s, The Monte Carlo program KORALZ, version 4.0, for the lepton or quark pair production at LEP / SLC energies, Comput. Phys. Commun. 79 (1994) 503.
- [8] J.A.M. Vermaseren,Two Photon Processes at very high-energies, Nucl. Phys. B229 (1983) 347.
- [9] S. Jadach, M. Skrzypek, W. Placzek and Z. Wa̧s, Comput. Phys. Commun. 94 (1996) 216.
- [10] Particle Data Group, Review of Particle Physics, Eur. Phys. J. C 15 (2000) 1.
- [11] The L3 Collaboration, M. Acciarri et al., Phys. Lett. B 503 (2001) 10.
- [12] S. Frixione, M. Krämer, and E. Laenen, Nucl. Phys. B 571 (2000) 169.
- [13] J. Binnewies, B.A. Kniehl and G. Kramer, Phys. Rev. D 58 (1998) 014014; D 53 (1996) 6110.
- [14] M. Glück, E. Reya, and I. Schienbein, Phys. Rev. D 60 (1999) 54019.
- [15] M. Glück, E. Reya, and A. Vogt, Phys. Rev. D 46 (1992) 1973.
- [16] ALEPH Collaboration, Study of charm production in Z decays, Eur. Phys. J. C 16 (2000) 597.
- [17] P. Aurenche, J.P. Guillet, and M. Fontannaz, Z. Phys. C 64 (1994) 621.
- [18] The LEP Collaborations ALEPH, DELPHI, L3, OPAL, the LEP Electroweak Working Group and the SLD Heavy Flavour and Electroweak Groups, CERN-EP/2001-021.
- [19] M. Glück, E. Reya, and A. Vogt, Phys. Rev. D 45 (1992) 3986.
- [20] The OPAL Collaboration, G. Abbiendi et al., Eur. Phys. J. C 16 (2000) 579.
- [21] The L3 Collaboration, P. Achard et al., CERN-EP/2002-012.
- [22] The L3 Collaboration, P. Acciari et al., Phys. Lett. B 453 (1999) 83.
- [23] G. Altarelli, T. Sjöstrand and F. Zwirner, Physics at LEP2, CERN 96-01 (1996).
- [24] A. Böhrer and M. Krawczyk, Summary of PHOTON 2001, hep-ph/0203231.
| Process | Monte Carlo Generator |
|---|---|
| PYTHIA 5.7 [4] | |
| KORALZ 4.2 [7] | |
| PHOT02 [8] | |
| KORALW 1.21 [9] |
| range | ||||||||||
|---|---|---|---|---|---|---|---|---|---|---|
| [GeV/] | ||||||||||
| 2– | 3 | 69.8 | 10.7 | 18.7 | 6.2 | 54.5 | 10.3 | |||
| 3– | 5 | 72.2 | 8.1 | 29.0 | 7.8 | 44.9 | 9.7 | |||
| 5– | 12 | 15.1 | 3.0 | 20.9 | 5.7 | 29.2 | 6.8 | |||
| Efficiency for direct process | ||||||||||
| 2– | 3 | 27.96 | 0.13 | 2.27 | 0.04 | 11.66 | 0.09 | |||
| 3– | 5 | 46.94 | 0.20 | 6.83 | 0.10 | 24.16 | 0.17 | |||
| 5– | 12 | 48.73 | 0.34 | 12.32 | 0.23 | 30.13 | 0.33 | |||
| Efficiency for single-resolved process | ||||||||||
| 2– | 3 | 26.81 | 0.12 | 2.12 | 0.04 | 10.49 | 0.09 | |||
| 3– | 5 | 41.95 | 0.21 | 6.17 | 0.10 | 20.78 | 0.18 | |||
| 5– | 12 | 34.59 | 0.41 | 8.8 | 0.24 | 19.83 | 0.36 | |||
| 2– | 3 | 13.80 | 2.12 | 1.04 | 12.70 | 4.21 | 1.20 | 13.38 | 2.51 | 0.89 |
| 3– | 5 | 4.36 | 0.49 | 0.22 | 3.32 | 0.90 | 0.27 | 2.70 | 0.58 | 0.17 |
| 5– | 12 | 0.27 | 0.05 | 0.01 | 0.41 | 0.11 | 0.03 | 0.44 | 0.10 | 0.03 |
| range | ||||||||||
|---|---|---|---|---|---|---|---|---|---|---|
| 0.0– | 0.5 | 49.2 | 8.9 | 21.8 | 6.8 | 51.1 | 10.0 | |||
| 0.5– | 1.0 | 50.8 | 8.3 | 26.4 | 7.6 | 45.8 | 9.5 | |||
| 1.0– | 1.5 | 56.4 | 7.9 | 18.5 | 6.3 | 29.3 | 7.6 | |||
| Efficiency for direct process | ||||||||||
| 0.0– | 0.5 | 41.71 | 0.19 | 5.45 | 0.09 | 20.90 | 0.16 | |||
| 0.5– | 1.0 | 39.07 | 0.19 | 5.24 | 0.08 | 19.70 | 0.16 | |||
| 1.0– | 1.5 | 27.88 | 0.17 | 3.72 | 0.07 | 12.19 | 0.13 | |||
| Efficiency for single-resolved process | ||||||||||
| 0.0– | 0.5 | 37.55 | 0.20 | 4.53 | 0.08 | 17.31 | 0.16 | |||
| 0.5– | 1.0 | 34.74 | 0.19 | 4.16 | 0.08 | 15.95 | 0.15 | |||
| 1.0– | 1.5 | 24.08 | 0.16 | 2.75 | 0.06 | 9.66 | 0.11 | |||
| 0.0– | 0.5 | 13.33 | 2.40 | 0.85 | 12.86 | 4.02 | 1.10 | 14.40 | 2.80 | 1.00 |
| 0.5– | 1.0 | 14.78 | 2.40 | 0.86 | 16.48 | 4.75 | 1.36 | 13.81 | 2.87 | 0.91 |
| 1.0– | 1.5 | 23.22 | 3.24 | 2.10 | 16.59 | 5.63 | 1.73 | 14.35 | 3.70 | 1.31 |
| range | |||||||||
| 2–3 | 3–5 | 5–12 | |||||||
| 13.50 | 1.51 | 1.01 | 3.61 | 0.34 | 0.21 | 0.32 | 0.04 | 0.02 | |
| range | |||||||||
| 0.0–0.5 | 0.5–1.0 | 1.0–1.5 | |||||||
| 13.62 | 1.65 | 0.94 | 14.65 | 1.71 | 0.94 | 18.93 | 2.23 | 1.75 | |
| Source | Estimated uncertainty |
|---|---|
| Event selection | (0.6–6.4)% |
| K/ selection | (0.5–5.7)% |
| Accepted mass range for D0 | , neglected |
| D∗+ selection | (0.8–2.1)% |
| D∗+ from annihilation events | , neglected |
| background subtraction | (1.2–3.4)% |
| Fraction of direct/resolved / | (0.3–3.4)% |
| BR | 2.0% |
| BR | 2.3% |
| BR | 6.5% |
| BR | 5.3% |
| Statistical limitation in Monte Carlo | (0.5–2.3)% |
| 156.4 | 14.9 | 67.4 | 12.3 | 128.4 | 16.3 | ||||
|---|---|---|---|---|---|---|---|---|---|
| 36.47 | 0.1 | 4.81 | 0.05 | 17.71 | 0.09 | ||||
| 31.68 | 0.1 | 3.76 | 0.04 | 14.07 | 0.08 | ||||
| (pb) | 24.68 | 2.35 | 1.47 | 23.04 | 4.21 | 1.91 | 21.76 | 2.76 | 1.41 |
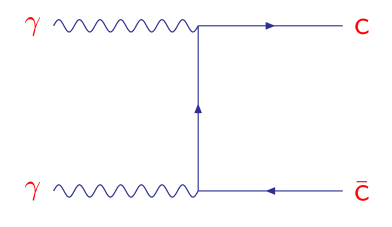
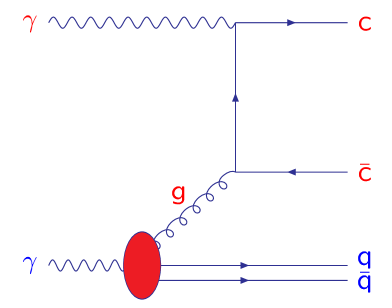
a) Direct process b) Single-resolved process