Measurement of direct photon emission in decay using stopped positive kaons
Abstract
The radiative decay () has been measured with stopped positive kaons. A sample containing 4k events was analyzed, and the branching ratio of the direct photon emission process was determined to be . No interference pattern with internal bremsstrahlung was observed.
E-mail address: suguru@phys.wani.osaka-u.ac.jp (Suguru SHIMIZU)
, , , , , , , , , , , , , , , , , and
1 Introduction
The chiral anomaly [1], which is a basic feature of quantum field theory, has been the subject of extensive theoretical investigations. There are a number of calculations for decays of the pseudoscalar mesons – , , and [2]; however few experimental studies of this anomaly have been performed so far. With the increased interest in chiral perturbation theory (ChPT) [3], the chiral anomaly has attracted renewed attention. In particular, non-leptonic kaon decays are well-suited for the study of ChPT. It is known, however, that the genuine manifestation of the chiral anomaly in non-leptonic decays is restricted to the radiative decay of () for the charged kaon [4].
The () decay is hindered because it violates the =1/2 rule. As a consequence, the internal bremsstrahlung (IB) contribution to decay is suppressed, although it is still dominant. This feature, in turn, could enhance the direct photon emission (DE) which is sensitive to meson structure. Here, the chiral anomaly appears as the magnetic component of DE. In terms of ChPT, it enters the magnetic amplitude at ), while IB arises from [4]. Also, the electric amplitude of DE may arise from ), which one can identify through the interference pattern (INT) with IB. Thus the decay channel is one of the most interesting and important channels in determining the low energy structure of QCD.
Three in-flight- experiments [5, 6, 7] and one stopped- experiment [8] have reported on the DE branching ratio in the kinetic energy region of MeV. These experiments restricted the region to avoid backgrounds from () decay, although the DE component is significantly enhanced with decreasing energy. The weighted average of the in-flight experiments is [9] which is much larger than the result from the stopped experiment [8]. Therefore, further experimental studies are necessary to settle this discrepancy of the DE branching ratio. It is also desirable to check the existence of the INT component which has not yet been observed.
In this letter, we present a new measurement of direct photon emission in decay. The experiment used a stopped beam in conjunction with a superconducting toroidal spectrometer with a 12-sector iron-core [10]. We measured the events by extending the region (35 MeV) below the upper threshold (55 MeV).
2 Experiment
The experiment was performed at the KEK 12 GeV proton synchrotron. The experimental apparatus was based on the E246 experiment searching for -violating transverse muon polarization in () decay [11]. Besides the -violation search, spectroscopic studies for (), , and decays have been carried out using the same detector system [12, 13, 14]. A schematic cross sectional view of the detector is shown in Fig. 1. Because of the rotational symmetry of the 12 identical gaps in the spectrometer and the large directional acceptance of the photon detector [15], distortions of the spectra due to instrumental misalignment, if any, were drastically reduced.
A separated 660 MeV/ beam () was used. Each was discriminated from pion background by a erenkov counter with an efficiency of more than 99%. The typical beam intensity was over a 2 s spill duration with a 4 s repetition rate. The kaons were slowed down by a degrader and stopped in an active target located at the center of the detector system.
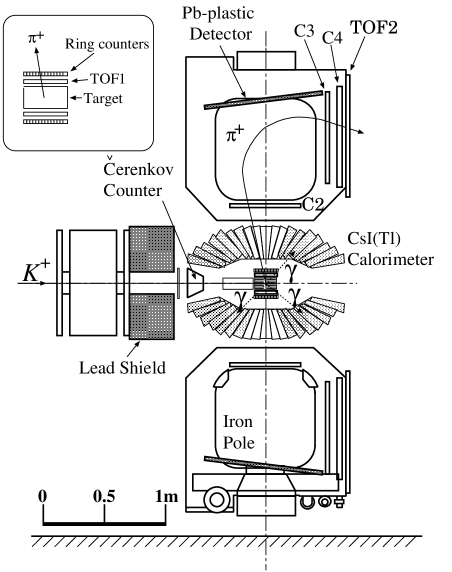
The events were identified by analyzing the momentum with the spectrometer and detecting three photons in the CsI(Tl) calorimeter. Charged particles from the target were tracked and momentum-analyzed using multi-wire proportional chambers at the entrance (C2) and exit (C3 and C4) of the magnet gap, as well as an array of ring counters [16] surrounding the active target system. The s were discriminated from and by calculating the mass squared () of the charged particles from the time-of-flight between TOF1 and TOF2 counters. Counter TOF1 surrounded the active target and counter TOF2 was located at the exit of the spectrometer. The measurement was carried out for the central magnetic field strength B=0.65 T which was chosen to match the spectrometer acceptance to the momentum distribution due to the DE process.
The photon detector, an assembly of 768 CsI(Tl) crystals, covered 75% of the total solid angle. There were 12 holes for outgoing charged particles to enter the spectrometer and 2 holes for beam entrance and exit, as shown in Fig. 1. The photon energy and hit position were obtained, respectively, by summing the energy deposits and taking the energy-weighted centroid of the crystals sharing a shower. Timing information from each module was used to identify a photon cluster and to suppress accidental backgrounds due to beam particles. A Pb-plastic sandwich detector with 2.6 radiation length was set at the outer radius of the magnet pole to monitor photons passing through the photon detector holes, as shown in Fig. 1.
3 event selection
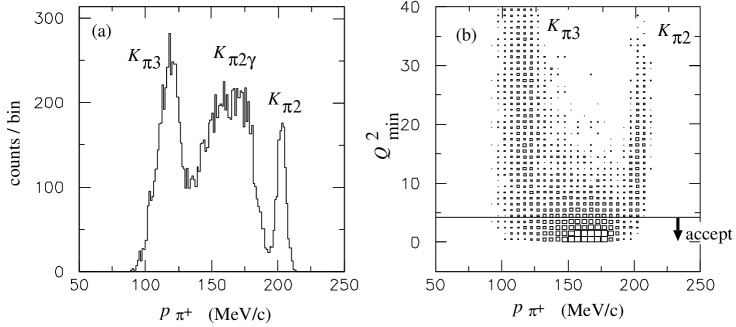
decays at rest were obtained by the following procedure which was carefully studied in a Monte Carlo simulation (see below). The decay time, defined as the signal at the TOF1 counter, was required to be more than 1.4 ns later than the arrival time measured by the erenkov counter. This reduced the fraction of decays in-flight contamination to the level of . Events with decays in-flight and scattering of charged particles from the magnet pole faces were eliminated by requiring the hit position in ring counters to be consistent with the charged particle track. The selection of , by MeV, rejected s and s. To remove events, the reconstructed momentum (Fig. 2(a)), corrected for the energy loss in the target, was required to be 175 MeV/. Events with three clusters in the CsI(Tl) calorimeter were selected by assigning two photons from and a radiated photon (), while events with other cluster number were rejected. The opening angle between the two photons was required to be larger than 37∘ to eliminate photon conversion backgrounds in the active target system. Also, the photon conversion events could be removed by selecting only events in which there was one charged particle hit in TOF1 as well as in ring counters. The total energy and momentum vector were used to reject background contaminations. The windows of MeV/ and 50 MeV/ were imposed.
The final step in reconstructing was to determine which photons were a pair from a , because there are three possible combinations to form the . The IB events with incorrect pairing mimic the DE decay and might introduce a systematic error. In order to find the correct pairing, a quantity defined as,
| (1) | |||||
was calculated for the three combinations, and the pair with the minimum , , was adopted as the pair. Here, is the invariant mass of the selected pair and is the energy obtained as,
| (2) |
where is the opening angle of the selected pair and is the rest mass of . The angles and are that between and and that between and , respectively. The superscripts MEAS and CALC stand for the measured angles and the calculated angles using the kinematics as,
| (3) | |||||
| (4) |
where , , and denote the rest mass, energy, and momentum vector, respectively, of the particle shown in the subscript. The and offset values for each term were = 11.4 MeV/, =10.5 MeV/, =0.48, =0.06, MeV/, MeV/, =0.35, and =0.06. The choice of Eq. (1) and these parameters was determined to get the highest probability for the correct pairing by using a simulation with the IB component. The correct pairing probability was estimated to be 85% for IB, 79% for DE, and 83% for INT. Since and decays do not satisfy the kinematics, the values of the and events are essentially larger, as shown in Fig. 2(b). Therefore, the cut of drastically reduced these contaminations.
The number of good events is 4434 after the above standard selection conditions. The background fraction of the decay was estimated to be 1.2% from the simulation. The solid lines in Fig. 3 show the experimental spectra after subtracting the backgrounds: (a) momentum, (b) opening angle between and , (c) opening angle between and , and (d) energy. These are compared with the calculated ones (see below).

4 Monte Carlo simulation
In order to obtain the detector response function, a Monte Carlo simulation was carried out for both the measurement by the spectrometer and the photon measurement by the CsI(Tl) calorimeter using a GEANT-based Monte Carlo code. In this simulation, events due to the IB, DE, and INT processes were generated with the corresponding matrix elements [17] and analyzed in the same manner as the experimental data. The accuracy of the simulation was carefully checked by comparing the spectrum with the experimental one. The decay was also used to check the reproducibility of the experimental conditions in the simulation.
The detector acceptance ratios were obtained to be and which were used to determine relative decay strength of the DE and INT components normalized to the IB component. Here it should be noted that events with incorrect pairing were included in the sample, and this effect was also treated in the simulation. The pairing probability could be controlled by requiring extra cuts in addition to the standard cuts at the cost of good events. Two cut conditions, (I) and (II) or , were individually or simultaneously imposed, where is the second smallest value among the three combinations. The pairing probability and good event acceptance under these conditions are summarized in Table 1. It is possible to increase the probability up to 95% (IB) and 85% (DE), although 23% of the events are rejected. These cuts were used for the estimation of systematic errors.
| Condition | (IB) | (DE) | (IB) | (DE) |
|---|---|---|---|---|
| () | () | (%) | (%) | |
| standard | 0.24 | 0.63 | 85 | 79 |
| standard(I) | 0.20 | 0.53 | 91 | 84 |
| standard(II) | 0.22 | 0.53 | 92 | 80 |
| standard(I)(II) | 0.18 | 0.46 | 95 | 85 |
The background was also estimated by the simulation and subtracted from the experimental data. Since the present spectrometer acceptance overlapped the region, the estimation of the fraction was important. The obvious events were identified as 3 photon clusters with one escaping photon using cuts of 55 MeV ( MeV/), MeV/, MeV, and . These events were compared with the simulation to confirm the accuracy of the simulation and to check the correctness of the background estimation. Fig. 4(a),(b) show the distributions of the and events, respectively, for the experimental data (solid line) and the simulation (dotted line). They are in excellent agreement, supporting the correct estimation of the fraction in the sample. The dashed line in Fig. 4(a) shows the simulated background which survived after the selection.

5 Results
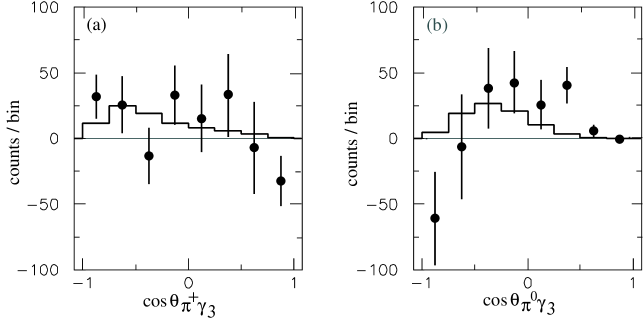
The DE branching ratio was determined using the three observables, cos, cos, and which have characteristic spectra corresponding to the decay processes. The experimental distribution of data from the standard cut conditions was fitted to a simulation spectrum of IB[1+(DE/IB)+(INT/IB)] with and being free parameters. The DE and INT components were obtained to be =(0.92)% and =()%, respectively. The reduced is 1.27. Fig. 5 shows the contour plot in the (, ) space. is consistent with zero and we conclude that there is no significant INT component observed within the experimental accuracy. By assuming in the fitting, the DE component was determined to be =(0.760.31)% with a reduced =1.28. The DE branching ratio was derived to be =(6.12.5) by normalizing it to the theoretical value of the IB branching ratio [17]. The dotted and dashed lines in Fig. 3 show the fitted spectra and the sole DE components, respectively, under the assumption of 0. It can be seen that 26% of DE comes from the region MeV. Fig. 6(a),(b) show the cos and cos spectra, respectively, of the DE component obtained by subtracting the fitted IB component from the experimental data (dots) and the fitted DE component (histogram).

The major systematic errors in the DE measurement come mainly from imperfect reproducibility of the experimental conditions in the simulation as follows. The mispairing effect was studied by varying the pairing probability. In addition to the standard selection conditions, extra cuts given in Table.1 were imposed. The DE branching ratio was found to be consistent within 0.17% which was regarded as the upper bound of this systematic error. The uncertainty due to the calibration error of the CsI(Tl) calorimeter was evaluated by introducing the maximum conceivable errors in the simulation, and found to be %. The fraction in the data depends slightly on the decay form factors, however this effect is negligibly small. The systematic error due to the ambiguity of the fraction was obtained as % by rejecting events with 55 MeV. The contribution from the accidental background was estimated to be % by changing its fraction varying the TDC gate widths. The uncertainty due to the spectrometer field ambiguity was obtained to be %. As shown in Table 2, the total systematic error was estimated to be 0.23% by adding all the item in quadrature. However, this upper bound was regarded here as one standard deviation of the systematic error.
| Error source | Uncertainty of (%) |
|---|---|
| mispairing | 0.17 |
| calibration | 0.13 |
| background | 0.03 |
| Accidental background | 0.08 |
| Spectrometer field ambiguity | 0.02 |
| Total systematic error | 0.23 |
6 Conclusion
We have performed a new measurement of the decay by extending the lower bound down to 35 MeV. The detector response and acceptance functions were evaluated by a Monte Carlo simulation based on GEANT. The reproducibility of the experimental conditions in the simulation was carefully checked using and decays. The background contamination in the data sample was also estimated by the simulation.
Comparing the experimental data with the simulation, the DE component was obtained to be
under the assumption of no INT component. The DE branching ratio was then determined to be
by normalizing it to the theoretical value of the IB branching ratio [17]. In order to compare this result with the previous ones, the partial branching ratio in the region of MeV was also calculated as
which is consistent with the previous stopped experiment [8]. We did not observe any significant effect due to the INT component, indicating the pure magnetic nature of the direct photon emission process in decay.
References
- [1] S.L. Adler, Phys. Rev. 177 (1969) 2426; J.S. Bell and R. Jackiw, Nuovo Cimento 60A (1969) 47; W.A. Bardeen, Phys. Rev. 184 (1969) 1848.
- [2] J.F. Donoghue and D. Wyler, Nucl. Phys. B316 (1989) 289; J. Bijnens, Nucl. Phys. B337 (1990) 635; C. Riggenbach et al., Phys. Rev. D43 (1991) 127.
- [3] A. Buras, Theoretical review of K-physics, hep-ph/9609324; A. Pich, Rare kaon decays, hep-ph/9610243.
- [4] G. Ecker, H. Neufeld, and A. Pich, Nucl. Phys. B413 (1994) 321; Phys. Lett. B278 (1992) 337.
- [5] R.J. Abrams et al., Phys. Rev. Lett. 29 (1972) 1119.
- [6] K.M. Smith et al., Nucl. Phys. B109 (1976) 173.
- [7] V.N. Bolotov et al., Sov. J. Nucl. Phys. 45 (1987) 1023.
- [8] S. Adler et al., Phys. Rev. Lett. 85 (2000) 4856.
- [9] Particle Data Group, Eur. Phys. J. C15, Review of Particle Physics (2000).
- [10] J. Imazato et al., in Proceedings of the 11th International Conference on Magnet Technology (Elsevier Applied Science, London, 1990), p.366.
- [11] M. Abe et al., Phys. Rev. Lett. 83 (1999) 4253.
- [12] S. Shimizu et al., Phys. Lett. B495 (2000) 33; A.S. Levchenko et al., hep-ex/0111048.
- [13] K. Horie et al., Phys. Lett. B513 (2001) 311.
- [14] Y.-H. Shin et al., Eur. Phys. J. C12 (2000) 627.
- [15] D.V. Dementyev et al., Nucl. Instr. Method A440 (2000) 151.
- [16] A.P. Ivashkin et al., Nucl. Instr. Method A394 (1997) 321.
- [17] G. D’Ambrosio, M. Miragliuolo, and P. Santorelli, in , edited by L. Maiani, G. Pancheri, and N. Paver (Laboratori Nazionali di Frascati, Frascati, 1992).