News from the Muon (g-2) Experiment at BNL
Abstract
The magnetic moment anomaly of the positive muon has been measured at the Brookhaven Alternating Gradient Synchrotron with an uncertainty of 0.7 ppm. The new result, based on data taken in 2000, agrees well with previous measurements. Standard Model evaluations currently differ from the experimental result by 1.6 to 3.0 standard deviations.
1 Introduction
According to Dirac’s theory, the gyromagnetic ratio of a lepton is exactly 2. Deviations from this prediction are caused by radiative corrections to the lepton-photon vertex due to quantum field fluctuations. The anomaly of the electron is currently known at the level of 4 ppb [1] and well in agreement with the Standard Model. Since the contribution of heavy virtual particles to the anomaly is proportional to the square of the mass scale, the sensitivity of the muon is enhanced by a factor relative to the electron. At the present level of precision, the muon anomaly probes QED, weak and hadronic contributions.
2 Experimental Setup and Data Analysis
The general technique of the experiment at BNL is the same as that of the precursor experiment at CERN [2]. Polarised muons are stored in a highly uniform magnetic dipole field with electrostatic quadrupoles [3] providing vertical focussing. The muon spin precesses relative to the momentum vector with the angular frequency
| (1) |
provided that . The dependence of on the electric field (second term in Eq. (1)) is eliminated by storing the muons at the “magic” , corresponding to a momentum = 3.094 GeV/. In this case, is given by simultaneous measurement of and , the magnetic field averaged over the spatial muon distribution in the storage region. As explained later, is reflected by the rate of decay positrons above a certain energy threshold. The magnetic field is measured in terms of the free proton precession frequency in this field using nuclear magnetic resonance (NMR) probes. Then, can be expressed as
| (2) |
where is the ratio of the magnetic moments of the muon to the proton, which has been measured with a precision of 30 ppb [4]. To avoid experimenter biases, a “blind analysis” strategy is pursued, separating the and analyses with secret offsets which are only revealed when both analyses are complete and internally consistent.
The beam used for the experiment originates at the Alternating Gradient Synchrotron (AGS) which every 2.5 s delivers 40–60 1012 protons at 24 GeV/ onto a nickel target. Each proton spill is composed of 12 bunches with a width of about 50 ns and a separation of 33 ms. Downstream of the target, pions at 3.1 GeV/ are selected into a 72 m long straight beam line where about half of them decay into muons. Because of parity violation in the pion decay, the selection of forward-going muons leads to a polarisation of about 96 %. Muons at the magic momentum are selected and injected into the storage ring through a hole in the yoke of the dipole magnet whose 1.45 T field is locally cancelled by a DC super-conducting inflector magnet [5]. To move the muons onto the central orbit, a kick of about 11 mrad is given by a pulsed kicker magnet [6]. The continuous superferric ‘C’-shaped storage ring magnet [7] is excited by superconducting coils. The muon storage region has a 9 cm diameter cross-section and a central radius of 7.112 m, corresponding to a cyclotron period of 149.2 ns for muons at .
A vertical air gap between pole and yoke decouples the yoke and pole pieces, which are fabricated from high quality steel, and allows the insertion of iron wedges to improve the field homogeneity by compensating the quadrupole field components. The four edge shims, 5 cm wide and about 3 mm high, are the main tool for reducing field variations over the beam cross-section. Surface coils glued to the pole pieces are used to further reduce the inhomogeneity of the field.
The field inside the storage region is mapped twice a week using a hermetically sealed cable-car with a matrix of 17 NMR probes moving on rails in the vacuum beam pipe and measuring a transverse field map about every 5 mm. The probes in the trolley are calibrated in place relative to a standard H2O probe for which the calibration ratio between the precession frequencies of protons bound in water and free protons is known to 50 ppb [8].
During data taking, an array of 375 NMR probes embedded in the top and bottom plates of the vacuum chamber is used to monitor magnetic field variations between trolley measurements and to stabilise the field with a feed-back loop to the main magnet power supply [9].
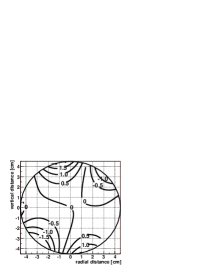
Two independent analyses determined , averaged over the muon distribution. Their results agree within 0.05 ppm. The systematic uncertainties for are summarised in Table 1. As a final result, the value Hz (0.2 ppm) was obtained. The improvement from 0.4 ppm systematic error in 1999 to 0.24 ppm in 2000 comes mainly from the better field homogeneity (Figure 1) which was achieved by replacing the old inflector whose super-conducting fringe-field shield had a flux leak.
| Source of errors | Size [ppm] |
|---|---|
| Absolute calibration of standard probe | 0.05 |
| Calibration of trolley probes | 0.15 |
| Trolley measurements of central | |
| azimuthal average field | 0.10 |
| Interpolation with fixed probes | 0.10 |
| Uncertainty from muon distribution | 0.03 |
| Others† | 0.10 |
| Total systematic error on | 0.24 |
| † higher multipoles, trolley temperature and voltage response, eddy currents from kickers, and time-varying stray fields. | |
The decay positrons from range in energy from 0 to 3.1 GeV, and are detected with 24 lead/scintillating-fiber calorimeters [10] placed symmetrically around the inside of the storage ring. The arrival times and energies of the positrons are determined from the calorimeter pulses whose full shapes are sampled by a 400 MHz waveform digitiser (WFD). A laser and light-emitting-diode (LED) system is used to monitor potential time and gain shifts.
Because of parity violation in the weak muon decay, in the muon rest frame positrons are preferentially emitted along the muon spin direction. Since in the lab frame forward positrons are boosted to high energies, the muon spin precession frequency modulates the decay positron count rate if a lower energy threshold is applied:
| (3) |
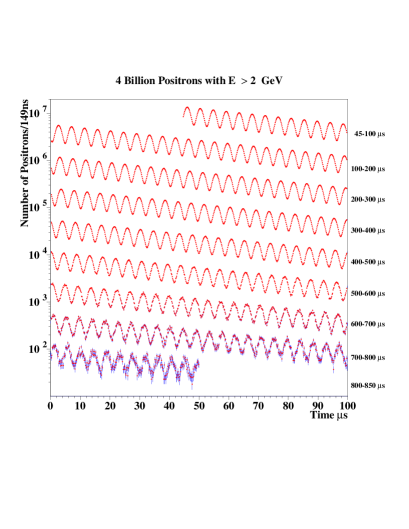
where s is the dilated muon lifetime. For an energy threshold of 2 GeV, the asymmetry is about 0.4. Figure 2 shows the sum of the decay positron time spectra observed by all detectors within a time range of 805 s or roughly 12 muon lifetimes. The total number of positrons recorded later than 45 s after injection is about . Error bars are drawn on all points but are only visible at very late times because of the huge statistics of up to entries per 149 ns time bin. Given this high number of events, the simple parametrisation in Eq. (3) proved not to be adequate for fitting the spectrum which is affected by several significant perturbations.
We shall concentrate here on the leading systematic effect caused by coherent betatron oscillations – oscillations of the beam as a whole. Since the inflector aperture is smaller than the storage ring aperture, the phase space for betatron oscillations is not filled, which leads to a radial modulation of beam width and centroid. Looking from fixed detector positions, these oscillations have a frequency of 466 kHz, approximately given by where MHz is the cyclotron frequency and is the field index adjusted by the electric quadrupole voltage [3]. The value of was chosen far away from physical resonance conditions which could lead to increased muon losses or spin flips. Since both the calorimeter acceptance and the energy distribution of the detected positrons depend on the radial position of the muon decay, the parameters , and in Eq. (3) receive a time modulation, e.g. , where describes the CBO decay due to the muon momentum spread and higher and field multipoles. The time constant is typically 100 s. The modulation – with % – was already observed and included in the analysis of the 1999 data set. Its parameters do not correlate strongly with . The modulations and are smaller – 0.1 % and 1 mrad at respectively – and were only discovered with the higher statistics of the 2000 data set. Their dangerous effect on the time spectrum is the creation of interference terms with the frequency which for our choice of is very close to . This parametric resonance can produce shifts in of up to 4 ppm if individual detector time spectra are fitted without including and . In the sum of all detector spectra, the shifts largely cancel thanks to the circular symmetry of the (g-2) ring. Remaining effects are accounted for by including into the fit and assigning a systematic error for the impact of . Including into the fit turned out to be more difficult because this term induces strong correlations between detector gain changes and , entailing further shifts in .
Other perturbations were treated like in earlier data sets [11]. Pulse pileup effects were removed by statistically superimposing recorded pulses from the data themselves and thus constructing an artificial pileup spectrum which was then subtracted from the untreated spectrum. The effects of beam debunching were eliminated by randomizing the start time of each fill over one cyclotron period. Muon losses were taken into account by multiplying the function in Eq. (3) with an extra loss term. AGS background due to erroneous proton extraction during the muon storage period, which contributed 0.1 ppm uncertainty to the 1999 result, was largely eliminated by installing a sweeper magnet in the beam line.
Four independent analyses with different approaches to take systematic effects into account were completed. Their results agreed within 0.4 ppm – as compared to statistically allowed variations of 0.5 ppm – and were combined to Hz (0.7 ppm). This number contains a correction of +0.76(3) ppm for residual effects of the electric field on muons with and for deviations from Eq. (1) due to vertical beam oscillations (i.e. ). The combined systematic errors listed in Table 2 account for the correlations between the results from the individual analyses.
| Source of errors | Size [ppm] |
|---|---|
| Coherent betatron oscillations | 0.21 |
| Pileup | 0.13 |
| Detector gain changes | 0.13 |
| Lost muons | 0.10 |
| Binning and fitting procedure | 0.06 |
| Others† | 0.06 |
| Total systematic error on | 0.31 |
| † AGS background, timing shifts, E field and vertical oscillations, beam debunching and randomisation. | |
3 Result from the Data Set of 2000 and Comparison with Theory
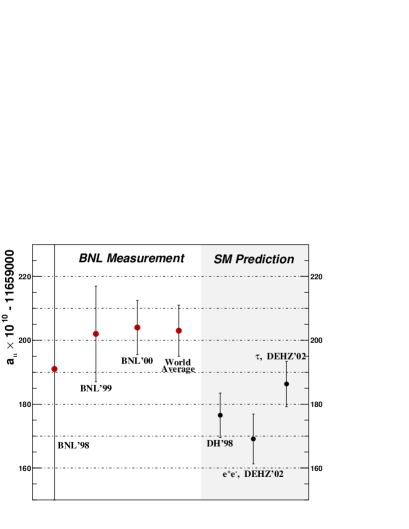
After completion of the and analyses, was calculated according to Eq. (2). The result is (0.7 ppm) [12]. It agrees well with older measurements (Figure 3). The new experimental world average, (0.7 ppm), is dominated by the new result which has about half the uncertainty of previous measurements.
The Standard Model prediction for [14] can be written as
| (4) |
with and . The hadronic contribution cannot be calculated from first principles at this time because it is dominated by low-energy interactions. The first-order hadronic vacuum polarisation contribution, , can be determined from measured annihilation cross-sections over all energies using a dispersion relation. It can also be related to hadronic decay. These calculations are still under theoretical investigation. Higher-order contributions are given by and (had, light-by-light) = +8.6(3.2) . For the latter, a sign error was recently corrected. Figure 3 shows the theoretical predictions for using recent evaluations of . DH’98 [13] is the value used for the comparison in our PRL [12]. In this evaluation, uses data from both annihilation and decay. Later, new data from Novosibirsk [15] gave rise to a new calculation of which does not agree any more with the value obtained from decay data (DEHZ’02: [14]). Using the -based result, , one obtains a total theory prediction (0.7 ppm). Using the -based result, , one obtains a total theory prediction (0.6 ppm). The deviations of the two evaluations from the experimental result correspond to 3.0 and 1.6 standard deviations, respectively. Hence, no unambiguous statement about new physics can be made at present.
4 Outlook
In the year 2001, the experiment was performed with negative muons and with different field indices moving the CBO frequency away from the parametric resonance. The resulting data set of about electrons is currently being analysed. It will provide a test of CPT invariance and – if CPT holds – an improved combined value of . However, in order to achieve the design goal of 0.35 ppm statistical uncertainty, additional events are needed. A new run is planned, but at present funding is uncertain.
Acknowledgements
This work was supported by the U.S. Department of Energy, the U.S. National Science Foundation, the German Bundesminister für Bildung und Forschung, the Russian Ministry of Science, and the US-Japan Agreement in High Energy Physics. Mario Deile acknowledges support by the Alexander von Humboldt Foundation.
References
- [1] R.S. Van Dyck Jr., P.B. Schwinberg and H.D. Dehmelt, Phys. Rev. Lett. 59, 26 (1987).
- [2] J. Bailey et al., Nucl. Phys. B., Vol. B150, No. 1, pp. 1-75, 1979.
- [3] Y. Semertzidis et al., accepted for publication in Nucl. Instr. Meth. A.
- [4] W. Liu et al., Phys. Rev. Lett. 82 (1999) 711.
- [5] A. Yamamoto et al., Nucl. Instr. Methods A 497 (2002) 23-40.
- [6] E. Efstathiadis et al, accepted for publication in Nucl. Instr. Methods A.
- [7] G.D. Danby, et al., Nucl. Instr. Meth. A 457 (2001) 151.
- [8] X. Fei et al., Nucl. Instr. Meth. A. 394 (1997) 349.
- [9] R. Prigl et al., Nucl. Instr. Meth. A 374 (1996) 118.
- [10] S.A. Sedykh et al., Nucl. Instr. Meth. A 455, 346 (2000).
- [11] H.N. Brown et al., Phys. Rev. Lett. 86, 2227 (2001).
- [12] G.W. Bennett et al., Phys. Rev. Lett. 89, 101804 (2002).
- [13] M. Davier and A. Höcker, Phys. Lett. B435, 427 (1998).
- [14] M. Davier et al., hep-ph/0208177, and references therein.
- [15] R.R. Akhmetshin et al., Phys. Lett. B527, 161 (2002).