LEP, SLC and the Standard Model
Abstract
The period 1989-2000 provided a huge yield of precise electroweak data from the LEP and SLC experiments. Many analyses of these data are now complete, but others, particularly of the full LEP-2 data samples, continue. The main electroweak physics results from these data are summarised, and stringent tests of the Standard Model are made with the combined samples. The direct search for the missing link of the Standard Model, the Higgs boson, is also briefly reviewed.
1 Introduction: Data Samples
The Stanford Linear Collider, SLC, was the first electron-positron collider operating at centre-of-mass energies at and around the pole. From the startup in 1989 to the final data collected in 1998, around 20 pb-1 of integrated luminosity was accumulated, in very large part by the SLD detector. Although the data sample is modest when compared to that from LEP, the power to probe the Standard Model is greatly enhanced by the substantial electron beam polarisation, typically 75% in the later years of SLC operation. This unique feature of the data collected by SLD results in the most precise single measurement of the weak mixing angle, as described below.
The large electron-positron collider, LEP, sited at CERN, also started taking data in 1989, and each of the four experiments collected approximately 160 pb-1 of data at and around the peak in the years up to 1995, corresponding to a total of more than 15 million observed decays. A several year programme to increase the accelerating voltage resulted in data-taking above the threshold for production from 1996 to 2000. At these energies substantially increased luminosities were also possible, resulting in approximately 700 pb-1 of data being collected in this “LEP-2” phase of operation. As illustrated in figure 1, the cross-section for W-pair production is three orders of magnitudes lower than that at the Z peak, so that W-pair events collected are numbered in thousands rather than millions.

2 Production and Decays
2.1 The Lineshape

The measurement of the cross-section for fermion pair production at and around the pole was used to measure the Z mass and width, as illustrated schematically in figure 2. Note that a substantial correction is needed for the effects of QED initial-state photon radiation (“ISR”). The analyses from the four LEP experiments have now been final for some time[1], and combining them[2] yields:
| (1) | |||||
| (2) |
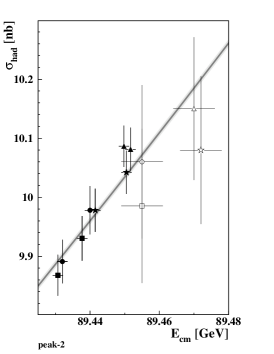
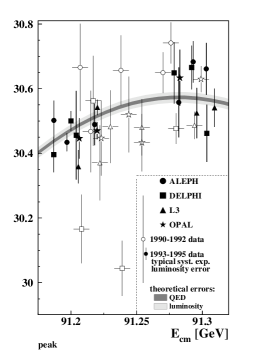
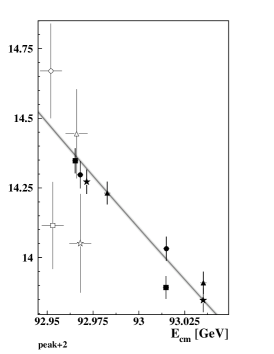
The measurement of the cross-sections to different particle types, either inclusive hadrons, different charged lepton species, or tagged primary quark flavours, gives access to the individual partial decay widths, , via
| (3) |
after correction for ISR effects and for the effects of the t-channel diagrams in the case of the Bhabha scattering process . The extremely high statistics available at the three most precisely measured points, at the peak and 2 GeV away, are illustrated in figure 3.
Further use is made of the Z lineshape results to derive the partial decay width of the to unobserved (invisible) decays, :
| (4) |
where the sum over visible decay products uses the hadronic decay width and the individual charged leptonic ones. If neutrinos are further assumed to have Standard Model couplings, the number of light neutrino species may also be determined from , giving:
| (5) |
Measuring individual Z fermionic decay widths gives access to the sum of the squares of the vector and axial-vector couplings of the fermion species to the , . While this is straightforward for the charged lepton flavours, for quark decay modes it requires high quality flavour tagging: this is only available in practice for b and c quarks, where combinations of tags, utilising such properties as the high b mass and lifetime, are employed. The results obtained are usually expressed in terms of the ratios , defined by . Although the performance of such tags can be excellent in terms of efficiency and purity, especially for b quarks, the precise performance cannot be simulated adequately. This is circumvented by the use of “double tag” techniques, where the tag is applied independently to the two hemispheres of an event, allowing the tagging efficiency and both to be determined. Combining the LEP and SLD results[3], the results for and as shown in figure 4 are obtained. The Standard Model prediction describes the data well, in contrast to the situation seven years ago[4], when the first precise measurements of were available.

2.2 Asymmetries
More information about electroweak parameters is contained in events, basically independent of the cross-section measurements, via the measurement of asymmetries. Many asymmetries have been measured at LEP, and a further powerful probe is possible with the polarised electron beam at SLD.
In the framework of the Standard Model, the various measured asymmetries – after correction for ISR effects – may be written in terms of the asymmetry parameters defined by , which is simply a function of the ratio . The effective weak mixing angle differs slightly for different fermion species, although in practice most asymmetries probe the value for charged leptons, . For example, the forward-backward asymmetry, defined as the ratio , where is the cross-section for fermions scattering in the same (opposite) hemisphere as the original electron beam direction, may be expressed as . As before, the zero superscript denotes correction for ISR effects to Z pole quantities.
The single most precise measurement of comes from the precise measurement of the left-right polarisation asymmetry at SLD. This asymmetry is defined simply as
| (6) |
where () are the numbers of observed events for left and right handed beam polarisations, and is the mean electron beam polarisation. Knowledge of the mean beam polarisation is therefore a major experimental challenge of this measurement, and it is measured with three different techniques at SLD. The final result obtained[5] is , which can be combined with other SLD asymmetry measurements[6] to give .

Combining together the leptonic asymmetry measurements gives an overall value of . This may be further combined with leptonic decay widths to extract the individual couplings of the to the individual lepton species. The results are shown in figure 5, both without and with the assumption of lepton universality. The data are seen to be quite consistent with lepton universality in the neutral current. It is also evident that there is a strong sensitivity to the effects of electroweak radiative corrections, beyond the well-known effects of photon radiation, which alone would give the prediction shown at the right-hand side of the plot, labelled . This illustrates the sensitivity of the precise electroweak data to the mass of heavy particles such as the top quark and Higgs boson via loop corrections, when the Standard Model structure of radiative corrections is assumed.
In addition to those for charged leptons, forward-backward asymmetries are also measurable for b and c quarks. Excellent flavour tagging is needed, as for the measurements of and . In addition, charge tags are needed to separate quark-initiated jets from those initiated by antiquarks. This is typically provided by multivariate discriminants whose performance is calibrated with data, or from semileptonic decay tags. The measured values[7] of and are shown in figure 6 after combination between experiments.
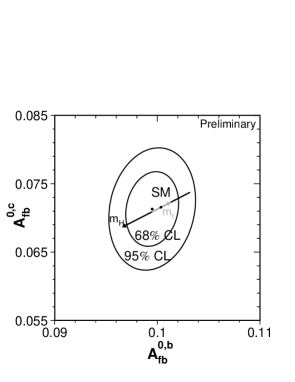
It is interesting to note that, although the heavy quark forward-backward asymmetries measure the combination (f=b,c), the main sensitivity to the electroweak mixing angle arises from , so that the measurements effectively probe . and are relatively precisely predicted by the Standard Model, with little dependence on the Higgs or top quark masses.
A comparison of the values extracted from the different asymmetry measurements is shown in figure 7.
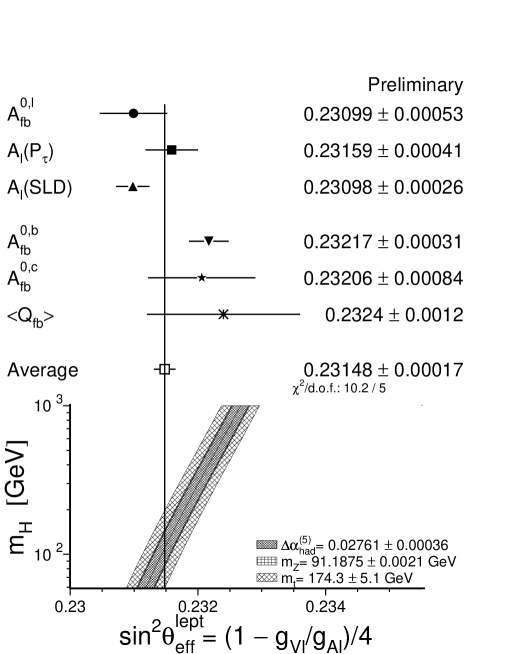
A posteriori, it is observed that the two most precise measurements agree only at the 2.9 level. However, this is an old problem: the discrepancy has been around 3 for the last six years, even though the measurement errors have improved by a factor of 1.5. In the context of the Standard Model, the results can alternatively be summarised as saying that prefers a Higgs mass 400 GeV — unlike most other observables which prefer a low , close to, or even below, the current direct search limits.
3 LEP-2: Fermion and W Pair Production
3.1 Fermion-Pair Production at High Energy


At LEP-2 centre-of-mass energies (130-209 GeV) fermion-pair events very largely divide into two characteristic populations according to the invariant mass () of the final-state fermions. This is illustrated in figure 8(left): some events have close to the full centre-of-mass energy (“non-radiative”) while others have one or more hard initial-state radiation photons which have lowered to around (“radiative return”). The sizeable contribution of radiative return events is illustrated by figure 8(right).
The properties of non-radiative events thus probe the full centre-of-mass energy of the colliding beams, in contrast to the radiative return events which should be typical decays. It is therefore particularly interesting to use the non-radiative cross-sections and asymmetries to probe the quality of the Standard Model predictions: deviations could indicate effects of new physics at higher mass scales. LEP combined cross-section and forward-backward asymmetry measurements[8] are shown in figure 9. The Standard Model indeed continues to describe fermion-pair production at LEP-2 energies.


3.2 Production and Decays of W Bosons
Most of the key physics goals of LEP-2 are based around the production of pairs of W bosons. Since the events contain two W’s, the topologies fall into three quite distinct categories, according to whether both, one or neither W decays hadronically. In approximately 46% of WW events both W’s decay to quarks, giving a typically four-jet final state, in a similar fraction (44%) one decays hadronically and one leptonically, giving two jets, a charged lepton and missing momentum from the neutrino, and finally 10% of WW events have two charged leptons with large acoplanarity arising from the two unobserved neutrinos.
The selection of WW events is by now well established in the four LEP experiments[9]: typical selection efficiencies and purities are 80-90%. The measured W-pair cross-section is shown in figure 10. With a total LEP-2 integrated luminosity of around 700 pb-1 per experiment, around 12000 WW events are observed by each.
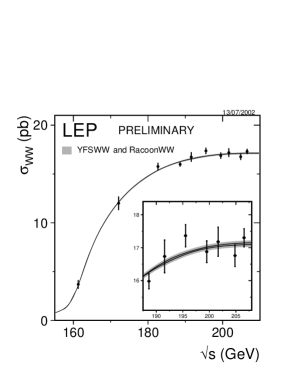

Recently, substantial theoretical progress has been made incorporating O() corrections into the predictions for W-pair production. This is illustrated in the inset of figure 10, where the measurements are compared with predictions of the YFSWW[10] and RacoonWW[11] Monte Carlo programs. These calculations, including the main O() effects, describe the data well, but lie approximately 2% below predictions without these corrections.
3.3 Gauge Structure of the Standard Model


Another important feature of W-pair production at LEP-2 is the substantial effect of diagrams containing vector-boson self-couplings, as shown in figure 11 along with the neutrino exchange diagram. The size of the contribution from these diagrams is shown in figure 10: with only neutrino exchange the cross-section would be much higher and would eventually violate unitarity at higher centre-of-mass energies.
Sensitivity to the properties of the triple vector boson vertices arises not only through the total WW cross-section, but also through the differential cross-section as a function of the scattering polar angle, and through the W polarisation as a function of angle. The polarisation can be probed using the W decays as helicity analysers. The analyses[12] of triple-gauge couplings at LEP-2 make use of all these properties to extract the most information about vertex coupling factors: conventionally the main parameters studied are known as , and . In the Standard Model these are respectively 1, 0 and 1. In extracting these parameters from the data the effects of O() corrections are significant, and so these are now included in the analyses. The current, preliminary, LEP averaged results
| (7) | |||||
| (8) | |||||
| (9) |
are consistent with these predictions, thus directly demonstrating the gauge structure of the Standard Model in the vector boson self-couplings.
3.4 Measurement of the W Mass
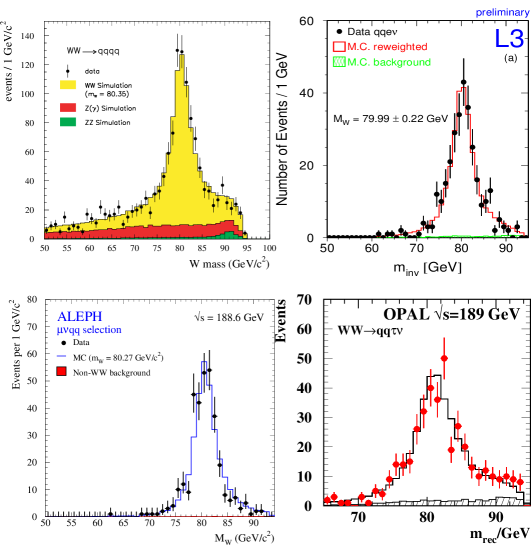
The copious production of W pair events at LEP-2 allows the measurement of the W mass. Experimentally this employs the reconstructed directions and energies of the primary W decay products, using jet directions and energies to approximate those of the primary quarks, measuring charged lepton momenta, and deducing neutrino momenta from the missing momentum in the event. Information comes primarily from events where at least one W decays hadronically – the double leptonic decays having too few observables to extract much information on . For the and events, a kinematic fit is made to improve the W mass resolution event by event: this fit imposes the constraints that the total energy and momentum of the W decay products equal that of the colliding beams, and (usually) that the two decaying W’s have the same mass. Whilst these constraints are not physically exact, due to initial-state radiation and the finite W width, these can be modelled accurately in Monte Carlo simulation and so corrected for. The corrections are normally included in the fitting procedure by comparing data directly with simulated Monte Carlo. Typical reconstructed mass distributions are shown in figure 12. The width of the distributions has a substantial contribution from the W width, and so fits may be made both for alone, and for and simultaneously.
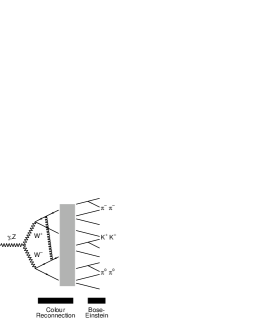
With the full LEP-2 statistics, systematic errors are significant compared to the statistical errors, especially in the channel, which is now systematics dominated. In the absence of systematic errors, the statistical precision of the and channels is similar: the effect of the large systematics in the channel is to deweight very substantially the contribution of this channel in the average. Much the most serious difficulty in the double hadronic decay channel arises from the fact that the two W’s decay with a separation much less than a typical hadron size. It is thus very possible that the two W decays interact with each other in the hadronisation process – the effect has been studied analytically in the perturbative phase and found to be small[13], but such a conclusion cannot be drawn for the non-perturbative region. Models are therefore necessary to consider such effects, and these are divided into two physical types, “colour-reconnection” and Bose-Einstein correlations, as indicated schematically in figure 13.
The effect of Bose-Einstein correlations between the hadronic decay products of different W’s has been studied[14] by the LEP experiments, which currently indicate that the effect on in the hadronic channel is quite small. Colour-reconnection (CR) models are also being studied in detail[15], but here the effects are found to be large, and hard to control. Since colour reconnection may be thought of as the exchange of (multiple) soft gluons, it is expected primarily to affect soft particle production. Substantial effort has been invested into understanding the relative effects of CR on the W mass measured by different experiments: the effects are found to be very similar, as might be expected. Several studies look at the distributions of soft particles between jets, where the effects of colour reconnection might be most visible: sensitivity is found to some models, such as the “SK-I” model implemented in JETSET[16], but not to others, such as the “AR-2” CR model implemented in Ariadne[17]. Overall, the effect of these studies has thus been to establish rather well the effect of the different models on , and to eliminate some of the most extreme cases, but the remaining systematic uncertainty on the W mass from the channel from this source is still estimated to be as much as 90 MeV[15].
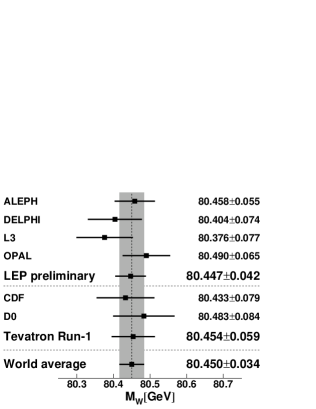
Including these and all other systematic errors, the W mass values obtained by the four LEP experiments[18], and their combination, is shown in figure 14. The weight of the channel in the LEP average is just 9%. The LEP results are compared to those from the Tevatron[19]: the individual measurements from the LEP experiments are of comparable precision to those from the Tevatron. Since the extraction methods are so different the LEP and Tevatron results are quite uncorrelated, so combining the measurements results in a substantial improvement, giving a world average W mass precision of 34 MeV.
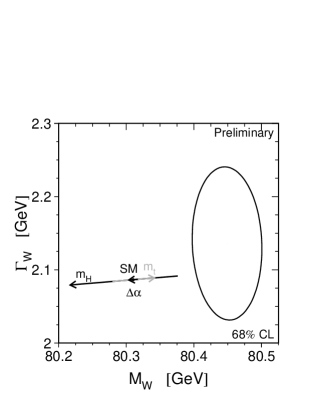
The LEP experiments’ results for the W width[18] give a preliminary value of GeV when combined, compared to a value of GeV obtained from the Tevatron measurements using the high- tail of the lepton momentum distribution[20]. The combined vs contours are shown in figure 15: the W width is in good agreement with the Standard Model expectation; the W mass is quite sensitive to the Higgs mass in the Standard Model framework, and favours a low Higgs mass.
4 Global Electroweak Tests
The various electroweak measurements discussed in the preceding sections can be combined to provide global tests of the description of the precise electroweak data by the Standard Model. In addition, results from NuTeV[21] and atomic parity violation[22] are included. The Standard Model predictions are provided by the ZFITTER[23] and TOPAZ0[24] electroweak libraries. Typically in the fit, parameters such as , , and are allowed to vary, but are strongly constrained by measurements at the Z lineshape (, ) or lower energies (). Of most interest are the parameters , and , all three of which may be predicted from fits to data excluding any direct measurements. In the case of the W and the top these may be compared with the direct measurements, and in the case of the predictions can be compared with current experimental search limits.
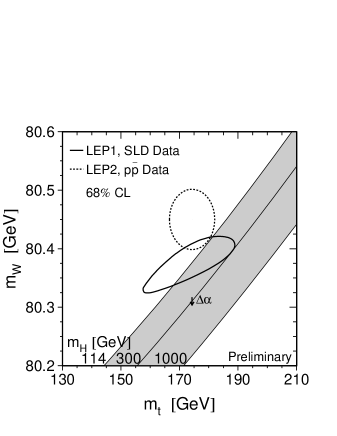
The results of a fit including all electroweak data except the direct W and top mass measurements is shown in figure 16, with results shown by the solid contour. The predictions are consistent with the direct measurements of these masses, shown by the dashed ellipse, demonstrating that the Standard Model fit can correctly predict the masses of heavy particles, in the case of top via radiative loop corrections. The ellipses are compared also with the Standard Model prediction of the relationship between and as a function of (diagonal bands): it is seen that both the precise lower energy data, and the direct measurements of the masses, favour a low Higgs mass in the Standard Model framework.
A full electroweak fit is made including all the precise electroweak data, as indicated in figure 17. The “pull” indicated is defined as the measured value of the observable minus the best fit value divided by the measurement error only.

The overall of the fit is 29.7 for 15 degrees of freedom, corresponding to a 1.3% fit probability. This rather high has the largest contribution from the new NuTeV measurement of in neutrino-nucleon scattering[21]. Without this measurement, the fit would be 11%. The next largest contribution comes from the b quark forward-backward asymmetry measurement, as noted earlier. It is worth noting that although the for the fit is increased substantially by inclusion of the new NuTeV result, the electroweak parameters, particularly , extracted from the fit are little affected by whether this result is included or not. It is therefore of interest to go on to see what the Standard Model fit says about .
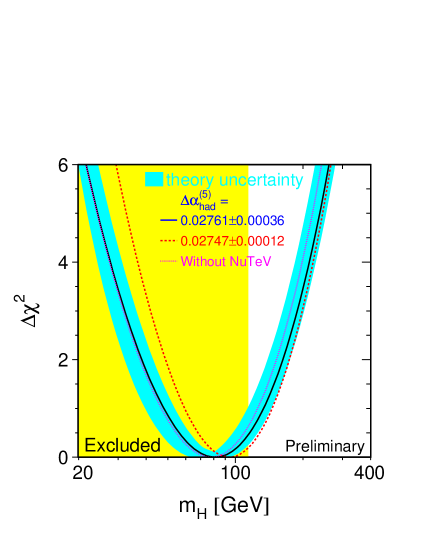
The of the full Standard Model electroweak fit to all results is shown in figure 18 as a function of the Higgs mass. The shaded band around the central curve shows the effect of higher-order theoretical uncertainties, evaluated by varying ZFITTER/TOPAZ0 options and including an estimate of the effect of a partial inclusion of two-loop corrections. The lighter shaded region to the left of the plot indicates the region experimentally excluded by direct searches, as discussed in the next section. The Higgs mass obtained from the fit is:
| (10) |
corresponding to GeV at 95% CL. This result includes preliminary results, and is valid only in the framework of the Standard Model.
5 The Search for the Higgs Boson of the Standard Model
Direct searches for production of Higgs bosons were carried out each time the centre-of-mass energy of LEP was raised. The final results[25] are dominated by the highest energy data, which are reviewed briefly. Since the couplings of the Higgs boson are completely fixed in the Standard Model for any given Higgs mass, , this is the only free parameter in these searches (this is relaxed if supersymmetric extensions to the Standard Model are considered, but these are beyond the scope of this paper). The main production process at LEP-2 energies would be the so-called “Higgs-strahlung” process, . For Higgs masses in the relevant range 80 120 GeV, the main decay mode would be H, so that the key experimental techniques are high performance b tagging, and an excellent mass resolution to separate any possible signal from the irreducible background from production.
It was therefore intriguing when ALEPH reported[26] an excess of three high-mass events in the channel in September 2000, just before the planned end of LEP data-taking. The three events were consistent in their kinematics with production and decay of a Higgs of mass 115 GeV, although the rate was rather higher than expected. A long, and at times heated, debate followed, as a result of which a brief one-month extension of the LEP run was granted.
Although the original events from ALEPH remain, the full analyses of the data of the other three experiments[25] show no excess of events that might confirm the hypothesis suggested by the ALEPH data, and no significant excess is observed in the final combined sample. Instead a lower limit[27] can be placed on the mass of a Standard Model Higgs boson of
| (11) |
slightly below the expected limit of 115.3 GeV.
6 Conclusions
A wealth of electroweak measurements have been collected by LEP and SLD in the last thirteen years, and only a brief overview of them could be given here. They are complemented in key places by measurements from the Tevatron.
To select just a few from the very large range of highlights, these data have:
-
•
shown there are three light neutrino species
-
•
demonstrated radiative loop corrections
-
•
predicted the top quark mass
-
•
verified Standard Model triple gauge couplings
-
•
put many strong constraints on physics beyond the SM
-
•
indicated where to look for the Standard Model Higgs – although direct observation was not possible
In total, therefore, LEP and SLD have provided a huge step forward for the Standard Model, but the final elucidation of the Higgs sector and the mechanism of electroweak symmetry breaking awaits future, higher energy, experiments.
Acknowledgments
Much credit for the LEP combined results and plots in this note goes to the LEP/SLD electroweak working group together with its various subgroups, in addition to the members of the five experiments. In particular I want to thank Martin Grünewald for his prompt preparation of combined results, and willingness always to explain. Thanks also to Arno Straessner for figure 13.
References
-
[1]
ALEPH Collaboration, R. Barate et al., Eur. Phys. J. C 14 1 (2000);
DELPHI Collaboration, P. Abreu et al., Eur. Phys. J. C 16 371 (2000);
L3 Collaboration, M. Acciarri et al., Eur. Phys. J. C16 1-40 (2000);
OPAL Collaboration, G. Abbiendi et al., Eur. Phys. J. C19 587 (2001). - [2] The LEP Collaborations ALEPH, DELPHI, L3 and OPAL and the LEP Electroweak working group, Combination procedure for the precise determination of Z boson parameters from results of the LEP experiments, CERN–EP-2000-153, hep-ex/0101027.
-
[3]
ALEPH Collaboration, R. Barate et al.,
Phys. Lett. B 401 150 (1997);
ALEPH Collaboration, R. Barate et al., Phys. Lett. B 401 163 (1997);
ALEPH Collaboration, R. Barate et al., Eur. Phys. J. C4 557 (1998);
ALEPH Collaboration, R. Barate et al., Eur. Phys. J. C16 597 (2000);
DELPHI Collaboration, P. Abreu et al., Eur. Phys. J. C10 415 (1999);
DELPHI Collaboration, P. Abreu et al., Eur. Phys. J. C12 209 (2000);
DELPHI Collaboration, P. Abreu et al., Eur. Phys. J. C12 225 (2000);
L3 Collaboration, M. Acciarri et al., Eur. Phys. J. C13 47 (2000);
OPAL Collaboration, G. Alexander et al., Z. Phys. C72 1 (1996);
OPAL Collaboration, K. Ackerstaff et al., Eur. Phys. J. C1 439 (1998);
OPAL Collaboration, G. Abbiendi et al., Eur. Phys. J. C8 217 (1999);
SLD Collaboration, K. Abe et al., Phys. Rev. Lett. 80 660 (1998);
SLD Collaboration, SLAC–PUB–7880, contributed paper to ICHEP98;
N. De Groot, “Electroweak results from SLD”, hep-ex/0105058;
V. Serbo, presented at Int. Europhys. Conf. High Energy Phys., July 2001, Budapest, Hungary. - [4] See, for example, D.G. Charlton, BHAM-HEP-95-01, invited talk at EPS-HEP95, Brussels, Belgium (1995).
- [5] SLD Collaboration, K. Abe et al., Phys. Rev. Lett. 84 5945 (2000).
- [6] SLD Collaboration, K. Abe et al., Phys. Rev. Lett. 86, 1162 (2001)
-
[7]
ALEPH Collaboration, A. Heister et al.,
Eur. Phys. J. C24 177 (2002);
ALEPH Collaboration, A. Heister et al., Eur. Phys. J. C 22 201 (2001);
ALEPH Collaboration, R. Barate et al., Phys. Lett. B434 415 (1998);
DELPHI Collaboration, P. Abreu et al., Z. Phys C65 569 (1995);
DELPHI Collaboration, DELPHI 2002-028-CONF-562 (2002);
DELPHI Collaboration, DELPHI 2002-029-CONF-563 (2002);
DELPHI Collaboration, P. Abreu et al., Eur. Phys. J. C9 367 (1999);
DELPHI Collaboration, P. Abreu et al., Eur. Phys. J. C10 219 (1999);
L3 Collaboration, O. Adriani et al., Phys. Lett. B292 454 (1992);
L3 Collaboration, L3 Note 1624 (1994);
L3 Collaboration, M. Acciarri et al., Phys. Lett. B448 152 (1999);
L3 Collaboration, M. Acciarri et al., Phys. Lett. B439 225 (1998);
OPAL Collaboration, G. Alexander et al., Z. Phys. C70 357 (1996);
OPAL Collaboration, R. Akers et al., OPAL Physics Note PN226 (1996);
OPAL Collaboration, R. Akers et al., OPAL Physics Note PN284 (1997);
OPAL Collaboration, K. Ackerstaff et al., Z. Phys. C75 385 (1997);
OPAL Collaboration, G. Alexander et al., Z. Phys. C73 379 (1996). - [8] LEP EW WG subgroup, C. Geweniger et al., Note LEP2FF/02-03 (2002), and references therein.
-
[9]
ALEPH Collaboration, R. Barate et al., Phys. Lett. B484 205 (2000);
DELPHI Collaboration, P. Abreu et al., Phys. Lett. J. B479 89 (2000);
L3 Collaboration, M. Acciarri et al., Phys. Lett. B496 19 (2000);
OPAL Collaboration, G. Abbiendi et al., Phys. Lett. B493 249 (2000). - [10] S. Jadach, W. Placzek, M. Skrzypek, B. F. Ward and Z. Was, Comput. Phys. Commun. 140 432 (2001).
-
[11]
A. Denner, S. Dittmaier, M. Roth and D. Wackeroth, Nucl. Phys.
B560 33 (1999);
A. Denner, S. Dittmaier, M. Roth and D. Wackeroth, Nucl. Phys. B587 67 (2000);
A. Denner, S. Dittmaier, M. Roth and D. Wackeroth, Phys. Lett. B475 127 (2000);
A. Denner, S. Dittmaier, M. Roth and D. Wackeroth, hep-ph/0101257. -
[12]
ALEPH Collaboration, ALEPH 2001-027 CONF 2001-021 (2001);
DELPHI Collaboration, DELPHI 2002-016-CONF-555 (2002);
L3 Collaboration, L3 Note 2734 (2002);
OPAL Collaboration, OPAL Physics Note PN501 (2002). - [13] T. Sjöstrand and V.A. Khoze, Z. Phys. C62 281 (1994).
-
[14]
ALEPH Collaboration, R. Barate et al., Phys. Lett. B478 50
(2000);
DELPHI Collaboration, DELPHI-2002-032-CONF-566 (2002);
L3 Collaboration, P. Achard et al., Phys. Lett. B 547 139 (2002). - [15] The LEP Collaborations ALEPH, DELPHI, L3 and OPAL and the LEP W Working Group, LEPEWWG/FSI/2002-01, and references therein.
- [16] T. Sjöstrand and V.A. Khoze, Z. Phys. C62 281 (1994); Phys. Rev. Lett. 72 28 (1994).
-
[17]
L. Lönnblad, Z. Phys. C70 107 (1996);
L. Lönnblad, Comput. Phys. Comm. 71 15 (1992). - [18] The LEP Collaborations ALEPH, DELPHI, L3 and OPAL and the LEP W Working Group, Note LEPEWWG/MASS/2002-02 (2002) and references therein.
-
[19]
CDF Collaboration, F. Abe et al., Phys. Rev. Lett. 65 2243 (1990);
CDF Collaboration, F. Abe et al., Phys. Rev. D43 2070 (1991);
CDF Collaboration, F. Abe et al., Phys. Rev. Lett. 75 11 (1995);
CDF Collaboration, F. Abe et al., Phys. Rev. D52 4784 (1995);
A. Gordon, presented at XXXIInd Rencontres de Moriond, Les Arcs, 16-22 March 1997;
DØ Collaboration, S. Abachi et al., Phys. Rev. Lett. 84 222 (2000). -
[20]
CDF Collaboration, T. Affolder et al., Phys. Rev. Lett. 85 3347
(2000);
DØ Collaboration, V.M. Abazov et al., Phys. Rev. D66 032008 (2002) - [21] NuTeV Collaboration, G. P. Zeller et al., Phys. Rev. Lett. 88 091802 (2002).
-
[22]
C.S. Wood et al.., Science 275 1759 (1997);
S.C. Bennett and C.E. Wieman, Phys. Rev. Lett. 82 2484 (1999). - [23] D. Bardin et al., Z. Phys. C44 493 (1989); Comp. Phys. Comm. 59 303 (1990); Nucl. Phys. B351 1 (1991); Phys. Lett. B255 290 (1991) and CERN-TH 6443/92 (1992); the most recent version of ZFITTER (6.21) is described in Comp. Phys. Comm. 133 229 (2001).
-
[24]
G. Montagna et al., Comput. Phys. Commun.
117 278 (1999);
http://www.to.infn.it/giampier/topaz0.html . -
[25]
ALEPH Collaboration, R. Barate et al.,
Phys. Lett. B 526 191 (2002);
DELPHI Collaboration, DELPHI-2002-041-CONF-575 (2002);
L3 Collaboration, M. Acciarri et al., Phys. Lett. B517 319 (2001);
OPAL Collaboration, G. Abbiendi et al., CERN-EP-2002-059 (2002). - [26] W.D. Schlatter for the ALEPH Collaboration, “ALEPH Status Report”, presented at the CERN LEPC, 5 September 2002.
- [27] ALEPH, DELPHI, L3 and OPAL Collaborations and the LEP Working Group for Higgs Boson Searches, LHWG Note/2002-01 (2002).