The Contribution of One-photon Annihilation at in Experiment ††thanks: Supported by National Natural Science Foundation of China (19991483) and 100 Talents Program of CAS (U-25).
Abstract The continuum one-photon annihilation at in
experiment is studied. Such contributions to the measured
final state and at mass
are estimated by phenomenological models. It is found that
these contributions must be taken into account in
the determination of branching ratios of
and , as
well as other electromagnetic decay modes.
The study reaches the conclusion that in order for BES to
obtain the correct branching ratios on these decay modes,
at least 10pb-1 of data below the peak is needed.
Key words observed cross section, resonance, one-photon annihilation, branching ratio, BES data taking
1 Introduction
The study and understanding of the decay dynamics of the charmonium states , and possibly , is one of the most important topics in Quantum Chromodynamics (QCD). There have been lots of activities in experimental part of this study in recent years since BES [1] has collected the world largest sample during 1993-1994 and 1995 running years at the peak. Among the studies, the reconfirmation of the vector-pseudoscalar (VP) decay puzzle (also called “ puzzle”) between and decays [2] first observed by MARK II [3] and the first observation of the decay suppressions in vector-tensor (VT) modes [4] compared to naive perturbative QCD predictions are of great interest. Since then, many theoretical efforts have been put to figure out the possible reasons why and decays to some final states, especially for VP and VT modes significantly deviate from “15 % rule”, while many other decay modes agree with the predictions [5].
To extend the experimental study to other decay modes of , to further explore the studied modes to higher sensitivity, and to match the huge sample BES has collected at the peak during 1999-2001 running years [6], BES has collected 14 M data during 2001-2002 running year [6]. This world largest sample makes it possible to measure the decays to electromagnetic decay level, so that one can reach the sensitivity of separating the QED and QCD amplitudes in decays.
As for the study of , as an attempt to solve the “ puzzle” in decays, it has been proposed that the suppression of the decays to some specific final states is due to the mixing between S- and D-wave charmonium states, or the is very close to threshold so that virtual process of cancels lots of decay amplitudes to those suppressed channels [7]. Furthermore, the study of the old data may indicate has a large fraction of decays into light hadrons besides modes, in contradiction to the picture that it decays to dominantly [8]. To confirm this, the best way is to measure the and total cross sections with high precision, so that the difference between the two gives the contribution of the non- decay rate, while the other possible way is to measure the exclusive non- decay modes.
Now we know that and decay into hadrons, besides those with charmonium in final particles, through two interactions: the one-photon electromagnetic interaction and three-gluon strong interaction. The amplitudes of them, in general, may have a relative phase. This is also true for decaying into light hadrons.
In colliding beam experiment, and are produced by annihilation, there is inevitable the process
| (1) |
produced simultaneously, which is indistinguishable from the hadron events from or decays. So in experiment, any final state may come from three processes: the charmonium three-gluon decays, the charmonium one-photon decays, and the virtual photon process without going through resonance (continuum process). The study of the charmonium decay dynamics is to determine the decay amplitudes of the three-gluon and the one-photon processes. In the case of the , the one-photon decays has a comparable cross section with respected to the continuum process. Moreover, for some strongly suppessed modes like VP and VT, the three-gluon process may also have a comparable cross section. In this case, one has to consider three amplitudes and the relative phases between any of the two amplitudes in the analysis of the experimental data. Fortunately, there are some decay modes of the charmonium where the strong decays are forbidden, only decays through one-photon annihilation is allowed, like , which violates the isospin, and , which violates the G-parity. In such situation, only two amplitudes and one relative phase are present, this substantially simplifies the study, and makes the determination of the one-photon decay amplitude possible, provided the amplitude of the continuum process being known.
The electromagnetic processes, such as and , are similar to the process in the way that there are two Feynman diagrams : the continuum one-photon diagram and the diagram. Taking final state as an example, two diagrams are shown in Fig. 1.


The observed experimental cross sections of these exclusive channels consist of three parts: the resonance, the continuum and their interference. However, unlike the channel which the continuum amplitude can be calculated by QED, such terms for and are to be determined by experiment, i.e., we need to measure the form factors of and .
It is important to notice that the measured cross sections at the narrow resonances are sensitive to the experimental conditions, but the three parts in the cross section depend on different aspects of the experimental details. The measured resonance cross section depends on the energy spread of the collider, but such finite energy spread does not affect the continuum term. On the other hand, the continuum term is sensitive to the invariant mass cut in event selection, while such cut hardly affects the observed resonance cross section under practical event selection criteria. These are to be discussed in detail in the following sections.
The study of the pure electromagnetic decays of the charmonium states will shed light on the understanding of the charmonium decay dynamics. Some theorists, like Suzuki [9], have tried to probe the interference pattern between one-photon electromagnetic process and three-gluon process of the charmonium decays in order to solve the “ puzzle”. For such analysis, the experimental information of those decays of pure electromagnetic processes, are of particular importance [10], since they supply an estimation of the electromagnetic part in the decay modes with strong interaction.
In this paper, we first study the experiment dependence of the cross sections, then give an estimation of the cross sections of the pure electromagnetic process without going through charmonium resonance based on the form factors, finally the minimum required integrated luminosity at off-peak energy point is estimated if meaningful results are expected for the decay modes interested.
2 Experimentally observed cross sections
2.1 Resonance
The cross section of the process (where denotes a certain kind of final state) is described by the Breit-Wigner formula
| (2) |
where is the center-of-mass energy, and are the widths of decaying into and , and are the total width and mass of . Taking the initial state radiative correction into consideration, the cross section becomes [11]
| (3) |
where , , is the experimentally required minimum invariant mass of the final state after losing energy due to multi-photon emission; has been calculated in many references [11, 12, 13] and is the vacuum polarization factor. The radiative correction in the final states are usually not considered [14, 15]. The reasons are twofold. In the first place, the hadronic final system is very complicated and since the radiative corrections depend upon the details of how the experiment is done, it is difficult to give a general, model-independent prescription for them. The second reason is that our understanding of the hadronic problem is so crude that there is no need to worry about the electromagnetic corrections. In any case, if we find later on that it is necessary to do radiative corrections to the hadronic states for some specific problem, we can do the calculation then, because the initial state radiative corrections and final state radiative corrections can be decoupled to a large extent.
The colliders have finite energy spread. The energy spread function is usually a Gaussian distribution :
| (4) |
where is the standard deviation of the Gaussian distribution. It varies with the beam energy of the collider. In case of BEPC/BES, MeV at the C.M. energy of the [16]. It is much wider than the intrinsic width of (300 25) keV [17]. So the experimentally measured resonance cross section is the radiatively corrected Breit-Wigner cross section folded with the energy spread function:
| (5) |
where is defined by Eq.(3).
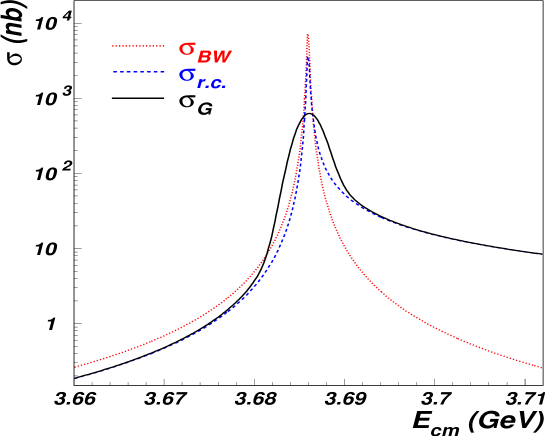
In Fig. 2, three cross sections are depicted: the Breit-Wigner cross section of Eq.(2); the cross section after radiative correction by Eq.(3), and the experimentally measured cross section by a collider with MeV. In the calculation of these cross sections, the following parameters of are used [17] : GeV; keV; keV ***Throughout this paper, we use this set of data and MeV for numerical calculations.. From the three curves in Fig. 2, we see that the radiative correction reduces the height of the resonance. It also shifts the peak position to above the nominal mass. The reduction factor and the shift of the peak are approximately expressed by [18]
| (6) | |||||
| (7) |
where is defined as
and
| (8) |
At the mass, and . So for , the reduction factor and the shift of the peak keV. The energy spread further lowers down and shifts the experimentally measured peak. In the case of a collider with MeV, the maximum height of the peak becomes 640 nb, and the position of the peak is shifted by 0.14MeV above the nominal mass.
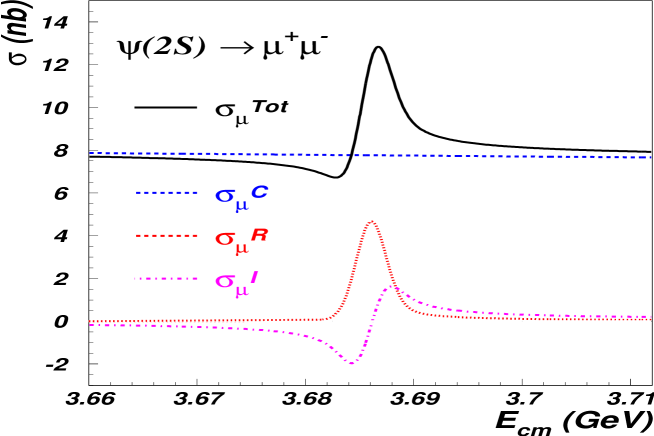

The channel deserves special discussion here, since it is parallel to those hadronic channels in decays which only go through electromagnetic interaction, such as and . Since this is an exclusive channel, there is interference between the continuum and the amplitudes. Such interference can be seen clearly from the scan of the , see Fig. 4. In Fig. 4, the cross sections of inclusive hadrons and pairs are depicted for comparison. Here in the calculation of radiative correction, the upper limit of integration in Eq.(3) is taken to be (), which means all allowed phase space for multi-photon emission is integrated. The peak of curve is shifted more than that of the inclusive hadrons, to 0.81 MeV above the nominal mass.
2.2 One-photon continuum
In the total experimentally measured cross section, the one-photon continuum term has different features from the resonance. For the channel, this term is expressed in the Born order as
| (9) |
After radiative correction, this term depends sensitively on the upper limit of the integration in Eq.(3). At the C.M. energy of the mass, the radiatively corrected cross section is 8.33 nb, when . This value means integrating all the allowed phase space of multi-photon emission. If , which means that the final has the minimum invariant mass of , after losing energy to multi-photon emission, then the radiatively corrected cross section is 6.25 nb. In the actual experimental situation, the invariant mass cut or its equivalence is usually imposed to remove the from decays. For the resonance term, as long as
| (10) |
it is insensitive to . Another important feature of the continuum term is that since it is a smooth function of , the finite energy spread of the collider does not change the measured value.
For the inclusive hadronic final states, the continuum term is expressed in the Born order as
| (11) |
where is the -value at C.M. energy . Since is a slowly varying function of energy, so qualitatively it shares the same feature of this term for final state. After radiative correction, it depends sensitively on the upper limit of the integration in Eq.(3), i.e., on the experimental cuts; but the finite energy spread of the collider hardly changes the measured value.
3 Cross sections of two exclusive electromagnetic processes
The general discussions in previous section is extended to exclusive processes. For illustrative purpose, we discuss two pure electromagnetic ones, which are similar to .
3.1 Resonance
In experiments, usually the branching ratio is measured by the events number of certain channel () divided by the total number of the resonance events():
| (12) |
where is the measured cross section of the specific channel and the total production cross section of . With the parameters and collider energy spread used in previous section, the total cross section of is 640 nb (=). The decay is reported a branching ratio of [19]; the other decay is reported a branching ratio of by DASP [20], but a later result by BES is [21]. If we check the original references, these numbers actually mean that the BES measured cross section of at mass is nb while for it is nb.
We notice that the observed cross section of these final states are 3 to 4 orders of magnitude smaller than the total inclusive hadron cross section of the continuum process which, according to Ref. [22], is about 15 nb. So it could be that a substantial part of the experimentally measured cross section comes from the continuum instead of the decay. Therefore it is essential to know the production rate of and due to the continuum process in order to get the correct branching ratios of decays to these modes.
3.2 One photon continuum
Here we give an estimation of the possible magnitudes of and by currently available phenomenological models. These two processes are calculated by their form factors
| (13) | |||||
| (14) |
where is the momentum of the final particles, and are the form factors for and respectively. Phenomenological model [10] gives
| (15) |
with
| (16) |
At GeV, it gives nb at Born order. It is almost unchanged by radiative correction if in Eq.(3)†††The radiatively corrected cross section is nb if and if ..
For , the vector dominance model (VDM) [23] gives :
| (17) |
At mass, it gives nb at Born order, which is almost unchanged after radiative correction if ‡‡‡The radiatively corrected cross section is nb if and nb if ..
From above estimations, we can see that possibly some of the observed and a large fraction of the observed events at peak may come from the continuum process instead of the decay. It should be noted that different models for the form factors give very different results at the mass region [23], here we only want to get a feeling about the magnitude of the continuum contribution.
For , the resonance cross section is only around 8 nb; whereas the hadron cross section from the continuum is about 13 nb. To determine its branching ratio of exclusive light hadrons, we must know the continuum cross section of these final states.
3.3 Energy dependence of measurement
From the foregoing discussion, we know that the behavior of two terms of the cross section is rather distinctive with the energy variation: the resonance changes manifestly but the continuum part almost imperceptibly. The relative proportion of two terms of the cross section, which plays an important role in determination of branching ratio, could be rather different at different energy.
In actual experiment, the beam energy could drift away from the position of the maximum inclusive hadron cross section during a considerable long time running, which in turn leads to considerable variation of resonance cross section. Taking final state as an example, if the energy drifts upwards or downwards from the peak position of the inclusive hadron by 0.5 MeV, the resonance cross section changes from 4.47 to 4.20 nb, or equivalently the variation is about 6%.
Furthermore, for the process whose continuum cross section is comparable with that of resonance, its interference cross section accounts for a considerable part in the total cross section, and varies violently in the vicinity of the peak position. Also for final state, its interference cross section changes from nb to or 0.66 nb respectively for the energy drifted by 0.5 MeV lower or higher than the hadron peak position.
Combining the variation of the resonance and the interference, the maximum change of the resonance cross section can reach 1.1 nb, or 25% for channel. In other words, if we use the result from final state as an approximation, 25% uncertainty should be taken into account in the branching ratio estimation for the 0.5 MeV energy drift***If the energy drift is about 0.2 MeV, the uncertainty is only 9% correspondingly..
4 Other decay modes
In previous sections, we have discussed the pure electromagnetic processes in decays. Most other decays which strong interaction plays the leading role also have continuum amplitude contribution if the is produced in collision. Although the amplitude maybe smaller, but for those suppressed channels, like VP and VT modes, the electromagnetic decays and the continuum contribution could play an important role. For example, now the upper limit of branching ratio has been pushed down to [2]. Under BES condition, this means that the upper limit of the cross section is nb. The coupling of this channel to virtual photon is one third of . Using the estimate of previous sections, its continuum cross section could be nb at . If we push down further the upper limit of this decay, we need to take into account the contribution from the continuum. This is also true for the upper limit of . Another VP decay mode, , has been measured to have a branching ratio of [24]. This means that BES measured cross section of this channel is nb at . Theoretically, the coupling of this channel to virtual photon is two thirds of , so the estimated continuum cross section by the form factors of Eq. (15) is nb. This has to be considered in high precision experiments of the coming generation accelerator and spectrometer, like CLEO-c and BES-III.
In order to know whether the observed suppression of VP and VT modes in decays are due to the absence of strong interaction amplitude, or the destructive interference between the electromagnetic and the strong amplitudes, or just an incidental destructive interference between these two and the continuum process in our particular experiment, we need to know their coupling to virtual photon.
5 Estimation of needed data taking at BES
As discussed in previous sections, in order to extract the branching ratios of to and from experimental data, we need the coupling of these channels to a virtual photon. This can only be done by the direct measurement of their production cross sections nearby but off resonance. The same is true for decaying into light hadrons. To satisfy the need of both and physics, the best energy to take the data should be below peak, for example, at GeV. Here two factors should be considered: one is the data-taking point should not be too faraway from the peak position, so that the cross section of the continuum process is almost equal to that at the peak position; another factor is the data-taking point could not be too close to the peak position, so that the resonance cross section is small enough to be neglected. Taking the inclusive hadron final state as an example, at GeV, the cross section variation of the continuum process
| (18) |
At the same time, the ratio of the resonance cross section to that of the continuum process
| (19) |
That is to say, at GeV, the variation of the continuum process cross section and the proportion of the resonance cross section are both fairly small.
Another reason to take the data below peak is that and are too close to find a suitable data-taking point between them. On one hand, is a wide resonance, the resonance effect can extend far beyond the peak position. On the other hand, the effect from the radiative tail of can reach the vicinity of the peak. For example, at one below peak, the resonance cross section is nb, which is mostly ; the radiative tail of is more than 3 nb; while the cross section for continuum process is about nb. That is to say, the radiative tail of is too large to be neglected.
Finally, we discuss quantitatively how much data are needed.
-
•
The typical electromagnetic process, like , is measured to have a branching ratio of , since the cross section by BEPC/BES at peak is 640 nb, that means the cross section is nb. So for every pb-1, we obtain 20 produced events.
If we use the form factor in Eq.(13) to estimate the cross section, at 3.67GeV it is nb with in radiative correction. If so, for every pb-1, we obtain 3.8 produced events.
-
•
Another pure electromagnetic process is measured to have a branching ratio of , corresponding cross section is about nb. For every pb-1, we obtain 5 produced events.
If we use the form factor in Eq.(14) to estimate the cross section, at 3.67GeV it is nb with in radiative correction. If so, for every pb-1, we obtain 3.3 produced events.
-
•
is one of the most interesting processes. Each of the three final states, , , gets contribution as from pure one-photon process. So for every pb-1, we expect 6.7 produced events (which is one of the three final states). For continuum process, for every pb-1, we obtain 1.3 produced events.
From the above estimates, the integrated luminosity of the off resonance data sample need to be the same order of magnitude as on resonance.
According to the experience of BES data taking, the typical integrated luminosity at mass is about 8 nb-1 per RUN; average 25 RUNs can be taken every day, or equivalently 0.2 pb-1 per day. As an estimation, using these experiment data and form factors, the time needed for events numbers taken at the continuum of different processes can be worked out and are given in Table 1.
| Events number | 1 | 4 | 10 | 25 | 50 | |
|---|---|---|---|---|---|---|
| data taking | 1.3 | 5.3 | 13 | 33 | 66 | |
| duration | 1.5 | 6.1 | 15 | 38 | 76 | |
| (day) | 3.8 | 15.4 | 38 | 96 | 192 | |
In order to obtain reliable signal, and taking both statistical error and data collection time into consideration, we recommend that at least 10 pb-1 data at off peak to be taken. From the above estimates, it gets the statistic to match the new sample about 20 pb-1 of taken by BES-II. It will serve the purpose to take into account the contribution from one-photon continuum in data analysis.
6 Summary
In this paper, we discussed extensively the properties of the observed cross section at resonance in experiment. We studied the resonance and the electromagnetic processes. We also pointed out the possible uncertainty due to actual measurement circumstance. The electromagnetic final states of and are from two processes: one is decay and the other the continuum contribution. Using form factors, we found the continuum contribution is equivalent to the previously reported cross sections of the resonance decay. This indicates that the actual branching ratios of these electromagnetic decays might be different from the present reported values.
In order to obtain the correct results of and decay, we suggest that at least 10 pb-1 data be taken at the continuum region ( GeV).
References
-
[1]
BES collab., Nucl. Instr. Meth. A458 (2001) 627-637;
BES collab., Nucl. Instr. Meth. A344 (1994) 319-334;
BES collab., HEP & NP 16 (1992) 769-789 (in Chinese). - [2] Li J, “Experimental progress on charmonium and light hadron spectroscopy”, at XVIIth international Symposium on “Lepton-Photon Interactions”, Beijing, China, 10-15,August,1995.
- [3] M. E. B. Franklin et al., Phys. Rev. Lett. 51 (1983) 963.
- [4] BES Collab., Phys. Rev. Lett. 83 (1999) 1918-1921.
-
[5]
Wei-Shu Hou and A.Soni, Phys. Rev. Lett. 50
(1983) 569;
S.J.Brodsky and M.Karliner, Phys. Rev. Lett. 18 (1997) 4682;
M.Chaichian and N.A.Törnqvist, Nucl. Phys. B323 (1989) 75;
S.S.Pinsky, Phys. Lett. B236 (1990) 479;
G.Karl and W.Roberts, Phys. Lett. B144 (1984) 243;
X.-Q. Li, D.V.Bugg, and B.-S. Zou, Phys. Rev. D 55, (1997) 1421;
J.-M.Gérard and J.Weyers, Phys. Lett. B462 (1999) 324;
T.Feldmann and P.Kroll, Phys. Rev. D 62, (2000) 074006. - [6] F. A. Harris, “Recent and Results from BES”, report at ICHEP2002, Amsterdam, Holland, July 24-31, 2002.
-
[7]
J.Rosner, Phys. Rev. D60 (1999) 074029;
Yu-Qi Chen and Eric Braaten, Phys. Rev. Lett. 80 (1998) 5060-5063. -
[8]
Baltrusaitis R. M.et al., Phys. Rev. Lett. 56
2140(1986) ;
Adler J. et al., Phys. Rev. Lett. 60 89 (1988);
CLEO-c Collaboration, “CLEO-c and CESR-c: A New Frontier of Weak and Strong Interactions”, CLNS 01/1742. - [9] M.Suzuki Phys.Rev. D63 (2001) 054021.
- [10] V. Chernyak, talk given at the International Workshop “ collision from to ”, March 1999, Novosibirsk.
- [11] E. A. Kuraev and V. S. Fadin, Sov.J. Nucl. Phys. 41(1985)466-472.
-
[12]
G. Altarelli and G. Martinelli, CERN 86-02 (1986) 47;
O. Nicrosini and L. Trentadue, Phys. Lett. B196(1987)551. - [13] F. A. Berends, G. Burgers and W. L. Neerven, Nucl. Phys. B297 (1988) 429; Nucl. Phys. B304 (1988) 921.
- [14] Y. S. Tsai, SLAC-PUB-3129(1983).
- [15] F. A. Berends and R. Gastmans, “Electromagnetic interactions of hadrons”, Volume 2, edited by A. Donnachine and G. Shaw, Plenum Press, New York, 1978.
-
[16]
BES collab., HEP & NP 19 (1995) 673-685 (in Chinese);
BES collab., Phys. Rev. D53 (1996) 20-34. - [17] Particle Data Group, K.Hagiwara et al., Phys. Rev. D66 (2002) 010001.
- [18] F. A. Berends, “Z Line Shape”, CERN 89-08 (1989), edited by G. Altarelli, R. Kliess and C. Verzegnassi.
- [19] F. A. Fred, “Recent Charmonium Results from BES”, report at DPF’99, Unversity of California, Los Angeles, Jun. 5-19, 1999.
- [20] R. Brandelik et al., Z. Phys. C1 (1979) 233 .
- [21] Ye Shuwei, Dr. Thesis (in Chinese), “Measurement and study of several decay channels of of VP or PP mode” (1997.1).
- [22] X. H. Mo, Y. S. Zhu and P. Wang, “Measurement of resonance parameters” (The third version, 2002,5)
- [23] N. N. Achasov and A. A.Kozhevnikov, talk given at the International Workshop “ collision from to ”, March 1999, Novosibirsk, hep-ph/9904326.
- [24] Gu Yifan, “Experimental Study on Charmonium Physics at Beijing Electro-Positron Collider” in “China Basic Science(2002.2)” (in Chinese), page 7-17.