Mixing in the - system at BABAR
Abstract
We report a preliminary result for - mixing and the doubly Cabibbo suppressed decay rate based on an analysis of decays from 57.1 of data collected at or just below the resonance with the BABAR detector at the PEP-II collider. We set 95% confidence limits for the mixing parameters and and find that our result is compatible with no mixing and no violation. In the limit of no mixing we find the doubly Cabibbo suppressed decay rate and the violating asymmetry .
SLAC-PUB-9552
BABAR-PROC-02/114
October, 2002
Stanford Linear Accelerator Center, Stanford University, Stanford, CA 94309
Work supported in part by Department of Energy contract DE-AC03-76SF00515.
1 Motivation
Mixing can be characterised by the two parameters and , where () is the difference in mass (width) between the two different mass eigenstates and is the average width.
Within the Standard Model the level of - mixing and violation is predicted to be below the sensitivity of current experiments[1]. For this reason it is a good place to look for signals of physics beyond the Standard Model. Other experiments[2, 3] have already tried this with smaller datasets using a technique similar to what is described here. In any attempt to measure mixing one should consider the possibility of violation also as, with new physics, there is no a priori expectation that it is insignificant.
Mixing and violation can be detected by observation of the wrong-sign decay (charge conjugation is implied unless otherwise stated). Production through direct decay is doubly Cabibbo suppressed (DCS) but it is also possible for the to oscillate into a and subsequently decay through the right-sign Cabibbo favoured (CF) decay . The two processes can only be distinguished by an analysis of the time evolution of the decay.
Assuming , and that is conserved, the time-dependent decay rate for the wrong-sign decay from DCS decays and mixing is
| (1) |
where is the lifetime and is the ratio of DCS to CF decays111 and where is an unknown strong phase.. Because only appears in the time distribution as a squared value, it is not possible to determine the sign of in an analysis based on the decay alone.
violation can be either direct, in mixing or in the interference between the two. The violation gives rise to different apparent values for the parameters in eq. 1 so we define , and for mesons produced as a ().
2 The BABAR detector and data selection
For this analysis, we use of data collected with the the BABAR detector which is described in detail elsewhere[4]. Reconstruction of charged particles and particle identification of Kaons and pions are the most essential. Tracking is provided by a five-layer silicon vertex tracker (SVT) and a forty-layer drift chamber (DCH), both in a 1.5 T solenoidal magnetic field. A Cherenkov ring imaging detector (DIRC) is placed outside the tracking volume.
Kaons (pions) are identified by calculating a likelihood product of the information from measurements in the SVT and DCH and the reconstructed Cherenkov angle and photon statistics from the DIRC, with an efficiency above 75% (80%) and mis-id rate below 8% (7%) for .
We select candidates from reconstructed decays. The charge of the pion in the decay identifies the flavour of the and also serves to create a clean sample of decays. Both right-sign and wrong-sign candidates are selected. We select only candidates with in the centre-of-mass frame to reject candidates from decays. Other event selection criteria are employed to ensure that we have high quality tracks and do not have any candidates with multiple overlapping tracks.
3 Results
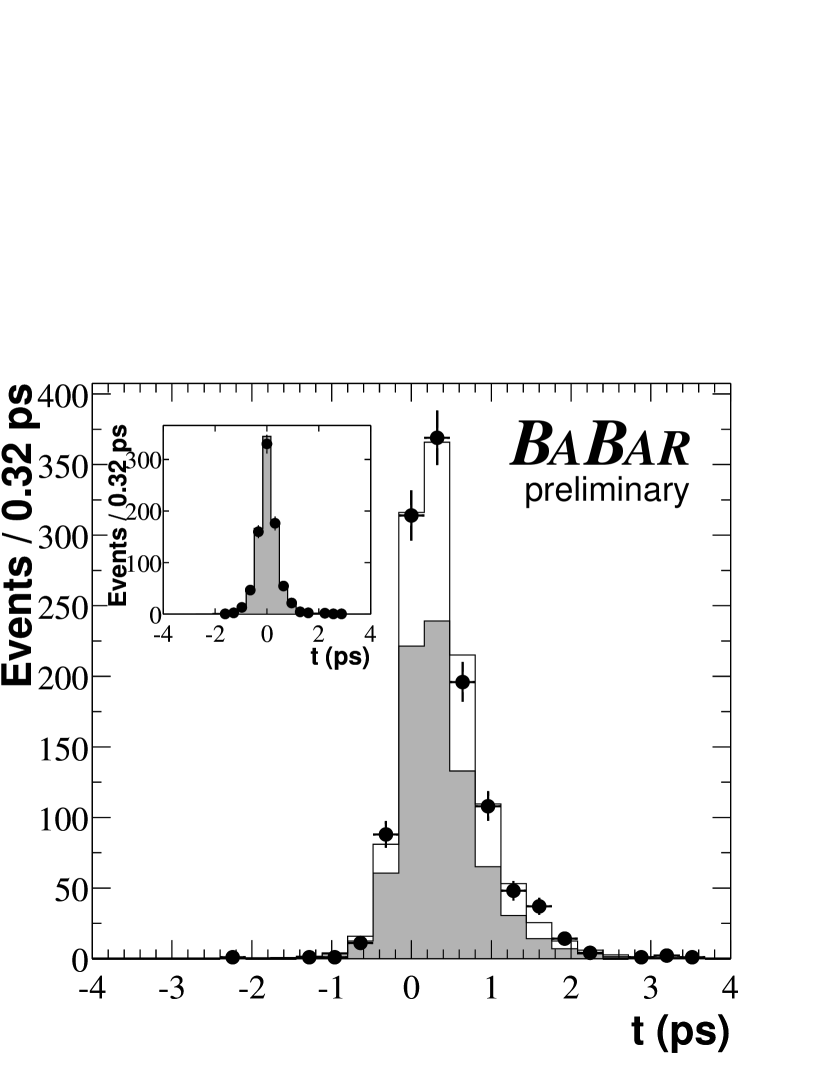
An unbinned maximum likelihood fit is used to extract the mixing parameters. For each candidate we use the candidate mass , the mass difference between the and the candidate and the proper lifetime and error on the lifetime of the candidate. The lifetime and the signal resolution model is determined from the large right-sign sample. Sidebands are included in and such that the level and time evolution of the different background types can be evaluated. In figure 2 we show the time evolution of the wrong-sign sample. In total we observe around 120,000 (440) right-sign (wrong-sign) signal events.
Since the fit allows to take unphysical negative values an error estimate from the log-likelihood surface (LLS) would require a Bayesian analysis where the choice of prior is not clear. In addition, an accurate error estimate from the LLS requires a LLS shape that is independent of the outcome of the fit. At the current level of statistics these requirements are not even approximately met, especially for the small mixing values observed.
Instead we use a method where we define a 95% confidence limit contour in and space using toy Monte Carlo experiments222With a toy Monte Carlo experiment we mean a Monte Carlo sample of the same size as the data generated from the PDF of the fit.. Contours are constructed such that there is a 95% probability for any point on the contour that the likelihood ratio
| (2) |
will be greater than the corresponding value calculated for the data. is here the maximum likelihood obtained from the fit to either data or a toy Monte Carlo sample. The probability is evaluated by creating multiple toy Monte Carlo samples at the point and for each of the samples evaluate after a fit.
As well as for the general case allowing for violation we also calculate our results for the special cases where is conserved and where no mixing is allowed. In the case where we assume no mixing we calculate the direct violation term .
| Fitted Central Value | ||||
| Fit type | Parameter | free | fixed at 0 | 95% C.L. interval |
| [%] | ||||
| [%] | ||||
| violation | ||||
| allowed | ||||
| [%] | ||||
| [%] | ||||
| No | [%] | |||
| violation | ||||
| [%] | ||||
| No mixing | ||||
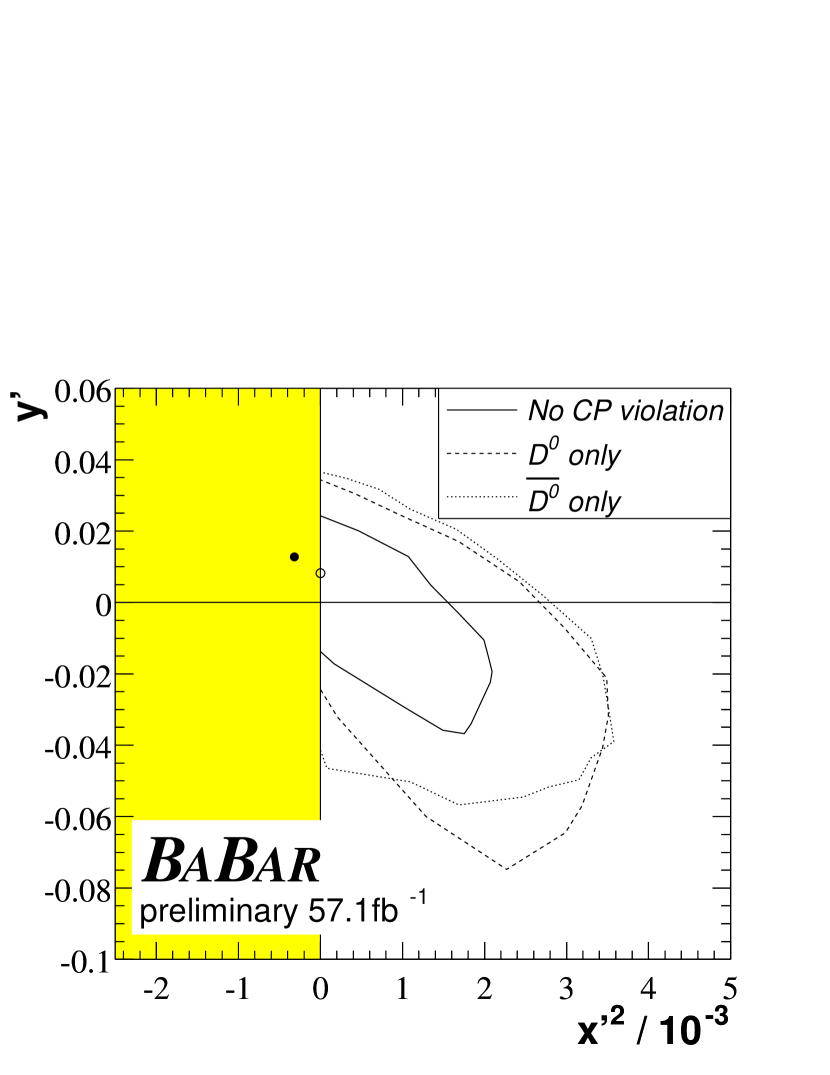
The confidence contours for the mixing results including systematic errors are shown in figure 2 and the overall results are summarised in table 1.
For our systematic errors we evaluate the contributions from uncertainties in the parametrisation of the PDF’s, detector effects, and effects of our selection criteria. For detector effects like alignment errors or charge asymmetry we measure their effect on the right-sign control sample. For variations in the event selection we assign for this preliminary result the full variations in the resulting contours as systematic errors.
In summary we have set new and improved limits on mixing and violation for neutral mesons. Our results are compatible with no mixing and no violation, all of which fits well with the predictions from the Standard Model given our current sensitivity.
References
- 1 . A. A. Petrov, hep-ph/0209049 (2002).
- 2 . E791, E. M. Aitala et al., Phys. Rev. D57, 13 (1998), hep-ex/9608018.
- 3 . CLEO, R. Godang et al., Phys. Rev. Lett. 84, 5038 (2000), hep-ex/0001060.
- 4 . BABAR, B. Aubert et al., Nucl. Instrum. Meth. A479, 1 (2002), hep-ex/0105044.