\docnumCERN–EP/2002-074 {Authlist}
NA48 collaboration
A. Lai, D. Marras
Dipartimento di Fisica dell’Università e Sezione dell’INFN di Cagliari, I-09100 Cagliari, Italy
J.R. Batley, R.S. Dosanjh, T.J. Gershon, G.E. Kalmus, C. Lazzeroni, D.J. Munday, E. Olaiya, M.A. Parker, T.O. White, S.A. Wotton
Cavendish Laboratory, University of Cambridge, Cambridge, CB3 0HE, U.K.111 Funded by the U.K. Particle Physics and Astronomy Research Council
R. Arcidiacono222 On leave from Dipartimento di Fisica Sperimentale dell’Università e Sezione dell’INFN di Torino, I-10125 Torino, Italy, G. Barr, G. Bocquet, A. Ceccucci, T. Cuhadar-Dönszelmann, D. Cundy333Present address: Instituto di Cosmogeofisica del CNR di Torino, I-10133 Torino, Italy, N. Doble, V. Falaleev, L. Gatignon, A. Gonidec, B. Gorini, P. Grafström, W. Kubischta, A. Lacourt, I. Mikulec444 On leave from Österreichische Akademie der Wissenschaften, Institut für Hochenergiephysik, A-1050 Wien, Austria, A. Norton, B. Panzer-Steindel, G. Tatishvili555 On leave from Joint Institute for Nuclear Research, Dubna,141980, Russian Federation, H. Wahl
CERN, CH-1211 Genève 23, Switzerland
C. Cheshkov, P. Hristov, V. Kekelidze, D. Madigojine, N. Molokanova, Yu. Potrebenikov, A. Zinchenko
Joint Institute for Nuclear Research, Dubna, Russian Federation
V. Martin, P. Rubin, R. Sacco, A. Walker
Department of Physics and Astronomy, University of Edinburgh, JCMB King’s Buildings, Mayfield Road, Edinburgh, EH9 3JZ, U.K.
M. Contalbrigo, P. Dalpiaz, J. Duclos, P.L. Frabetti, A. Gianoli, M. Martini, F. Petrucci, M. Savrié
Dipartimento di Fisica dell’Università e Sezione dell’INFN di Ferrara, I-44100 Ferrara, Italy
A. Bizzeti666 Dipartimento di Fisica dell’Universita’ di Modena e Reggio Emilia, via G. Campi 213/A I-41100, Modena, Italy, M. Calvetti, G. Collazuol, G. Graziani, E. Iacopini, M. Lenti, F. Martelli, M. Veltri
Dipartimento di Fisica dell’Università e Sezione dell’INFN di Firenze, I-50125 Firenze, Italy
M. Eppard, A. Hirstius, K. Holtz, K. Kleinknecht, U. Koch, L. Köpke, P. Lopes da Silva, P. Marouelli, I. Mestvirishvili, I. Pellmann, A. Peters, S.A. Schmidt, V. Schönharting, Y. Schué, R. Wanke, A. Winhart, M. Wittgen
Institut für Physik, Universität Mainz, D-55099 Mainz, Germany777 Funded by the German Federal Minister for Research and Technology (BMBF) under contract 7MZ18P(4)-TP2
J.C. Chollet, L. Fayard, L. Iconomidou-Fayard, G. Unal, I. Wingerter-Seez
Laboratoire de l’Accélérateur Linéaire, IN2P3-CNRS,Université de Paris-Sud, 91898 Orsay, France888 Funded by Institut National de Physique des Particules et de Physique Nucléaire (IN2P3), France
G. Anzivino, P. Cenci, E. Imbergamo, P. Lubrano, A. Mestvirishvili, A. Nappi, M. Pepe, M. Piccini
Dipartimento di Fisica dell’Università e Sezione dell’INFN di Perugia, I-06100 Perugia, Italy
R. Casali, C. Cerri, M. Cirilli999Present address: Dipartimento di Fisica dell’Universitá di Roma “La Sapienza” e Sezione dell’INFN di Roma, 00185 Roma, Italy, F. Costantini, R. Fantechi, L. Fiorini, S. Giudici, I. Mannelli, G. Pierazzini, M. Sozzi
Dipartimento di Fisica, Scuola Normale Superiore e Sezione dell’INFN di Pisa, I-56100 Pisa, Italy
J.B. Cheze, M. De Beer, P. Debu, F. Derue, A. Formica, R. Granier de Cassagnac, G. Gouge, G. Marel, E. Mazzucato, B. Peyaud, R. Turlay, B. Vallage
DSM/DAPNIA - CEA Saclay, F-91191 Gif-sur-Yvette, France
M. Holder, A. Maier, M. Ziolkowski
Fachbereich Physik, Universität Siegen, D-57068 Siegen, Germany101010 Funded by the German Federal Minister for Research and Technology (BMBF) under contract 056SI74
C. Biino, N. Cartiglia, F. Marchetto, E. Menichetti, N. Pastrone
Dipartimento di Fisica Sperimentale dell’Università e Sezione dell’INFN di Torino, I-10125 Torino, Italy
J. Nassalski, E. Rondio, M. Szleper, W. Wislicki, S. Wronka
Soltan Institute for Nuclear Studies, Laboratory for High Energy Physics, PL-00-681 Warsaw, Poland111111Supported by the Committee for Scientific Research grants 5P03B10120, SPUB-M/CERN/P03/DZ210/2000 and SPB/CERN/P03/DZ146/2002
H. Dibon, M. Jeitler, M. Markytan, G. Neuhofer, M. Pernicka, A. Taurok, L. Widhalm
Österreichische Akademie der Wissenschaften, Institut für Hochenergiephysik, A-1050 Wien, Austria121212 Funded by the Austrian Ministry for Traffic and Research under the contract GZ 616.360/2-IV GZ 616.363/2-VIII, and by the Fonds für Wissenschaft und Forschung FWF Nr. P08929-PHY
The decay rate has been measured with the NA48 detector using a high intensity short neutral beam from the CERN SPS. The measured branching ratio , obtained from 7461172 events, is significantly higher than the prediction of Chiral Perturbation Theory. Using a beam the ratio has been measured.
Precise measurements of the and decay rates
1 Introduction
The decays and are important probes of Chiral Perturbation Theory (), an effective field theory of the Standard Model at low energies. The decay amplitude of can be calculated unambiguously at the leading order of the perturbative expansion giving a branching ratio of with an uncertainty of only a few per cent [1]111These results are similar to those obtained in earlier calculations based on a phenomenological approach [2]. The theoretical predictions for are much less accurate [3]. The decay rate has hitherto been considered as an example of good agreement between the prediction and the experimental measurement , obtained by the NA31 experiment [4]. This result was recently improved by NA48 to [5] with data from a two-day test run with high intensity short neutral beam, collected in September 1999. However, the previous experimental results are not precise enough to resolve the higher order effects which are predicted by the to be at most of the order of of the decay amplitude [1]. Using data taken in a 40 day run with the high intensity short neutral beam in the year 2000, for the first time an accuracy of a few % has been achieved. A comparison of the experimental result with the prediction allows the estimation of the loop contributions. According to , these could also contribute to effects in the decay which up to now are believed to be dominated by vector meson exchange.
2 Principle of the measurement
The NA48 experiment has been designed to measure direct CP violation in neutral kaon decays and comprises and beams created at two targets, near and far from the decay region, which can be run together or separately [6].
In previous measurements of , the decay region used contained almost twice as many decays coming from . Their subtraction using the flux estimated from e.g. decays introduces an uncertainty of more than 4% due to the poorly known branching ratio. In the measurement presented here, this problem is overcome by using a novel method based on the observed ratio of to , as a function of energy and decay position, in the beam (far-target) run performed immediately prior to the beam (near-target) data taking. As the near- and far-target beams are almost collinear and have similar momentum spectra, the measurement of decays in the near-target beam, as a function of energy and decay position, and the ratio measured from the far-target beam allow the direct evaluation of the number of decays in the near-target beam. By using the same ranges of energy and decay position only a very small acceptance correction is needed due to the slight differences in geometries of the two beams. A by-product of this method is a precise measurement of .
3 Experimental set-up and data taking
The near-target beam contains mesons and hyperons. It was produced on a 2 mm diameter, 400 mm long beryllium target by 400 GeV protons at a production angle of 3.0 mrad in the vertical plane. In this special high intensity near-target mode, the primary proton beam was attenuated and collimated to the desired intensity, far upstream of the target. The target is followed by a sweeping magnet packed with tungsten-alloy inserts in which protons not interacting in the target are absorbed, and by a 0.36 cm diameter collimator. In the usual NA48 experimental configuration the 1.5 m long collimator is followed successively by an anti counter (AKS), by an 89 m long evacuated tube terminated by a thin Kevlar window and by a helium filled tank which contains the drift chambers and a spectrometer magnet. However for these data the AKS counter, the Kevlar window and the drift chambers were removed and the helium tank was evacuated.
The present analysis is based on data recorded during a 40-day run in 2000 with a beam intensity of about protons hitting the target during the 3.2 s long SPS spill. This is a factor of higher than the usual near-target beam. This near-target run was preceded by a 30-day run with the far-target beam alone and the same detector configuration222with exception of the proton beam energy which was 450 GeV, production angle which was 4.2 mrad and of the spectrometer magnet which, unlike in the near-target run, was powered in order to create occupancy conditions as close as possible to those of the direct CP-violation measurement., devoted mainly to studies of systematic effects in the direct CP-violation measurement [7, 8].
The detector elements used in the analysis are the following:
-
•
A liquid krypton calorimeter (LKr) [9] is used to measure the energy, position and time of electro-magnetic showers initiated by photons (). Around 20 t of liquid krypton at 121 K are used as an ionization detector. The calorimeter has a structure of 13212 square towers of cm2 cross-section and 127 cm length (27 radiation lengths) each. The cells are formed by copper-beryllium ribbons, 1.8 cm wide and 40 m thick, stretched longitudinally. The ionization signal from each of the cells is amplified, shaped, and digitised by 10-bit FADCs at 40 MHz sampling frequency. The dynamic range of the digitisers is increased by gain-switching amplifiers which change the amplification factor depending on the pulse height. The energy resolution is
where E is in GeV. The read-out system was calibrated by a charge pulse every burst during data taking. The final calibration of the energy scale is fixed by fitting the effective edge of the collimator seen in the data to be the same as in the Monte Carlo. The relative calibrations of the individual cells were determined by using decays during the 1998 run and checked to be similar in the 2000 run with decays produced in thin targets in a special -beam run. The position and time resolutions for a single photon with energy larger than 20 GeV are better than 1.3 mm and 300 ps, respectively.
-
•
A sampling hadron calorimeter composed of 48 steel plates, each 24 mm thick, interleaved with scintillator planes is used to measure hadronic showers with a readout in horizontal and vertical projections.
-
•
A scintillator hodoscope upstream of the two calorimeters helps to detect charged particles. It is composed of two planes segmented in horizontal and vertical strips arranged in four quadrants.
A more complete description of the apparatus can be found elsewhere [8].
The trigger decision, common to , and decays, is based on quantities which are derived from the projections of the energy deposited in the electro-magnetic liquid krypton calorimeter [10]. The trigger required that the total deposited energy is larger than 50 GeV, the radius of the centre of energy is smaller than 15 cm and the proper life time of the kaon is less than 9 lifetimes downstream of the collimator. The trigger efficiency, %, is measured using a minimum-bias sample triggered by a scintillating fibre hodoscope placed in the liquid krypton calorimeter and is equal for , and decays in both the near- and far-target runs.
4 Event selection
The energies and positions of electro-magnetic showers initiated by photons, measured in the liquid krypton calorimeter, are used to calculate the kaon energy and decay vertex. To select candidates, all events with energy clusters are considered. Pairs of clusters which are in time within 5 ns and with no other cluster with energy GeV closer in time than 3 ns with respect to the event time are selected. The event time is computed from the times of the two most energetic cells of the selected clusters. In addition, the pair must pass the following cuts:
-
•
The energy of each cluster must be greater than 3 GeV and less than 100 GeV.
-
•
The transverse distance between two clusters is required to be greater than 10 cm.
-
•
The total energy of the selected cluster pair is required to be less than 170 GeV and to be greater than 70 GeV.
-
•
The radius of the centre of energy,
(1) is required to be less than 7 cm, where , , are the cluster energy, and coordinates at LKr, respectively.
-
•
The energy deposited in the hadron calorimeter must not exceed 3 GeV in a time window of ns around the event time.
In order to determine the and fluxes in the beam, the decays and have been used. Similar conditions as for cluster pairs are applied to groups of 4 or 6 in-time clusters for and respectively.
The decay vertex position of a kaon decaying into photons or ’s is calculated using the kaon mass constraint
| (2) |
where is the coordinate of the LKr calorimeter with respect to the end of the collimator.
In and samples a cut of 27 () is applied to the invariant masses of photon pairs calculated using . For decay, the variable is defined as
| (3) |
where are the resolutions on measured from the data and parametrised as a function of the lowest photon energy. For decays an equivalent variable is defined in the space of three invariant masses.
Due to the large background from decays the study of can only be carried out in a restricted decay region. The maximum mass from a decay where two photons escape detection is 458 MeV/c2 which would lead to an apparent vertex shift of 9 m downstream. However, in case some showers overlap and only one or no photon misses the detector this shift can be significantly smaller. Therefore the decay region is defined to be between -1 m and 5 m with respect to the exit of the collimator.
In order to remove events with hadronic or overlapping showers from the sample, the shower width is required to be less than 3 above the average value for photon showers of a given energy. This cut, which is calibrated from showers in decays, removes of good events.
In the near-target data, 19819 events passed the selection cuts while in the far-target data more than events were used. Normalisation channels were down-scaled, retaining several hundred thousand events for analysis.
5 Background subtraction
The and samples are essentially background free. In the samples the following backgrounds have been identified and subtracted:
-
•
A small hadronic background visible as a tail in the shower width distribution. In the near-target sample this background originates from interactions of the beam particles in the collimator. In the far-target beam, which is cleaned by three collimators, the background from this source is negligible. However, pairs of charged hadrons generated in the far-target beam upstream of or inside the final collimator and opened vertically by the last sweeping magnet have been found to contribute to the sample.
-
•
Accidental pairs visible as a flat continuum in the distribution of the shower time differences.
-
•
Residual decays with one shower overlap and one low-energy photon missing the calorimeter.
-
•
Dalitz decay with an overlapping pair or one shower with energy below the detection limit of 1.5 GeV. In the far-target run, due to the presence of magnetic field, pairs do not overlap.
The last three background sources contribute significantly only to the near-target sample.
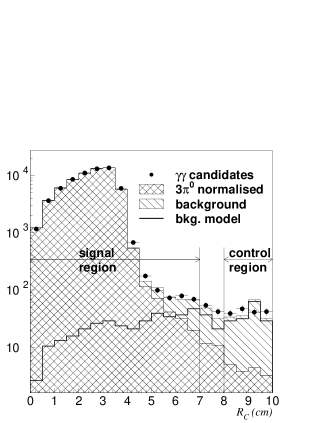
The hadronic and accidental backgrounds are subtracted using the distribution in radius of the centre of energy (), which indicates the deviation of the direction of the apparent decay source from the beam axis. A control region is defined with between 8 cm and 10 cm. In order to obtain the background-extrapolation factor to the signal region, cm, a set of model distributions has been extracted from the data by modifying certain selection requirements.
In the near-target data, in order to study the hadronic background component two different samples have been selected. In one, a hit in the hadron calorimeter is required and the shower width cut is released (extrapolation factor 1.5). In the other sample, as collimator scattering can produce more than two particles, an additional shower in the calorimeter is required and the decay region is shortened by 1 m in order to avoid contamination from decays, while all other cuts are unchanged (extrapolation factor 3.1) (Fig. 1 left). The model of accidental background is obtained by requiring the two showers to be out of time by more than 5 ns and less than 10 ns (extrapolation factor 2.7). The median value of the extrapolation factors from three different models gives an inclusive hadronic and accidental background estimate of % of the sample where the uncertainty corresponds to the spread of the extrapolation factors (Fig. 1 right).
In the far-target data the background model sample is obtained by requiring a hit in the hadron calorimeter and a hit in the scintillator hodoscope giving an extrapolation factor of 2.3. Using this factor and a conservative uncertainty leads to a background estimate of % (Fig. 2). In both background estimates the amount of beam halo in the control region is taken into account and is estimated from and samples.


In order to subtract the background a sample of decays was generated by Monte Carlo. The Monte Carlo sample was normalised using fully reconstructed events and checked by comparing it to the data in the 10 m following the decay region where background largely dominates the sample (Fig. 3). The estimated background amounts to % of the sample and populates mainly the last metre of the decay region. The uncertainty reflects a discrepancy between data and Monte Carlo in the simulation of overlapping showers.
The contribution of decays to the sample was estimated using Monte Carlo to be 0.4%. In the same way, the numbers of accepted (0.9%) and (1.1%) decays with a subsequent decay with respect to pure photon final states were estimated. The overall correction to the due to accepted Dalitz decays amounts to %, where the uncertainty is due to the simulation of overlapping showers.


6 Results
Binned maximum likelihood fits have been used to measure the ratio and the branching ratio in 10 kaon energy and 6 longitudinal vertex position bins. Acceptances were calculated using Monte Carlo with detector simulation based on GEANT [11] where the LKr calorimeter response was simulated using a pregenerated shower library.
The ratio of and decay rates, calculated from far-target samples and corrected for acceptance and for hadronic background as described in the previous section, is
| (4) |
where the systematic uncertainty accounts for the uncertainties in the background subtraction and simulation of the calorimeter response in the acceptance calculation. The latter were checked by varying selection cuts, especially the shower-width cut in the sample and the cut in the sample, which are specific to each of these decay channels. In addition it was checked that the result is insensitive to various parameters, e.g. longitudinal vertex position and kaon energy.
The number of events in the near-target sample is given by
| (5) |
where are the background corrected numbers of events from the near and far-target runs. is a double ratio of acceptances
| (6) |
which is close to unity (1.05) because the same decay region was used for the far and near-target samples. For this reason only the background subtraction uncertainty in (4) enters the calculation of BR(), while the acceptance calculation uncertainty cancels between near and far-target samples.
The summary of all corrections and uncertainties in the BR() calculation is given in Table 1. The acceptance uncertainty reflects the level of knowledge of non-Gaussian tails in the energy reconstruction accounted for in the acceptance calculation.
| Hadronic background and accidentals | -2.1 0.7 % |
|---|---|
| Background from | -2.1 0.4 % |
| Had. background in far-target beam | 0.9 0.4 % |
| Dalitz decay correction | 1.5 0.3 % |
| Acceptance uncertainty systematic | 0.3 % |
| Acceptance uncertainty statistical | 0.6 % |
| Trigger efficiency | 0.1 % |
| Total | -1.8 1.2 % |
| Statistical uncertainty data | 2.0 % |
| BR() | 0.9 % |
From 19819 candidates, have been estimated to be decays, giving a ratio of decay rates
| (7) |
Using BR() taken from [12] one obtains
| (8) | |||||
| (9) |
where the external uncertainty is that quoted in Table 1 for the branching ratio. Systematic checks have confirmed that the result is stable with respect to longitudinal vertex position, kaon energy, run period and other parameters.
This result is in agreement with previous measurements, but has much better precision. It is the first measurement of to show significant difference with respect to the calculations of and indicates that higher order corrections increase the decay rate by about 30%.
ACKNOWLEDGEMENT
It is a pleasure to thank the technical staff of the participating laboratories, universities and affiliated computing centres for their efforts in the construction of the NA48 apparatus, in the operation of the experiment, and in the processing of data. We would also like to thank G. D’Ambrosio for useful discussions concerning and for clarifying the precision of the theoretical prediction for the decay.
References
-
[1]
G. D’Ambrosio and D. Espriu, Phys. Lett. B 175 (1986) 237.
J.L. Goity, Z. Phys. C 34 (1987) 341.
F. Buccella, G. D’Ambrosio and M. Miragliuolo, Il Nuovo Cimento A 104 (1991) 777.
J. Kambor and B.R. Holstein, Phys. Rev. D 49 (1994) 2346. - [2] Z.E.S. Uy, Phys. Rev. D 3 (1971), p. 234, and references therein.
-
[3]
E. Ma and A. Pramudita, Phys. Rev. D 24 (1984) 2476.
J.F. Donoghue, B.R. Holstein and Y-C.R. Lin, Nucl. Phys. B 277 (1986) 651. - [4] G.D. Barr et al., Phys. Lett. B 351 (1995) 579.
- [5] A. Lai et al., Phys. Lett. B 493 (2000) 29.
- [6] N. Doble et al., Nucl. Instr. Meth. B 119 (1996) 181.
- [7] A. Lai et al., Phys. Lett. B 533 (2002) 196.
- [8] A. Lai et al., Eur. Phys. J. C 22 (2001) 231.
- [9] G. Unal for NA48 collaboration, 9th International Conference on Calorimetry, October 2000, Annecy, France, hep-ex/0012011.
- [10] G. Barr et al., Nucl. Instr. Meth. A 485 (2002) 676.
- [11] GEANT Description and Simulation Tool, CERN Program Library Long Write-up W5013 (1994).
- [12] Part. Data Group, Eur. Phys. J. C 15 (2000), 512.