Search for Lepton Flavor-Violating Decay
Abstract
We search for the lepton flavor-violating decay using 29.7 million pairs accumulated by the Belle experiment. The main background sources are found to be pairs with decay and radiative events. One event is observed in the signal region, while background events are expected. A preliminary upper limit at the 90% confidence limit is obtained.
1 Introduction
Charged lepton flavor-violating decays, such as , , and , are forbidden in the Standard Model (or highly suppressed even if we consider neutrino mixing). However, new physics beyond the Standard Model allows lepton flavor violation (LFV) decays. In supersymmetric models, left-right symmetric models and others [1], the branching ratio of the decay, Br(), is predicted to be times higher than Br() because of the large mass. Also, some SUSY models predict Br O(), which can be reachable by B-factory experiments of high luminosity.
The current upper limit of Br() is (90%CL), measured by the CLEO experiment [2]. Our first analysis with 10 fb-1 of data resulted in a slightly better upper limit of (90%CL) [3]. Also, the BaBar group recently reported an upper limit of (90%CL) using 56 million pairs at the ICHEP2002 conference [4].
Data is accumulated with the Belle detector [5] at the KEKB accelerator [6]. KEKB is an asymmetric collider with a center-of-mass energy of 10.58 GeV. Its current peak luminosity is and the total integrated luminosity amounts to 89.6 fb-1 as of summer, 2002. Here we present an analysis using 32.6 fb-1 of data, corresponding to 29.7 million pairs.
2 Event selection


In order to determine the selection criteria, a Monte Carlo (MC) simulation is performed using the KORALB generator [7] for -pair samples and a QQ generator [8] for other physics processes, as noted below. GEANT [9] is used for the full detector simulation. We prepare two kinds of pair samples: signal and -pair background, and several kinds of background samples: , , continuum, Bhabha, and two-photon processes of , , , and . In the signal MC samples, one decays to and the other decays generically. The angular distribution of two-body decay is assumed to be uniform in the ’s rest frame.
A candidate event is required to be
which we hereafter denote as “” events.
We therefore select events with “2 charged-tracks and 1 ”
with the expected accompanying missing momentum.
Below, kinematical variables are defined in the laboratory frame,
while those defined in the center-of-mass frame of the system are indicated
with an index “CM”.
Two oppositely charged particles are required to have a transverse momentum
of GeV/ and a momentum of GeV/
to reject Bhabha and background events.
For the signal, a muon track is required to satisfy
and GeV/, and
to have a -probability of more than 0.90
from the KL/muon detector (KLM).
The signal photon is selected by requiring
and GeV.
The charged particle on the tag side is required to not be a muon
within .
In order to remove the background from radiative , two-photon
and other non- processes, we apply the following criteria.
The opening angle between the two charged particles be greater than ,
and for the missing particle, GeV/ and
.
To remove the -pair background, we demand the opening angle between the and of the signal candidate to be and the opening angle between the charged particle in tag side and the missing momentum to be . The distributions for these variables are shown in Fig. 1. A further selection is applied for the missing momentum () and the missing mass squared () as and , as shown in Fig. 2. With these selections, the signal efficiency is evaluated to be 12.8% by MC and the remaining rate of background is for -pairs and for the radiative .
The signal region on the - plane is determined using the signal MC while assuming a uniform background distribution around the signal peak, where is the invariant mass of the - system and is the energy difference between the - system and the beam energy in the CM frame. Although we used a box shape to define the signal region in previous analysis, we now employ an elliptic shape in order to enhance the sensitivity, because the signal distribution has a tail due to the initial-state radiation and photon energy leakage from the CsI photon detector. Fig. 3 shows an ellipse with the highest signal-to-background ratio for a total detection efficiency of 9.0%.

With all selections, 69 events remain within the regions called “Area”, defined to be GeV/ and GeV. One event is observed in the signal region, as plotted in Fig. 3.
3 Background estimate
It is not straightforward to use a sideband to estimate the background in the signal region, since it largely depends on the sideband allocation for small samples, especially in the case of a structural distribution.
The backgrounds from pairs distribute in the region, as shown in Fig. 4, and could possibly contaminate the signal region. While a negligibly small portion of pairs is found at , the data extend to . Our study finds these to be radiative events, one in which muon is not identified due to the KLM inefficiency. Fig. 4(b) shows the events that passed the same selection criteria as the signal, with the tagged track required to be a muon. We call these “” events. The muon identification inefficiency is estimated to be about 8%.


The background rate is therefore calculated using
| (1) |
where is the number of “” events estimated by MC. The background is mostly -pair background and a small portion of the continuum. is the number of “” events extracted from data. The last term is included to avoid double counting. The resultant background rates of the individual contributions in Eq.(1) are listed in Table 1.
| Observed | ||||||
| events | pair | continuum | data | pair | ||
| Area | 69 | 34.3 | 5 | 24.4 | 1.2 | 62.53.5 |
Only 5 continuum events (8% in the Area) remain in “” samples for 32.6 fb-1 luminosity in the Area, but outside of the signal region. The contribution of the fourth term is not significant. It is only 1.9% in the Area.
A comparison between the number of the observed events and the expected backgrounds is given in Fig. 5. The center box is the signal region used in the previous analysis. We find a good agreement between them. We observe 69 events with an expected background of events.

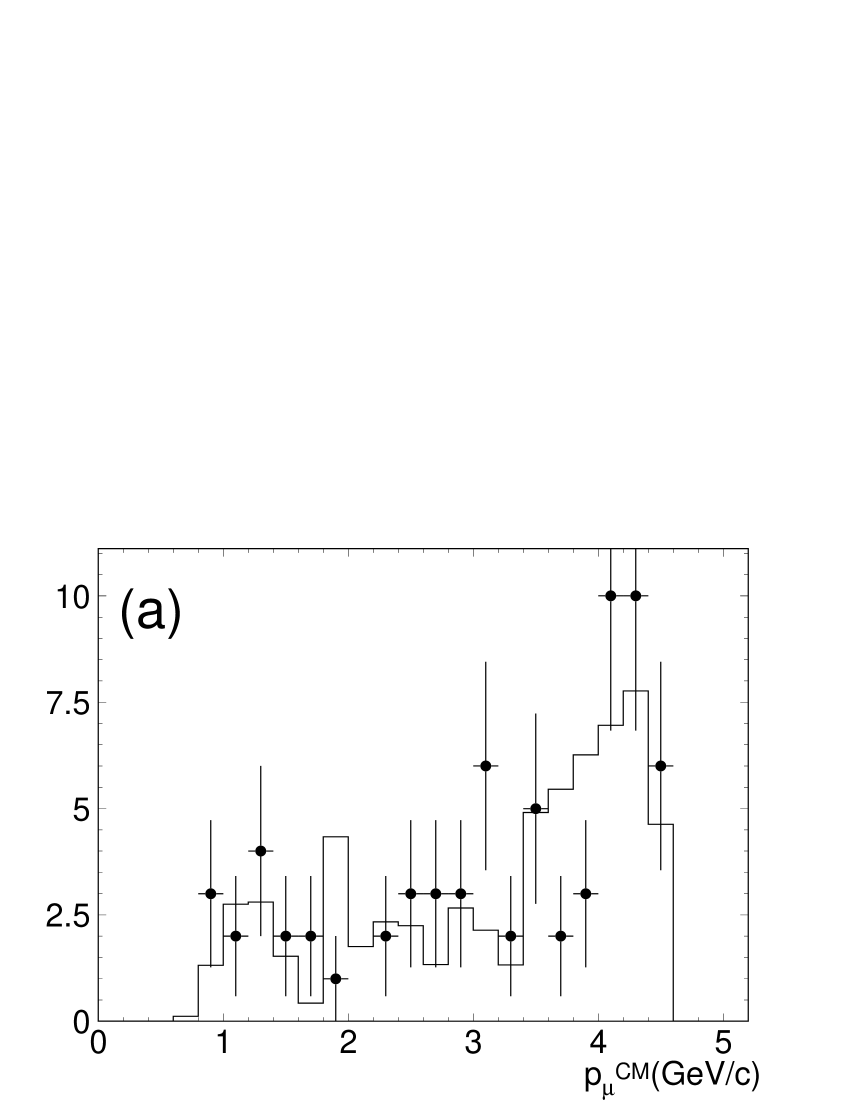
Comparisons of the and distributions between data (dots) and the expected background (open histogram) are also shown in Fig. 6. While a uniform distribution is seen for , a two-bump structure is found in the distribution. The two bumps corresponds to pair backgrounds and radiative processes.


Fig. 7 shows the and distributions of the signal candidate for the same samples of Fig. 6. Both bumps in the high- and the low- regions are due to the remaining radiative samples.

4 Result
In the signal region, we find one event, as shown in Fig. 3. The number of background events is evaluated to be . The upper limit is obtained using the Bayesian approach (following refs [2], [10] and [11]) with the equation
| (2) |
where is the upper limit on the signal at 90% confidence, is the number of expected background events and is the number of observed events. We obtain .
The systematic uncertainties of the detection efficiency are listed in Table 2. The conservative and preliminary evaluation gives a 6.7% error in total.
| uncertainty (%) | |
|---|---|
| track rec. eff. | 2.0 |
| photon rec. eff. | 5.0 |
| cut selection | 2.2 |
| luminosity | 1.4 |
| muon identification | 2.3 |
| MC statistics | 0.8 |
| trigger efficiency | 1.6 |
| total | 6.7 |
Finally, we obtain a preliminary result for the upper limit of Br() using 29.7 million pairs with 9.0% detection efficiency, as
References
- [1] R. Kitano and Y. Okada, Phys. Rev. D63 (2001) 113003; S.F. King, Phys. Rev. D60 (1999) 035003; J. Hisano and D. Nomura, Phys. Rev. D59 (1999) 116005; K.S. Babu, B. Dutta, and R.N. Mohapatra, Phys. Lett. B458 (1999) 93; J. Hisano, T. Moroi, K. Tobe, M. Yamaguchi, and T. Yanagida, Phys. Lett. B357 (1997) 579; S. Gentile and M. Pohl, Phys. Report 274 (1996) 287.
- [2] K.W. Edwards et al. (CLEO Collaboration), Phys. Rev. D55, (1997) 3919; S. Ahmed et al., Phys. Rev. D61 (2000) 071101.
- [3] Search for decay at Belle, Proc. of Int. Europhy. Conf. on HEP, July 12-18, 2001, Budapest, Hungary.
- [4] Search for at BaBar, Proc. of XXXI Int. Conf. on HEP, July 24-31, 2002, Amsterdam, the Netherlands.
- [5] A. Abashian et al. (Belle Collaboration), Nucl. Instr. and Meth. A 479 (2002) 117.
- [6] E. Kikutani ed., KEK Preprint 2001-157 (2001), to appear in Nucl. Instr. and Meth. A.
- [7] J. Jadach and Z. Was, Comp. Phys. Commun. 85 (1995) 453.
-
[8]
’QQ - The CLEO Event Generator’ (http://
www.lns.cornell.edu/public/CLEO/soft/QQ). - [9] R. Brun et al., GEANT 3.21, CERN Report No. DD/EE/84-1 (1987).
- [10] O. Helene, Nucl. Instr. and Meth. 212 (1983) 319.
- [11] Particle Data Group, R.M. Barnett et al., Phys. Rev. D54, 1 (1996), p. 159.