EUROPEAN ORGANIZATION FOR NUCLEAR RESEARCH
CERN-EP/2002-052
July 15th, 2002
Measurement of Neutral-Current Four-Fermion Production at LEP2
The OPAL Collaboration
Abstract
Four-fermion final states and from neutral-current interactions in collisions are studied in the OPAL detector at LEP at centre-of-mass energies from 183 GeV to 209 GeV. The data analysed correspond to a total integrated luminosity of about 650 recorded from 1997 to 2000. Corresponding to the acceptance of the OPAL detector, a signal definition is applied requiring both leptons to have a scattering angle satisfying . Further requirements are made on the invariant masses of the fermion pairs. The extracted cross-sections for the processes and are consistent with the expectations from the Standard Model.
The OPAL Collaboration
G. Abbiendi2, C. Ainsley5, P.F. Åkesson3, G. Alexander22, J. Allison16, P. Amaral9, G. Anagnostou1, K.J. Anderson9, S. Arcelli2, S. Asai23, D. Axen27, G. Azuelos18,a, I. Bailey26, E. Barberio8, R.J. Barlow16, R.J. Batley5, P. Bechtle25, T. Behnke25, K.W. Bell20, P.J. Bell1, G. Bella22, A. Bellerive6, G. Benelli4, S. Bethke32, O. Biebel31, I.J. Bloodworth1, O. Boeriu10, P. Bock11, D. Bonacorsi2, M. Boutemeur31, S. Braibant8, L. Brigliadori2, R.M. Brown20, K. Buesser25, H.J. Burckhart8, S. Campana4, R.K. Carnegie6, B. Caron28, A.A. Carter13, J.R. Carter5, C.Y. Chang17, D.G. Charlton1,b, A. Csilling8,g, M. Cuffiani2, S. Dado21, G.M. Dallavalle2, S. Dallison16, A. De Roeck8, E.A. De Wolf8, K. Desch25, B. Dienes30, M. Donkers6, J. Dubbert31, E. Duchovni24, G. Duckeck31, I.P. Duerdoth16, E. Elfgren18, E. Etzion22, F. Fabbri2, L. Feld10, P. Ferrari8, F. Fiedler31, I. Fleck10, M. Ford5, A. Frey8, A. Fürtjes8, P. Gagnon12, J.W. Gary4, G. Gaycken25, C. Geich-Gimbel3, G. Giacomelli2, P. Giacomelli2, M. Giunta4, J. Goldberg21, E. Gross24, J. Grunhaus22, M. Gruwé8, P.O. Günther3, A. Gupta9, C. Hajdu29, M. Hamann25, G.G. Hanson4, K. Harder25, A. Harel21, M. Harin-Dirac4, M. Hauschild8, J. Hauschildt25, C.M. Hawkes1, R. Hawkings8, R.J. Hemingway6, C. Hensel25, G. Herten10, R.D. Heuer25, J.C. Hill5, K. Hoffman9, R.J. Homer1, D. Horváth29,c, R. Howard27, P. Hüntemeyer25, P. Igo-Kemenes11, K. Ishii23, H. Jeremie18, P. Jovanovic1, T.R. Junk6, N. Kanaya26, J. Kanzaki23, G. Karapetian18, D. Karlen6, V. Kartvelishvili16, K. Kawagoe23, T. Kawamoto23, R.K. Keeler26, R.G. Kellogg17, B.W. Kennedy20, D.H. Kim19, K. Klein11, A. Klier24, S. Kluth32, T. Kobayashi23, M. Kobel3, S. Komamiya23, L. Kormos26, R.V. Kowalewski26, T. Krämer25, T. Kress4, P. Krieger6,l, J. von Krogh11, D. Krop12, K. Kruger8, M. Kupper24, G.D. Lafferty16, H. Landsman21, D. Lanske14, J.G. Layter4, A. Leins31, D. Lellouch24, J. Letts12, L. Levinson24, J. Lillich10, S.L. Lloyd13, F.K. Loebinger16, J. Lu27, J. Ludwig10, A. Macpherson28,i, W. Mader3, S. Marcellini2, T.E. Marchant16, A.J. Martin13, J.P. Martin18, G. Masetti2, T. Mashimo23, P. Mättigm, W.J. McDonald28, J. McKenna27, T.J. McMahon1, R.A. McPherson26, F. Meijers8, P. Mendez-Lorenzo31, W. Menges25, F.S. Merritt9, H. Mes6,a, A. Michelini2, S. Mihara23, G. Mikenberg24, D.J. Miller15, S. Moed21, W. Mohr10, T. Mori23, A. Mutter10, K. Nagai13, I. Nakamura23, H.A. Neal33, R. Nisius32, S.W. O’Neale1, A. Oh8, A. Okpara11, M.J. Oreglia9, S. Orito23, C. Pahl32, G. Pásztor4,g, J.R. Pater16, G.N. Patrick20, J.E. Pilcher9, J. Pinfold28, D.E. Plane8, B. Poli2, J. Polok8, O. Pooth14, M. Przybycień8,n, A. Quadt3, K. Rabbertz8, C. Rembser8, P. Renkel24, H. Rick4, J.M. Roney26, S. Rosati3, Y. Rozen21, K. Runge10, K. Sachs6, T. Saeki23, O. Sahr31, E.K.G. Sarkisyan8,j, A.D. Schaile31, O. Schaile31, P. Scharff-Hansen8, J. Schieck32, T. Schörner-Sadenius8, M. Schröder8, M. Schumacher3, C. Schwick8, W.G. Scott20, R. Seuster14,f, T.G. Shears8,h, B.C. Shen4, C.H. Shepherd-Themistocleous5, P. Sherwood15, G. Siroli2, A. Skuja17, A.M. Smith8, R. Sobie26, S. Söldner-Rembold10,d, S. Spagnolo20, F. Spano9, A. Stahl3, K. Stephens16, D. Strom19, R. Ströhmer31, S. Tarem21, M. Tasevsky8, R.J. Taylor15, R. Teuscher9, M.A. Thomson5, E. Torrence19, D. Toya23, P. Tran4, T. Trefzger31, A. Tricoli2, I. Trigger8, Z. Trócsányi30,e, E. Tsur22, M.F. Turner-Watson1, I. Ueda23, B. Ujvári30,e, B. Vachon26, C.F. Vollmer31, P. Vannerem10, M. Verzocchi17, H. Voss8, J. Vossebeld8,h, D. Waller6, C.P. Ward5, D.R. Ward5, P.M. Watkins1, A.T. Watson1, N.K. Watson1, P.S. Wells8, T. Wengler8, N. Wermes3, D. Wetterling11 G.W. Wilson16,k, J.A. Wilson1, G. Wolf24, T.R. Wyatt16, S. Yamashita23, D. Zer-Zion4, L. Zivkovic24
1School of Physics and Astronomy, University of Birmingham,
Birmingham B15 2TT, UK
2Dipartimento di Fisica dell’ Università di Bologna and INFN,
I-40126 Bologna, Italy
3Physikalisches Institut, Universität Bonn,
D-53115 Bonn, Germany
4Department of Physics, University of California,
Riverside CA 92521, USA
5Cavendish Laboratory, Cambridge CB3 0HE, UK
6Ottawa-Carleton Institute for Physics,
Department of Physics, Carleton University,
Ottawa, Ontario K1S 5B6, Canada
8CERN, European Organisation for Nuclear Research,
CH-1211 Geneva 23, Switzerland
9Enrico Fermi Institute and Department of Physics,
University of Chicago, Chicago IL 60637, USA
10Fakultät für Physik, Albert-Ludwigs-Universität
Freiburg, D-79104 Freiburg, Germany
11Physikalisches Institut, Universität
Heidelberg, D-69120 Heidelberg, Germany
12Indiana University, Department of Physics,
Swain Hall West 117, Bloomington IN 47405, USA
13Queen Mary and Westfield College, University of London,
London E1 4NS, UK
14Technische Hochschule Aachen, III Physikalisches Institut,
Sommerfeldstrasse 26-28, D-52056 Aachen, Germany
15University College London, London WC1E 6BT, UK
16Department of Physics, Schuster Laboratory, The University,
Manchester M13 9PL, UK
17Department of Physics, University of Maryland,
College Park, MD 20742, USA
18Laboratoire de Physique Nucléaire, Université de Montréal,
Montréal, Quebec H3C 3J7, Canada
19University of Oregon, Department of Physics, Eugene
OR 97403, USA
20CLRC Rutherford Appleton Laboratory, Chilton,
Didcot, Oxfordshire OX11 0QX, UK
21Department of Physics, Technion-Israel Institute of
Technology, Haifa 32000, Israel
22Department of Physics and Astronomy, Tel Aviv University,
Tel Aviv 69978, Israel
23International Centre for Elementary Particle Physics and
Department of Physics, University of Tokyo, Tokyo 113-0033, and
Kobe University, Kobe 657-8501, Japan
24Particle Physics Department, Weizmann Institute of Science,
Rehovot 76100, Israel
25Universität Hamburg/DESY, Institut für Experimentalphysik,
Notkestrasse 85, D-22607 Hamburg, Germany
26University of Victoria, Department of Physics, P O Box 3055,
Victoria BC V8W 3P6, Canada
27University of British Columbia, Department of Physics,
Vancouver BC V6T 1Z1, Canada
28University of Alberta, Department of Physics,
Edmonton AB T6G 2J1, Canada
29Research Institute for Particle and Nuclear Physics,
H-1525 Budapest, P O Box 49, Hungary
30Institute of Nuclear Research,
H-4001 Debrecen, P O Box 51, Hungary
31Ludwig-Maximilians-Universität München,
Sektion Physik, Am Coulombwall 1, D-85748 Garching, Germany
32Max-Planck-Institute für Physik, Föhringer Ring 6,
D-80805 München, Germany
33Yale University, Department of Physics, New Haven,
CT 06520, USA
a and at TRIUMF, Vancouver, Canada V6T 2A3
b and Royal Society University Research Fellow
c and Institute of Nuclear Research, Debrecen, Hungary
d and Heisenberg Fellow
e and Department of Experimental Physics, Lajos Kossuth University,
Debrecen, Hungary
f and MPI München
g and Research Institute for Particle and Nuclear Physics,
Budapest, Hungary
h now at University of Liverpool, Dept of Physics,
Liverpool L69 3BX, UK
i and CERN, EP Div, 1211 Geneva 23
j and Universitaire Instelling Antwerpen, Physics Department,
B-2610 Antwerpen, Belgium
k now at University of Kansas, Dept of Physics and Astronomy,
Lawrence, KS 66045, USA
l now at University of Toronto, Dept of Physics, Toronto, Canada
m current address Bergische Universität, Wuppertal, Germany
n and University of Mining and Metallurgy, Cracow, Poland
1 Introduction
Four-fermion processes in collisions have proven to be an important tool for studying the validity of the Standard Model and looking for signs of physics beyond. At centre-of-mass energies () reached at LEP2, from 183 GeV to 209 GeV, pair-production of the gauge bosons of the weak interaction, the W- and Z-bosons, has been studied extensively [1, 2]. The cross-sections for these two processes are characterized by a steep increase near threshold. They have been measured by restricting the invariant masses of pairs of fermions to the W or Z mass, thereby selecting only some of all possible four-fermion final states. It is therefore interesting to extend the measurement into regions where the invariant masses of the fermion-pairs are not as restricted. Results on this have been reported from the LEP experiments for centre-of-mass energies up to 183 GeV [3]. The present study provides results at higher energies with greatly increased luminosity. This extension provides an especially important test for the production of new particles with masses well below or above the W or Z mass.
In this paper we describe a selection for and final states that is sensitive to all invariant masses of fermion pairs. Restrictions are made only for low hadronic () mass values to avoid the region of hadronic resonances and at very small masses of the electron111Charge conjugation is implied throughout this paper. pair (), where low efficiencies compromise the measurement. The final states of interest are produced via -channel annihilation of the two incoming electrons into a Z or and the radiation of a Z or from either an incoming electron or an outgoing fermion, for example as shown in Figures 1a) and b). For the case of final states, there is also a -channel contribution, as shown in Figure 1c). In a large fraction of the -channel events, one or both electrons cannot be detected, as their scattering angle is small and outside of the acceptance of the detector. We therefore define the following kinematic bounds to classify events as signal:
-
•
The polar angles , defined with respect to the incoming electron beam, of both leptons have to satisfy .
-
•
The invariant mass of the system has to be larger than 5 GeV in order to avoid the complex region of hadronic resonances.
-
•
For the final state, the invariant mass of the system has to be larger than 2 GeV. For invariant masses below 2 GeV, the efficiency is too small to provide a reliable measurement. There is no restriction imposed on the invariant mass of the system in the analysis.
-
•
Events stemming from multi-peripheral diagrams, involving the exchange of two photons (Figure 1d)), are not considered as signal. The interference between the signal diagrams and the multi-peripheral diagrams is small compared to the signal cross-section and is neglected.
In about 650 of data recorded with the OPAL detector in the years 1997 to 2000 at centre-of-mass energies between 183 GeV and 209 GeV, the cross-sections for the processes and are measured within the kinematic bounds described above.
The paper is organized as follows. First, a description of the OPAL detector and the data sample is given. Then, the Monte Carlo generators used to simulate the signal and background events are described. Following this, the analyses used to select the signal events are detailed. After a description of the systematic studies, the measured cross-sections are given, together with a discussion of the results.
2 Description of Data and Detector
Data recorded with the OPAL detector in the years 1997 to 2000 at centre-of-mass energies between 183 GeV and 209 GeV are used in this analysis. The data taken in each year are analysed separately, except for 1999, where data were taken at centre-of-mass energies between 192 GeV and 202 GeV. Due to the large range of centre-of-mass energies these data are subdivided into two samples, one below and one above 197 GeV.
A detailed description of the OPAL detector can be found elsewhere [4] and only a brief description is given here. The central detector consists of a system of tracking chambers which provide charged particle tracking over 96% of the full solid angle, within a uniform magnetic field of 0.435 T parallel to the beam axis. The central detector is composed of a two-layer silicon microstrip vertex detector and three different drift chambers: a high-precision vertex chamber, a large-volume jet chamber, and a set of chambers which provide the track coordinates along the beam direction. A lead-glass electromagnetic calorimeter (ECAL), located outside the magnet coil, covers the full azimuthal range with excellent hermeticity in the polar angle range of for the barrel region, and for the endcap region. The magnet return yoke is instrumented with hadron calorimetry (HCAL), and consists of barrel and endcap sections, along with pole-tip detectors, which together cover the region . Four layers of muon chambers cover the outside of the hadron calorimeter. Electromagnetic calorimeters close to the beam axis complete the geometrical acceptance down to 24 mrad, except for regions where a tungsten shield designed to protect the detectors from synchrotron radiation is located. These calorimeters include the forward detectors (FD), which are lead-scintillator sandwich calorimeters, and, at smaller angles, silicon-tungsten calorimeters [5] located on both sides of the interaction point. The silicon-tungsten calorimeters are used to evaluate the luminosity by observing small-angle Bhabha events.
3 Monte Carlo simulation
Four-fermion final states for the signal processes are generated with the grc4f [6] Monte Carlo (MC) program. For the final states, both -channel and -channel diagrams contribute. In the -channel processes, the momentum transfer squared between the two electrons is in general small. The relevant value of the electromagnetic coupling constant is therefore . For the -channel diagrams, a scale of the order of is important, leading to a larger value of . To account for interference effects, the - and -channel diagrams have to be generated simultaneously. Within the given kinematic limits of the signal definition, the -channel contribution is only slightly larger than that from the -channel and the interference between the two channels is negative and of the order of 15%. In grc4f v2.1, a fixed value of is used in the generation of events. To investigate the impact of the chosen value of on the selection efficiencies, two sets of signal Monte Carlo for final states are generated using different values, and , leading to an average 15% difference in the cross-section.
For events, only -channel diagrams contribute, and a value of is used. For comparison to grc4f, EXCALIBUR [7] and KORALW [8] are also used to produce signal events.
Events from multi-peripheral diagrams with at least one electron inside the detector acceptance are produced using the TWOGEN [9] generator. As a check the generator PHOJET [10] is also used for multi-peripheral diagrams with both electrons inside the detector. Hadronization is performed with JETSET [11]. Four-fermion final states not included in the signal definition and not stemming from multi-peripheral diagrams are generated with grc4f. Processes involving two fermions in the final state are simulated using KK2f [12] for multi-hadronic () events. PYTHIA [11] is used as a cross-check. For the process , BHWIDE [13] is used. Background contributions from other processes are found to be negligible. All Monte Carlo events are passed through the full simulation of the OPAL detector [14], and then subjected to the same reconstruction and analysis procedures as data.
4 Event Selection
The event selection is done separately for and final states, but the two sets of selections are very similar. Final states are selected according to the signal topology, and cuts corresponding to the signal definition given in Section 1 are applied.
4.1 Selection of events
The selection makes use of the signal topology of two isolated electrons and two jets, which together sum to the total centre-of-mass energy. A kinematic fit is performed, making use of the four constraints coming from energy and momentum conservation. The number of events remaining after each selection cut for data, signal, and background, are listed in Table 1.
-
•
Cut 0: Preselection
In the preselection at least seven tracks are required in the event and the visible energy, calculated using a method [15] that avoids double-counting of track momenta and energy deposition in the calorimeter, is required to be greater than half of the centre-of-mass energy. At least two tracks of opposite charge, each satisfying the following criteria, must be present and are considered as electron candidates:-
–
The absolute value of the momentum has to be greater than 2 GeV.
-
–
The electron must not be identified as arising from a photon conversion, i.e. the output of the conversion neural network as described in [16] has to be less than 0.8.
Using a neural network electron finder [17, 18] an output value is calculated for each electron candidate. From those candidates with no more than one track with opposite sign and momentum greater than 2 GeV within a cone of 10∘ half opening angle, the candidate with the highest output value is selected as the first electron.
From the candidates with charge opposite to that of the first electron and no track, except for the first electron, within a cone of 10∘ half opening angle, the one with the highest output value is taken as the second electron. No requirement is made on the minimum output value for the electrons.
-
–
-
•
Cut 1: 4C kinematic fit
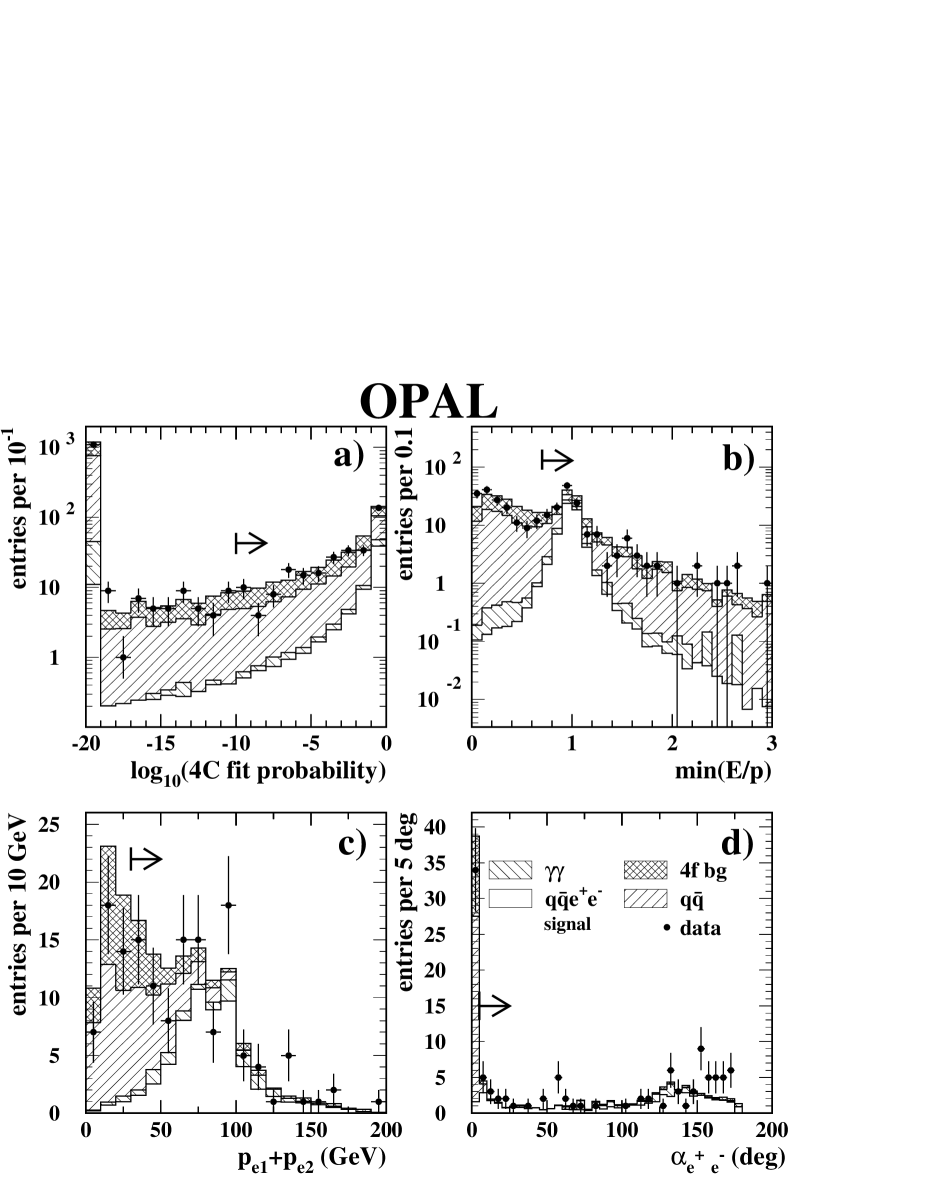
Excluding the two electron candidates selected in the preselection, and their associated calorimeter clusters, the rest of the event is forced into two jets using the Durham [19] jet finder. A four-constraint kinematic fit (4C fit) is applied to the energy and momenta of the two electron candidates and the two jets. We use the ECAL energy and the track angles for the electron candidates and the jet momenta as input to this fit. The fit probability is required to be greater than (see Figure 2a). This requirement greatly reduces background with missing energy, for example from . -
•
Cut 2: Electron identification
The two electrons selected in the preselection are required to satisfy , where is the energy deposited in the electromagnetic calorimeter associated with the track (see Figure 2b). -
•
Cut 3: Momentum cuts
The sum of the momenta of the two electrons has to be greater than 30 GeV (see Figure 2c). -
•
Cut 4: Isolation
The angle between the two electron tracks is required to be greater than 5∘ (see Figure 2d), and the two electron tracks must not point to the same ECAL cluster, as otherwise their invariant mass is difficult to reconstruct. -
•
Cut 5: Invariant masses of electron and quark pairs
Corresponding to the signal definition, the invariant mass of the electron pair () must be greater than 2 GeV, and the invariant mass of the quark pair () greater than 5 GeV. The invariant masses are obtained from the kinematic fit. -
•
Cut 6: Multi-peripheral background
Multi-peripheral events typically have both electrons scattered at small angles. To reject these events, at least one of the electrons must have cos( 0.7, where is the scattering angle of the electron with respect to its incoming direction.
| Cut | Data | Total MC | multi- | multi- | four fermion | |
|---|---|---|---|---|---|---|
| peripheral | hadronic | background | ||||
| Cut 0 | 1450 | 1377.1 7.9 | 74.6 0.3 | 51.4 2.3 | 889.8 6.5 | 361.3 3.8 |
| Cut 1 | 303 | 336.0 3.4 | 60.8 0.3 | 12.6 0.9 | 146.0 2.6 | 116.7 2.0 |
| Cut 2 | 148 | 164.9 2.3 | 58.8 0.3 | 11.1 0.8 | 57.1 1.7 | 38.0 1.3 |
| Cut 3 | 109 | 111.5 1.8 | 56.9 0.3 | 10.3 0.8 | 28.4 1.2 | 15.8 1.1 |
| Cut 4 | 75 | 71.1 1.2 | 56.0 0.3 | 10.3 0.8 | 0.6 0.2 | 4.2 0.9 |
| Cut 5 | 69 | 68.8 1.2 | 55.6 0.3 | 10.2 0.8 | 0.6 0.2 | 2.4 0.9 |
| Cut 6 | 58 | 58.6 1.0 | 51.2 0.3 | 5.1 0.5 | 0.6 0.2 | 1.8 0.8 |
After these cuts, a total of 58 events is observed in the data, with an expectation of 58.6 events from Monte Carlo simulation. The selection efficiency is greater than 40% for , and around 20% for higher masses. The difference in efficiency is due to the - and -channel contributions. For , the -channel is dominant. Here, the scattered electrons are forward peaked, and therefore have a lower efficiency than in the -channel.
4.2 Selection of events
This selection is similar to the one applied for the final states, making use of the signal topology where two muons replace the two electrons. The number of events, after each cut for data, signal and background are listed in Table 2.
-
•
Cut 0: Preselection
In the preselection, a multiplicity of at least seven tracks is required. The visible energy has to be greater than half of the centre-of-mass energy.From all tracks with momentum greater than 5 GeV and no more than one track with opposite sign and momentum greater than 2 GeV within a cone of 10∘ half opening angle, the one with the highest momentum is selected as the first muon candidate.
From the tracks with charge opposite to that of the first muon candidate and no track, except for the first muon candidate, within a cone of 10∘ half opening angle, the one with the highest momentum is taken as the second muon candidate.
-
•
Cut 1: 4C kinematic fit
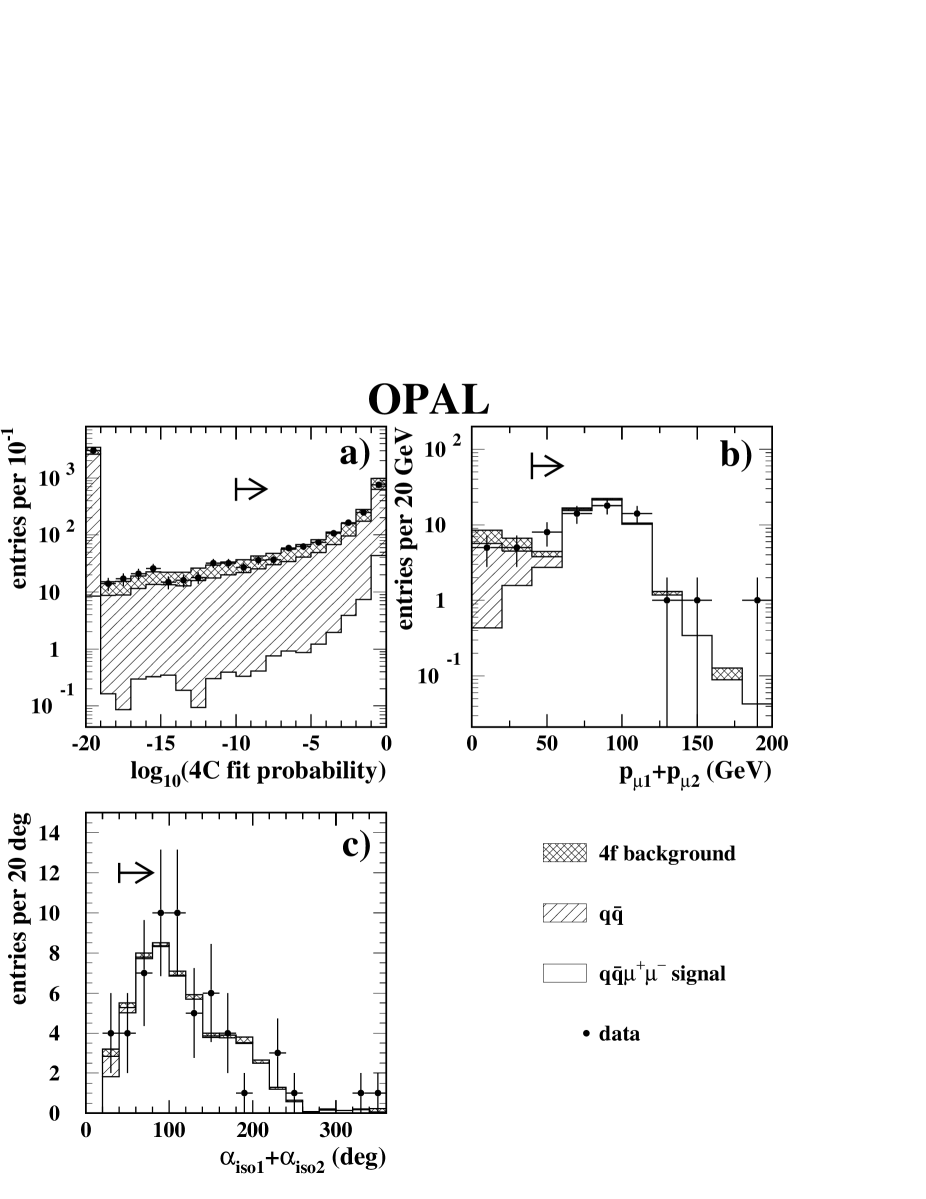
Excluding the two muon candidates selected in the preselection, and their associated calorimeter clusters, the rest of the event is forced into two jets using the Durham [19] jet finder. A four-constraint kinematic fit (4C fit) is applied to the energy and momenta of the two muon candidates and the two jets. The track momenta of the muon candidates and jet momenta are used as input to this fit. The fit probability is required to be greater than (see Figure 3a). -
•
Cut 2: Muon identification
A muon identification criterion is applied to the two selected muon candidates. Muon identification makes use of three methods:- –
- –
-
–
Tracks associated with an ECAL cluster with energy smaller than 2 GeV are selected as muon candidates.
The first muon can be accepted using any of the above three selections. The second muon is accepted if it fulfils the first condition, or if it fulfils either of the other two conditions and the two following isolation criteria: the angle between the two muons must be greater than , and the angle between the second muon and any other track, except for the first muon, must be greater than .
-
•
Cut 3: Momentum cuts
The sum of the momenta of the two muons has to be greater than 40 GeV (see Figure 3b). -
•
Cut 4: Isolation angles
The sum of the isolation angles of the two muons has to be greater than 40∘ (see Figure 3c). The isolation angle is the angle between the muon and any other track with the exception of the other muon. -
•
Cut 5: Invariant mass of quark pair
Corresponding to the signal definition, the invariant mass of the quark pair must be greater than 5 GeV.
| Cut | Data | Total MC | multi-hadronic | four-fermion | |
|---|---|---|---|---|---|
| background | |||||
| Cut 0 | 4809 | 4789.2 14.9 | 71.9 1.4 | 2972.3 12.0 | 1745.0 8.6 |
| Cut 1 | 1575 | 1598.7 8.0 | 61.3 1.3 | 834.7 6.4 | 702.7 4.7 |
| Cut 2 | 67 | 70.1 1.4 | 53.3 1.2 | 7.9 0.6 | 8.9 0.5 |
| Cut 3 | 57 | 55.8 1.3 | 51.3 1.2 | 1.5 0.3 | 3.0 0.3 |
| Cut 4 | 53 | 52.6 1.3 | 49.4 1.2 | 0.5 0.2 | 2.7 0.3 |
| Cut 5 | 52 | 52.3 1.3 | 49.4 1.2 | 0.5 0.2 | 2.4 0.3 |
After these cuts a total of 52 events is observed in the data and 52.3 events are expected from Monte Carlo simulation, mainly originating from signal, with only little contribution from background. The selection efficiency ranges from 30% for muon invariant masses () below 2 GeV, and is above 60% for masses above 30 GeV.
5 Systematic Uncertainties
Systematic uncertainties result from the determination of signal efficiencies and background levels, both of which are estimated from Monte Carlo samples. For both types of samples the agreement between the simulation and the data was investigated, and the difference taken into account as a systematic uncertainty. In addition, for the signal efficiency the predictions from the different Monte Carlo generators, and the dependence on the input parameters, were checked, and any differences in selection efficiencies taken into account as a systematic error.
5.1 Selection efficiency
Systematic uncertainties on the efficiency are calculated by varying the cuts used in the selection. Any difference in efficiency for the altered cut is taken as a systematic error. Below follows a more detailed description of how each cut was varied.
-
•
The preselection requires a high multiplicity. The impact of a change of track in the preselection was studied for the signal MC.
-
•
The isolation angle for the leptons is required to be greater than 10∘. The uncertainty in the measurement of the angles in the jet chamber is about 0.1∘. This has to be multiplied by for the measurement of the angle between two tracks. The preselection cut is varied by this value to gauge its impact on the result.
-
•
A direct shift of 0.2∘ is applied to the angle between the two electrons for the selection to account for possible biases in the angular reconstruction. This value was determined from studies comparing the angular reconstruction in the tracking and calorimeters.
-
•
For the sum of the lepton momenta, the value in case of the electrons, and the sum of the isolation angles of the muons, the distribution of the variable is compared between data and MC. The MC distribution is corrected to the data and the change in efficiency is taken as a contribution to the systematic error.
The systematic errors are calculated at each centre-of-mass energy. No energy dependence is observed, therefore values derived from a comparison of the combined data and Monte Carlo samples are used for all energies. These values are shown in Table 3.
| signal | multi- | multi- | four-fermion | signal | multi- | four-fermion | |
|---|---|---|---|---|---|---|---|
| eff. | peripheral | hadronic | background | eff. | hadronic | background | |
| 2.1 % | 4.6 | 0 | 0 | 0.8 % | 0 | 10.6 | |
| 0.3 | 2.3 | 0 | 0.3 | 0.2 % | 11.1 | 0.6 | |
| 0.2 | 0 | 0 | 0 | – | – | – | |
| 1.2 | 1.5 | 18.8 | 4.7 | – | – | – | |
| 0.1 | 0 | 6.3 | 2.8 | 0.8 % | 22.2 | 3.8 | |
| – | – | – | – | 1.3 % | 5.6 | 1.9 | |
| total error | 2.4 | 5.3 | 19.8 | 5.5 | 1.7 % | 25.5 | 11.5 |
| MC | |||||||
| generators | 10.7 % | 100 % | 4.5 % | – | 7.8 % | 9.6 % | – |
For the selection, the difference in efficiency from the Monte Carlo samples generated with values of and is 5.2%. For the calculation of the cross-section, the average efficiency of the two samples is used, and assigned a systematic error of 2.6%. To determine the systematic uncertainty arising from use of the grc4f generator, a comparison with EXCALIBUR is done. In EXCALIBUR, events can only be generated for four-fermion final states including multi-peripheral diagrams. For this reason, additional events are generated with grc4f, also including multi-peripheral diagrams. The selection efficiency for these two event samples is compared. A difference of 10.7% is found and is taken as a systematic error. The main reason for this difference is a larger fraction of events with small lepton scattering angles in EXCALIBUR than in grc4f. This type of event has a much smaller selection efficiency than events with large scattering angles and consequently leads to the observed difference.
For the selection, the expected cross-sections at each centre-of-mass energy agree well for the three MC generators grc4f, EXCALIBUR and KORALW. There is, however, a difference observed for the selection efficiencies. While the EXCALIBUR and KORALW efficiencies agree, there is a large difference relative to grc4f. This difference stems mainly from muons with momentum below 3 GeV, which have a small detection efficiency, and of which there are more in EXCALIBUR and KORALW than in grc4f. As EXCALIBUR and KORALW provide very similar efficiencies, the difference between grc4f and the mean efficiency of EXCALIBUR and KORALW is averaged over all centre-of-mass energies which leads to a systematic error of 7.8%.
5.2 Background
The same systematic studies as for the signal Monte Carlo are performed for the background Monte Carlo. The systematic uncertainties derived are given in Table 3. In addition for the analysis for the multi-hadronic events, a comparison of KK2f and PYTHIA resulted in a 4.5% difference in the number of selected events, which is also included in the systematic error. Due to the small amount of background in the final sample, these uncertainties result in only a 1.1% systematic error on the cross-section.
For the process , the cross-section of the background stemming from multi-peripheral processes is not well known and the final states for background and signal are identical. But the angular distributions, especially of the electrons, are quite different. The generator TWOGEN gives a good relative description of the electron angular distribution after applying cuts 4, 5 and 6. From the generator PHOJET, no events are expected after cut 4. This is not in good agreement with the data. Therefore, half of the background predicted by TWOGEN is used in the calculation of the cross-section and in Tables 1, 2 and 4. A systematic uncertainty of 100% is assigned to this background, covering both the full TWOGEN and the PHOJET prediction. This leads to a 10.0% systematic error on the measured cross-section.
For the selection, there is very little background in total. An error on the multi-hadronic background of 9.6% is assigned from the comparison of KK2f and PYTHIA. All of the systematic errors taken together result in a systematic error on the cross-section of 0.9%.
6 Results and Discussion
With the event selections described in Section 4, the number of data and expected background events are determined at several centre-of-mass energies, as given in Table 4. The signal efficiency is calculated by applying the signal selection to the signal Monte Carlo samples. For the process , the efficiency is slightly higher for the signal produced with than for , as the -channel contribution is smaller in the former. To account for the difference, the average of the two efficiencies is used in the calculation of the cross-section. The efficiencies at each centre-of-mass energy are listed in Table 4.
| (GeV) | d | Data | Background | Efficiency () | (fb) | (fb) |
| (pb-1) | ||||||
| 182.7 | 54.7 | 3 | 0.6 0.4 | 37.0 4.3 | 120 87 18 | 166 |
| 188.6 | 174.7 | 21 | 2.5 1.7 | 39.9 4.6 | 265 67 41 | 177 |
| 194.9 | 100.0 | 13 | 1.4 0.9 | 41.2 4.8 | 282 88 43 | 180 |
| 200.7 | 110.3 | 9 | 1.5 1.0 | 42.0 4.9 | 163 66 25 | 180 |
| 206.1 | 214.5 | 12 | 1.5 1.3 | 40.6 4.7 | 121 41 19 | 177 |
| 182.7 | 54.7 | 6 | 0.3 0.1 | 41.8 3.8 | 249 108 20 | 163 |
| 188.6 | 174.7 | 13 | 0.6 0.1 | 40.9 3.7 | 175 51 14 | 168 |
| 194.9 | 100.0 | 9 | 0.5 0.1 | 48.3 4.3 | 175 62 14 | 168 |
| 200.7 | 110.3 | 11 | 0.4 0.1 | 52.0 4.5 | 184 58 15 | 165 |
| 206.1 | 214.5 | 13 | 1.1 0.2 | 49.5 4.3 | 112 35 9 | 160 |
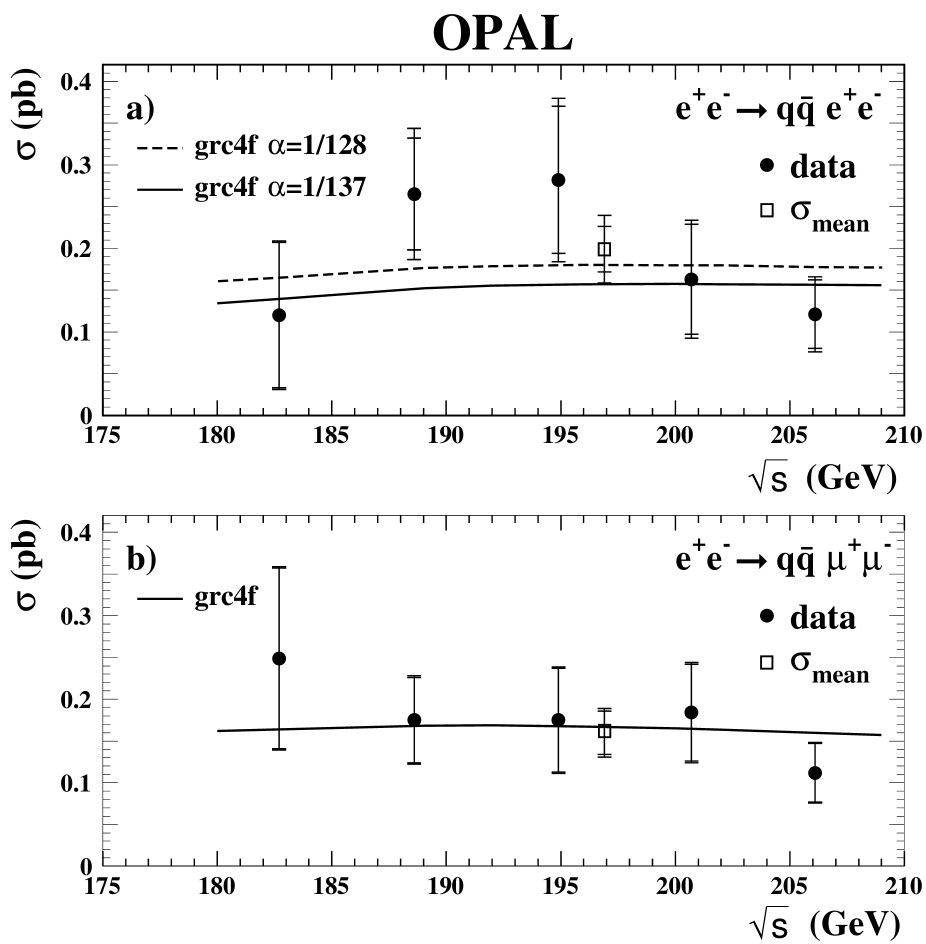
The measured cross-sections at each centre-of-mass energy for the processes and within the kinematic region described in Section 1 are given in Table 4. For the process , several generators are used to calculate the cross-section, and all generators agree within 1%.
The measured cross-sections, together with the theoretical predictions, are shown in Figures 4a) and b). The expected values appear to be at their maximum values within the studied region, and show only a small variation with the centre-of-mass energy. This is in contrast to the cross-section for pair-production of W and Z-bosons, which shows a very steep rise near threshold. As the change in the predicted cross-section over the measured range is much smaller than the error of each individual measurement, an average cross-section over the whole centre-of-mass energy range has also been calculated. This average does not take into account the predicted change with the centre-of-mass energy. Also, the average cross-section is calculated using the expected error at each energy rather than the observed one. This method gives more reliable results for measurements with a small number of expected events. The average cross-sections are = (199 27 30) fb and = (160 26 13) fb.
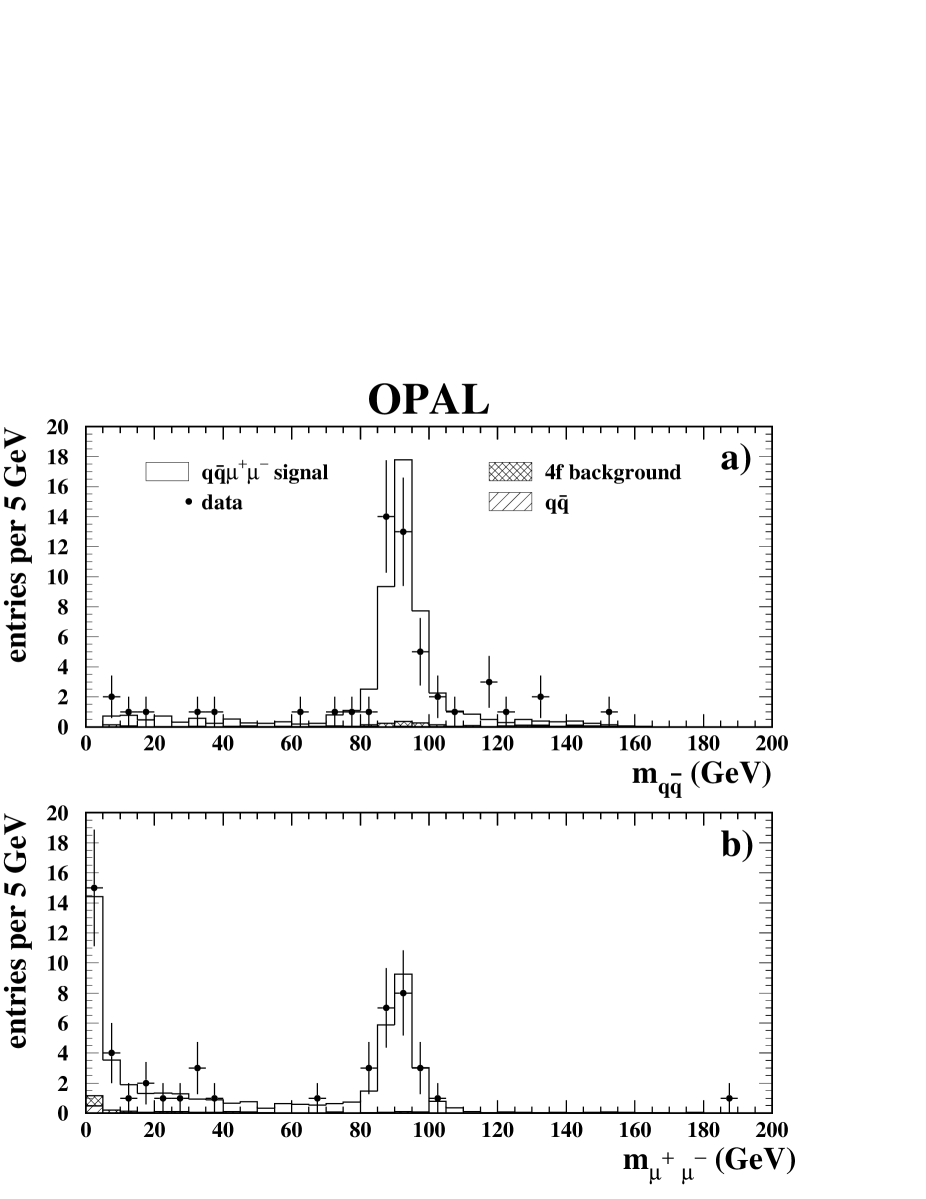
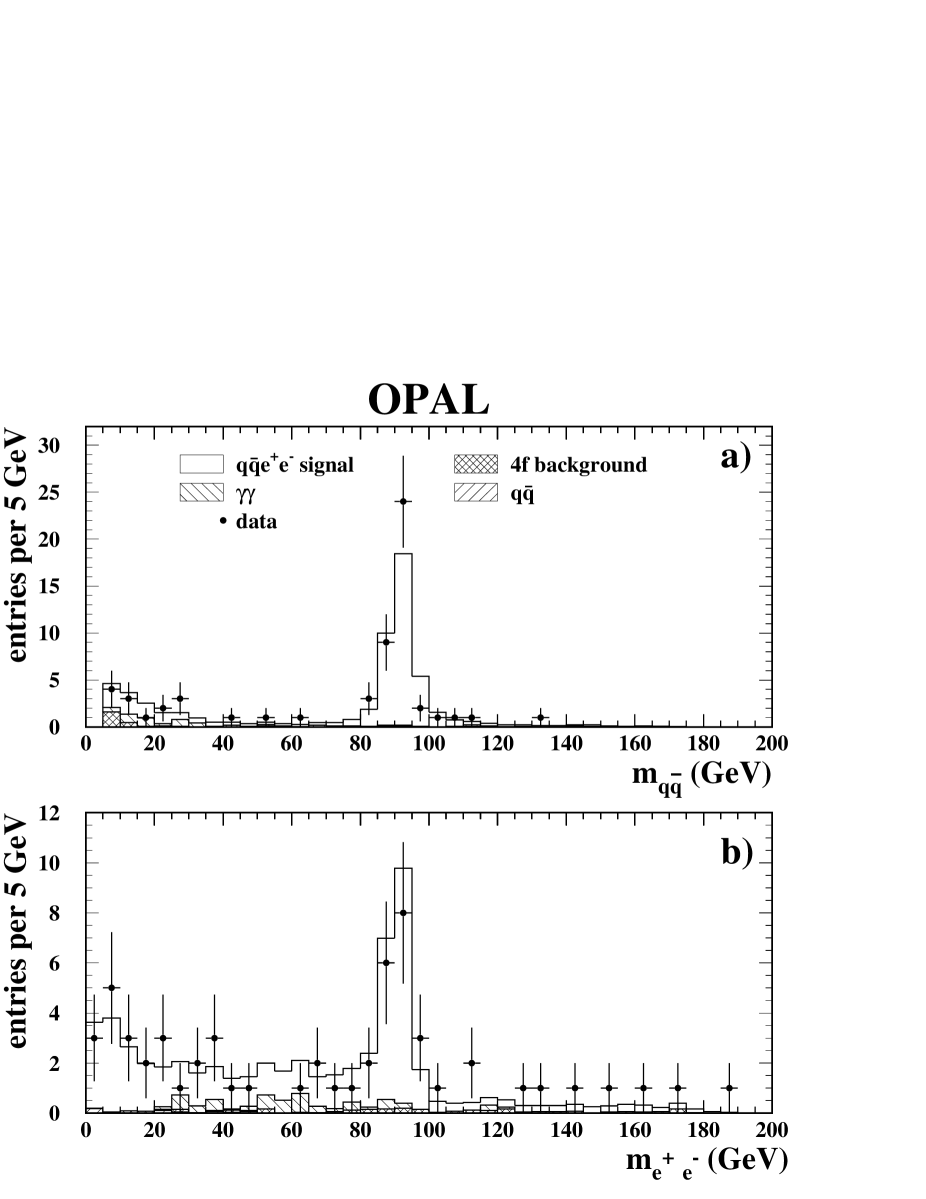
For the process , only -channel diagrams contribute, and the final states are produced via . This can be seen in the distribution of the invariant masses and in Figures 5 a) and b). The distribution of shows two peaks, one at zero, stemming from the , and one at from the Z decays. The data are well described by the MC. For the distribution of the peak around the Z mass is dominant, as the branching ratio of the Z into quarks is much larger than that into charged leptons. One event is observed at a very large mass GeV. The probability to observe at least one event above an invariant mass of 110 GeV is 48%.
In the process , -channel diagrams contribute in addition to the -channel diagrams. The distribution of the invariant masses and are shown in Figures 6 a) and b). The -channel contribution is clear in the distribution of . In contrast to , there are several events observed at invariant masses well above the Z mass.
7 Conclusions
The cross-sections for the processes and have been measured at centre-of-mass energies between 183 GeV and 209 GeV, the highest centre-of-mass energies studied to date. Within chosen kinematic limits, the predictions from grc4f are in good agreement with the measurements. The distributions of the invariant masses of the fermion-antifermion pairs show the expected behaviour, with the -channel contribution clearly visible in the channel.
Acknowledgements
We particularly wish to thank the SL Division for the efficient operation
of the LEP accelerator at all energies
and for their close cooperation with
our experimental group. In addition to the support staff at our own
institutions we are pleased to acknowledge the
Department of Energy, USA,
National Science Foundation, USA,
Particle Physics and Astronomy Research Council, UK,
Natural Sciences and Engineering Research Council, Canada,
Israel Science Foundation, administered by the Israel
Academy of Science and Humanities,
Benoziyo Center for High Energy Physics,
Japanese Ministry of Education, Culture, Sports, Science and
Technology (MEXT) and a grant under the MEXT International
Science Research Program,
Japanese Society for the Promotion of Science (JSPS),
German Israeli Bi-national Science Foundation (GIF),
Bundesministerium für Bildung und Forschung, Germany,
National Research Council of Canada,
Hungarian Foundation for Scientific Research, OTKA T-029328,
and T-038240,
Fund for Scientific Research, Flanders, F.W.O.-Vlaanderen, Belgium.
References
-
[1]
ALEPH Collaboration, R. Barate et al.,
Phys. Lett. B484 (2000) 205;
DELPHI Collaboration, P. Abreu et al., Phys. Lett. B479 (2000) 89;
L3 Collaboration, M. Acciarri et al., Phys. Lett. B496 (2000) 19;
OPAL Collaboration, G. Abbiendi et al., Phys. Lett. B493 (2000) 249. -
[2]
ALEPH Collaboration, R. Barate et al.,
Phys. Lett. B469 (1999) 287;
DELPHI Collaboration, P. Abreu et al., Phys. Lett. B497 (2001) 199;
L3 Collaboration, M. Acciarri et al., Phys. Lett. B497 (2001) 23;
OPAL Collaboration, G. Abbiendi et al., Phys. Lett. B476 (2000) 256. -
[3]
ALEPH Collaboration, D. Buskulic et al.,
Phys. Lett. B388 (1996) 419;
L3 Collaboration, M. Acciarri et al., Phys. Lett. B450 (1999) 281;
OPAL Collaboration, G. Alexander et al., Phys. Lett. B376 (1996) 315. -
[4]
OPAL Collaboration, K. Ahmet et al., Nucl. Instr. Meth. A305 (1991) 275;
S. Anderson et al., Nucl. Instr. Meth. A403 (1998) 326. - [5] B.E. Anderson et al., IEEE Transactions on Nuclear Science 41 (1994) 845.
- [6] J. Fujimoto et al., Comput. Phys. Commun. 100 (1997) 128.
- [7] F.A. Berends, R. Pittau, R. Kleiss, Comput. Phys. Commun. 85 (1995) 437.
- [8] S. Jadach, W. Placzek, M. Skrzypek, B.F.L. Ward, Z. Wa̧s, Comput. Phys. Commun. 140 (2001) 475.
-
[9]
A. Buijs et al., Comput. Phys. Commun. 79 (1994) 523.
The perimiss option has been used in the generation of events. -
[10]
R. Engel and J. Ranft, Phys. Rev. D54 (1996) 4244;
R. Engel, Z. Phys. C66 (1995) 203. - [11] T. Sjöstrand, Comput. Phys. Commun. 82 (1994) 74.
-
[12]
S. Jadach, B.F.L. Ward, Z. Wa̧s, Comput. Phys. Commun. 130 (2000) 260;
S. Jadach, B.F. Ward, Z. Wa̧s, Phys. Lett. B449 (1999) 97. - [13] S. Jadach, W. Placzek, B.F.L. Ward, Phys. Lett. B390 (1997) 298.
- [14] J. Allison et al., Nucl. Instr. Meth. A317 (1992) 47.
- [15] OPAL Collaboration, K. Ackerstaff et al., Eur. Phys. J. C2 (1998) 213.
- [16] OPAL Collaboration, G. Alexander et al., Z. Phys. C70 (1996) 357.
- [17] OPAL Collaboration, R. Akers et al., Z. Phys. C60 (1993) 199.
- [18] OPAL Collaboration, P.D. Acton et al., Z. Phys. C60 (1993) 19.
-
[19]
N. Brown and W. J. Stirling, Phys. Lett. B252 (1990) 657;
S. Bethke, Z. Kunszt, D. Soper and W. J. Stirling, Nucl. Phys. B370 (1992) 310;
S. Catani et al. Phys. Lett. B269 (1991) 432;
N. Brown and W. J. Stirling, Z. Phys. C53 (1992) 629. - [20] OPAL Collaboration, R. Akers et al., Z. Phys. C60 (1993) 199.
- [21] OPAL Collaboration, P.D. Acton et al., Z. Phys. C60 (1993) 19.
- [22] OPAL Collaboration, R. Akers et al., Phys. Lett. B389 (1996) 416.
- [23] OPAL Collaboration, R. Akers et al., Eur. Phys. J. C1 (1998) 395.