ATMOSPHERIC NEUTRINOS IN 2002
Abstract
In this talk, I will present a snapshot of key results regarding atmospheric neutrinos, as of the summer of 2002. I will review the evidence for neutrino oscillation, dominated by the large sample from Super-Kamiokande, but supported by confirmation from MACRO and Soudan 2. I will then review some of the more detailed inquiries made using Super-Kamiokande data such as alternative scenarios, three-flavor oscillation, and tau neutrino appearance.
1 Introduction
Atmospheric neutrinos are produced by the decay of pions, kaons, and muons in cosmic ray showers. They have provided a fortuitous laboratory for neutrino oscillations, where the oscillation probability:
| (1) |
is probed over a wide range of (10-10000 km) and (0.5-100 GeV).
Two normalizing principles are used to understand the data. First, cosmic ray showers consist mostly of pions, which decay to , and the decays to , resulting in a flux ratio . This ratio grows to larger values at high energy, as the time-dilated muon may strike the ground before decaying (removing from the beam), but at all relevant energies the ratio is predicted to about 5% accuracy. The second principle is that at equal zenith and nadir angles the flux of high energy neutrinos must be nearly identical. Again, this is predicted with an accuracy of a few percent.
Before I review the experimental data, I should mention some developments in the neutrino flux calculation[1], which is a key input to more detailed understanding of the data. First, there is new data providing clarity regarding the flux of primary cosmic rays, which is the starting point for these calculations. The BESS and AMS spectrometers have made new precision measurements[2, 3] in the important range of 5-100 GeV/nucleon, with data in good agreement with each other whereas older measurements had fairly sizeable disagreements.
Second, increased computational power and the large Super-K data sample have motivated the transition from 1-dimensional calculations[4], where the of the daughter particles is neglected and every neutrino is assumed to follow the trajectory of the primary proton, to 3-dimensional calculations[5]. In 3-dimensions, one should account for as well as bending in the geomagnetic field. The first 3-D calculations showed a relatively surprising effect that turns out to play little if any role in oscillation studies. The effect is an enhanced neutrino flux at the horizon. Indeed, below GeV, there is fairly sharp peaking as a function of zenith angle, as shown in Fig. 1. The central dip in the 1-D curve is caused by geomagnetic cutoff; the central enhancement in the 3-D curves overwhelms the cutoff. These effects are stronger with decreasing neutrino energy, but the lower the energy of the neutrino, the poorer is the correlation between the neutrino direction and that of the outgoing lepton. The net result is that the any structure at the horizon is washed out of the angular distributions of the lepton, as also shown in Fig. 1. The predicted shapes are nearly the same for each calculation. There are some differences in the overall normalization between the models, but in neutrino oscillation studies, the flux normalization is usually allowed to float as a free parameter.

2 Evidence for Neutrino Oscillations
The evidence for neutrino oscillations[6] hinges on the two aforementioned normalizations of the atmospheric neutrino flux: that it should be composed of a well-predicted ratio of to , and that it should be up-down symmetric at all zenith angles. To further cancel experimental systematic uncertainties, the flux ratio of to is compared to a detailed Monte Carlo simulation by forming a double-ratio, . For the sub-GeV sample of events ( GeV), the Super-Kamiokande analysis of 1489 days of data[7] shows:
| (2) |
The up-down asymmetry is expected to be zero for the multi-GeV muon sample ( GeV), but is measured to be:
| (3) |
whereas the asymmetry is consistent with zero for the multi-GeV electron sample and the multi-GeV muon Monte Carlo. The up-down asymmetry deviates from expectation by more than 10, essentially independent of any Monte Carlo input.
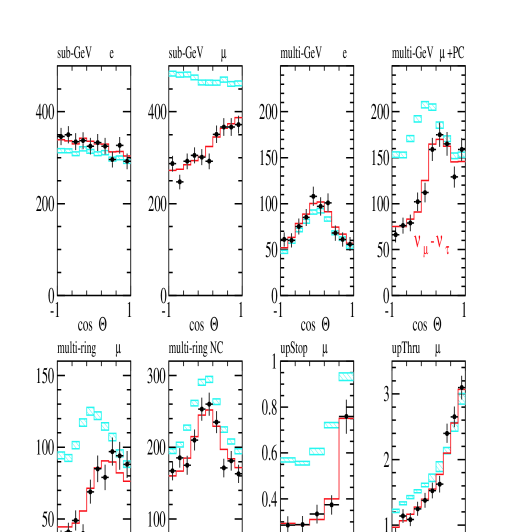
To estimate the parameters of neutrino oscillation, Super-K bins the single-ring and events in energy and zenith angle (effectively path-length ). Additional bins are also used: partially contained events where the muon exits the detector, multiple-ring events where the brightest ring is -like, or upward-going muons where the muon enters the detector from a neutrino interaction in the surrounding rock. Another category of multiple-ring events are selected where the brightest ring is -like; these have an enhanced fraction of neutral current (). These bins play a negligible role in the fits but are valuable in restricting alternative models involving sterile neutrinos or neutrino decay. In total, 155 bins are formed, too many to easily display. Figure 2 shows 95 bins in 10 zenith angle distributions, where some of the 155 bins have been combined. The data fits the prediction beautifully if a two-flavor oscillation is applied to the neutrino flux with and eV2. The contours for this best fit are shown later, in Fig. 5.
In the past, the value of measured by iron calorimeters such as NUSEX[8] and Frejus[9] seemed to show little evidence for neutrino oscillations, compared to the contemporaneous water Cherenkov detectors Kamiokande and IMB. Currently, the Soudan 2 fine-grained iron tracking calorimeter in Minnesota, U.S.A., has recorded the largest data set[10] of contained atmospheric neutrino vertices using iron. They confirm the picture of atmospheric neutrino oscillation, with some quite different systematics such as geomagnetic location, target nucleus, and reconstruction technique. For their analysis of 5.9 ktyrs of data, using a minimum momentum of 300 MeV/c, Soudan 2 reports , in agreement with the results from water Cherenkov experiments.
In addition, the Soudan 2 group exploits the good charged particle recognition of the detector to define a high resolution sample. The sample includes high energy quasi-elastics (single tracks), low energy quasi-elastics where the recoil proton from is identified, and high energy multi-prong events. In each case, the neutrino direction is well determined, with approximately angular resolution (for ) and resolution in of . The data is binned by and compared to Monte Carlo expectation for different oscillation parameters. Figure 3 shows the best agreement, found at and . The apparent suppression of downward-going () explains the high value of compared to the Super-K best fit value. When uncertainties are incorporated, the 90% confidence interval for this fit does allow down to a few times .
The MACRO detector is too coarsely grained and lightweight (4.7 kt) to effectively study contained interactions. However, it has a solid angle acceptance that rivals that of Super-Kamiokande, and is ideally suited to identify neutrino induced upward-going muons using time-of-flight. MACRO consists of a lower section filled with crushed rock absorber and an upper section that is hollow; both sections are instrumented with planes of streamer tube tracking. Fast timing is measured by tanks of liquid scintillator that surround the detector, and the plane between upper and lower sections is also a timing plane of liquid scintillator. The simplest analysis[11] is to measure the distortion in zenith angle flux for upward muons that pass completely through the detector; this is shown in the left panel of Fig. 4. These data demonstrate a best-fit to neutrino oscillation of and , in perfect agreement with the Super-K result. MACRO has also studied the approximate energy distribution of these events (in four bins of 14, 35, 90, and 150 GeV) by considering the amount of multiple scattering[12]. This analysis shows consistency with neutrino oscillations, with the greatest disappearance in the lowest energy bins.
MACRO also measures the rate of lower energy ( 4 GeV) neutrino events that do not pass all of the way through the detector[13]. Internal upgoing events originate in the lower absorber but can be distinguished from downward stopping muons if they pass through two upper timing planes. In addition, there is a sample of internal downgoing events that start in the absorber and exit through the bottom. These have an indistinguishable topology from neutrino induced upward stopping muons. Fortunately, both of these topologies are neutrino induced, with similar parent energy distributions. The results for these samples are shown in the right panels of Fig. 4. These data also favor neutrino mixing in the range of to .
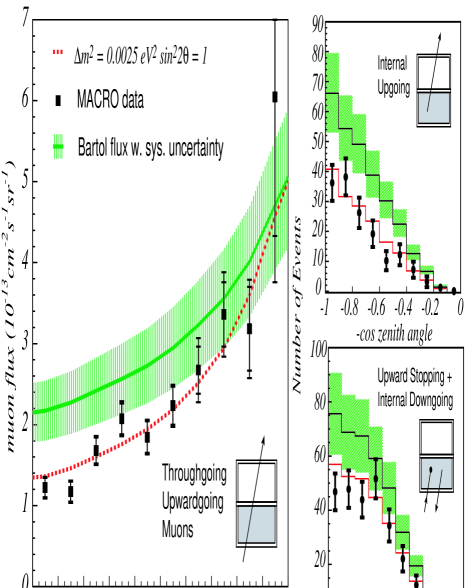
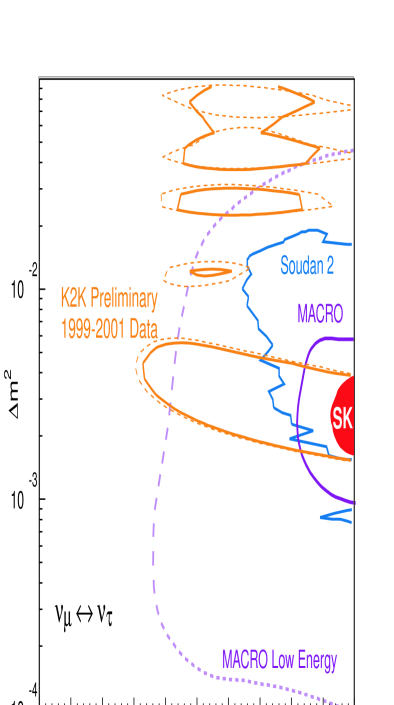
Figure 5 shows the confidence intervals for the atmospheric neutrino analyses just described. The Super-Kamiokande, Soudan 2, and MACRO results are consistent with each other, with the Super-K result yielding the most significant and precise estimation of mass splitting and mixing angle. Despite the varied techniques of these three experiments, they do all rely upon atmospheric neutrinos, hence a further confirmation using a completely different neutrino source is desirable. The K2K experiment is the first long baseline experiment to probe neutrino oscillations with energy and flight distance comparable to atmospheric neutrinos. K2K uses a 98% pure beam with mean energy 1.3 GeV that travels 250 km from KEK to the Super-K detector. The preliminary results from about one half of the planned running have recently been made public[14], and the contour from K2K is also overlayed in Fig. 5; the deepest minimum coincides exactly with the Super-Kamiokande best fit region.
3 Unlikely Alternatives
An important question is whether the Super-K atmospheric neutrino observations are only consistent with -oscillation or could alternatively be explained by neutrino decay[15], or other exotic ideas[16] such as violations of Lorentz invariance, flavor changing neutral currents etc. Table 1 summarizes the results of a fit to the Super-K data, again binned in by energy and zenith angle for fully- and partially-contained events, upward going muons, and multi-ring events. The multi-ring events are subdivided into charged current and neutral current enhanced samples. The Monte Carlo sample used for includes tau lepton appearance.
In Table 1 both the absolute and the differences in compared to the best fit of oscillation are reported. In some cases, the functional form of the transformation probability approaches that of the accepted hypothesis of pure . But in each case, there are typically several bins that constrain the alternative hypothesis. For example, matter effects suppress the oscillation probability for high energy -like bins ( GeV in units of ). For another example, neutral current events should disappear with sterile neutrinos or neutrino decay. By observing the differences in , one effectively ignores whichever bins are not sensitive to the differences in model. None of these pure alternatives fit the data very well; the decoherence model[17] is the most difficult to reject. Observation of an oscillatory minimum that is not washed out by resolution would greatly assist in discrimination.
| Mode | Functional Form | |||
|---|---|---|---|---|
| 173.8 | 0.0 | 0.0 | ||
| 284.3 | 110.5 | 10.5 | ||
| 222.7 | 48.9 | 7.0 | ||
| 281.6 | 107.8 | 10.4 | ||
| decay | 279.4 | 105.6 | 10.3 | |
| decay | 194.0 | 20.2 | 4.5 | |
| decoherence | 184.3 | 10.5 | 3.2 | |
| No oscillation | - | 427.4 | 252.4 | 15.9 |
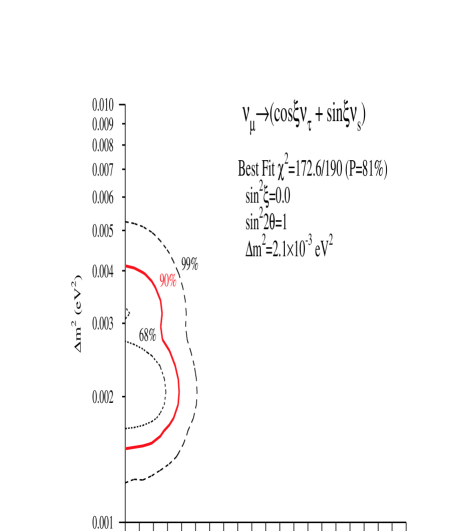
Clearly, one can generally include any exotic alternative as an admixture with “standard” neutrino oscillations. In fact, one is forced to consider both in the decay scenarios, where the neutrinos are required to have mass. For the important case of an admixture of sterile neutrino oscillation, Super-K has quoted limits on the allowable fraction of sterile neutrinos in a 4-neutrino scheme[18]. The mixture is found to be less than 20% (at 90% CL), with best fit to the Super-K data is at pure mixing. Figure 6 shows the allowed region a function of the admixture fraction.
4 Three Flavor Oscillations
Having established nearly maximal mixing as the explanation for the disappearance of atmospheric neutrinos, it is logical to search for a smaller component of mixing with . This is properly done in a 3-neutrino framework, where a unitary matrix mixes the mass eigenstates with the flavor eigenstates. Because the earth is full of electrons, but devoid of free muons or tauons, a component of electron neutrino flavor passing through the earth may be enhanced by a matter effect resonance. The size of the resonant enhancement depends on neutrino energy and the pathlength through matter; therefore, this can potentially be observed by measuring a larger rate than expected in some narrow regions of zenith angle and energy. If one mass splitting dominates in scale over the other, as seems to be the case considering the likely results for solar neutrinos, the oscillation probabilities , , and may be expressed as functions of three parameters: two mixing angles (, ) and the larger mass splitting .
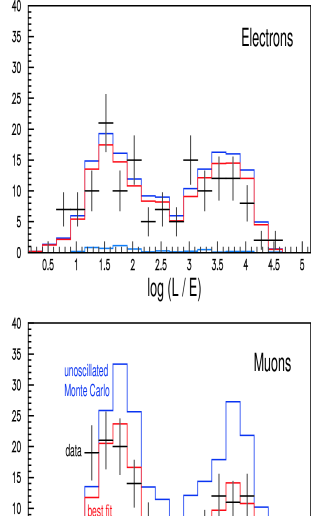
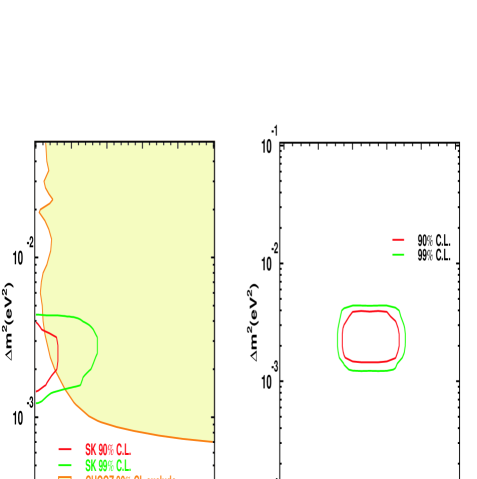
The Super-Kamiokande group has analyzed the sample of electron neutrino interactions with fine binning, but sees no deviation from the predicted rates. This null result is then turned into limits on the three mixing parameters, as shown by contours in Fig. 7. The left panel shows that the small fraction of appearance allowed by the data is consistent with the limit on disappearance from the Chooz[19] reactor experiment. In fact, the data is consistent with no mixing whatsoever.
5 Tau Appearance
If oscillation is taking place, tau leptons should appear in the atmospheric neutrino flux. Most atmospheric do not have more than the of energy needed to produce a lepton, however, in the large Super-K sample one does expect approximately 85 charged current interactions. The events have many final state particles above Cherenkov threshold making exclusive reconstruction difficult, but a statistical analysis is possible. One preliminary analysis uses a neural network to select for characteristics of high pion production, based on event variables such as number of rings, number of ring seeds, number-of-decay electrons, particle classification of the brightest ring, and so on.
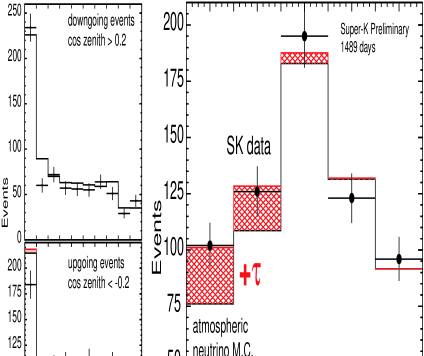
For less than a few times , it is expected that charged current tau appearance will only occur in the upward-going zenith bins. Therefore, the analysis is based on the up-down ratio of a sample selected for enhanced tau production, and the downward-going data may be used to check the performance of the neural network, as shown on the left of Fig. 8. This analysis has a 55% efficiency to save interactions in the fiducial volume while keeping 4.5% of the background. After cuts, a fit is done to the zenith angle distribution with components for both the background and the expected tau appearance signal. The data and fit results are shown on the right of Fig. 8. The best fit implies that the number of charged current interactions was: . The first systematic error comes from varying the assumed between 1 and 5 and the second comes from allowing three flavor oscillation at the CHOOZ limit. Although this is only a 2.3 result, it shows that the Super-K data set is consistent with the expected rate of tau appearance.
6 Super-Kamiokande Accident and Reconstruction
On Nov 12, 2001 at 11:01 JST, a single photomultiplier on the bottom of the Super-Kamiokande tank imploded. At that time, the tank was 2/3 full of water; it was refilling after PMT replacement work in the preceding summer. The imploding tube caused a chain reaction that destroyed 6777 inner PMTs and 1100 outer PMTs. Subsequently, the collaboration made several studies to determine the mechanism of the chain reaction. A corrective measure was devised: the PMTs should be encased in a secondary shell consisting of a transparent acrylic hemisphere over the photocathode and a fiberglass shell surrounding the rest of the tube. This enclosure is not intended to withstand static water pressure; instead, several small holes are placed in the shell. Then, if a PMT were to implode, water rushes into the resulting vacancy more slowly and a high pressure shock wave is not developed. This has been tested several times in situ up to the full level of the Super-K tank. The tests show that if the center tube of a grid of tubes is imploded, the damage is contained within the protective vessel, and the eight surrounding tubes do not implode – even if they themselves are unprotected.
It will take several years to fabricate replacement photomultipliers for the inner detector. In the meantime, the detector is being recommissioned using the remaining tubes plus some spares to populate every other lattice point of the original photomultiplier tube array. This will be sufficient for nearly all research to continue, particularly the K2K long baseline experiment. The detector should be operational by the end of 2002.
7 Acknowledgements
I would like to thank the organizers of the Heavy Quarks and Leptons Workshop, particularly G. Cataldi. I am also thankful for assistance with the latest experimental results from M. Shiozawa, M. Goodman, and M. Spurio. Finally, I gratefully acknowledge support from the U.S. Department of Energy.
References
- 1 . T.K. Gaisser and M. Honda, submitted to Ann.Rev.Nucl.Part.Sci. hep-ph/0203272
- 2 . T. Sanuki et al., Astrophys. J 533, 1135 (2000).
- 3 . J. Alcarez et al.. Phys. Lett. B490, 27 (2000).
-
4 .
M. Honda et al., Phys. Rev. D52, 4985 (1995);
M. Honda et al., Phys. Lett. B248, 193 (1990).
V. Agrawal et al., Phys. Rev. D53, 1314 (1996); T.K. Gaisser and T. Stanev, Proc. 24th Int. Cosmic Ray Conf., Rome, Vol. 1, 694 (1995); G. Barr et al., Phys. Rev. D39, 3532 (1989). -
5 .
G. Battistoni et al., Astropart. Phys. 12 315, (2000);
P. Lipari, Astropart. Phys. 14 153, (2000);
M. Honda et al., Phys. Rev. D64 053011, (2001);
Y. Tserkovnyak et al., Proc. 27th Intl. Cosmic Ray Conf. 3 1218, (2001); - 6 . Y. Fukuda et al., Phys. Rev. Lett. 81, 1562 (1998).
- 7 . M. Shiozawa, for the Super-Kamiokande collaboration, presentation at XXth Int. Conf. on Neutrino Physics and Astrophysics, Munich, (2002).
- 8 . M. Aglietta et al., Europhys. Lett. 8 6111, (1989).
- 9 . K. Daum et al., Z. Phys. C66, 417 (1995).
-
10 .
W.W.M. Allison et al.,
Phys. Lett. B449, 137 (1999);
M. Sanchez, Int. J. Mod. Phys. A16S1B, 727 (2001);
ibid, poster at XXth Int. Conf. on Neutrino Physics and Astrophysics, Munich, (2002). http://neutrino2002.ph.tum.de/pages/posters/B02.html -
11 .
M. Ambrosio et al.,
Phys. Lett. B434, 451 (1998);
M. Spurio, poster at XXth Int. Conf. on Neutrino Physics and Astrophysics, Munich, (2002). http://neutrino2002.ph.tum.de/pages/posters/B02.html - 12 . M. Ambrosio et al., physics/0203018.
- 13 . M. Ambrosio et al., Phys. Lett. B112, 5 (2000).
- 14 . K. Nishikawa, for the K2K collaboration, presentation at XXth Int. Conf. on Neutrino Physics and Astrophysics, Munich, (2002).
- 15 . V. Barger et al., Phys. Lett. B462, 109 (1999).
- 16 . S.L. Glashow et al., Phys. Rev. D56, 2433 (1997); G.L. Fogli et al., Phys. Rev. D60, 053006 (1999); N. Fornengo et al., Phys. Rev. D65, 013010 (2002).
- 17 . E. Lisi, A. Marrone, and D. Montanino, Phys. Rev. Lett. 85, 1166 (2000).
- 18 . G.L. Fogli, E. Lisi, and A. Marrone, Phys. Rev. D63, 053008 (2001).
- 19 . M. Apollonio et al., Phys. Rev. D61, 012001 (2000).