RESULTS ON FROM THE B FACTORIES
Abstract
The status of CP violation in and the determination of from the factories is described.
1 Introduction
In 1973 Kobayashi and Maskawa (KM) proposed a model where violation is incorporated as an irreducible complex phase in the weak-interaction quark mixing matrix [1]. Recent measurements of the -violating parameter by the Belle [2] and BaBar [3] collaborations have clearly established violation in the neutral meson system that is consistent with KM expectations. The next step in the program is measurements of other -violating parameters. Here we describe recent measurements of -violating asymmetries in the mode ; these are sensitive to the parameter (also known as ).
2 Experimental Challenges
To measure (a.k.a ), the two most promising approaches involve the use of the decay modes and . The former is an example of a CP eigenstate and is thus the most straightforward approach as well as the mode with the best senstivity. The interference in the mode between the direct decay and the decay via mixing leads to a CP violating asymmetry with a sin-like time modulation as in charmonium CP eigenstate modes such as .
The KM model predicts sizeable -violating asymmetries in the time-dependent rates for and decays to a common eigenstate, . In the decay chain , where one of mesons decays at time to and the other decays at time to a final state that distinguishes between and , the decay rate has a time dependence given by
| (1) |
where is the lifetime, is the mass difference between the two mass eigenstates, = , and the -flavor charge = +1 () when the tagging meson is a (). The -violating parameters, and , defined in Eq. (2) can be expressed by in terms of the complex parameter that depends on both mixing and on the amplitudes for and decay to [4]. In the Standard Model, to a good approximation, is equal to the absolute value of the ratio of the to decay amplitudes.
The experimental technique is similar to that used for the measurement [6]. However, there are several additional complications and differences. The decay amplitude for contains a contribution from a tree diagram () as well as a Cabibbo suppressed penguin diagram (). The penguin contribution is not negligible and has a weak phase that is different from the phase of the larger tree amplitude, which is zero in the usual parameterization. In general, the penguin contribution will also have a strong phase. Therefore the time dependent asymmetry, proportional to and parameterized by , which is measured is not equal to but instead will have a large unknown correction. The presence of the extra contribution also induces an additional time dependent term proportional to , parameterized by [5]. This is called penguin pollution. As the notation suggests, the asymmetry term with modulation is due to direct CP violation. Note that unlike the mixing induced CP violation, the direct CP violation term does not time integrate to zero.
There are a number of other purely experimental complications. The branching fraction for the decay is quite small (see Table 1) compared to the charmonium modes, only . Thus, very large data samples are required. The BaBar results are based on a sample of pairs. Belle has recorded a sample of comparable size, but has published results with a subset of pairs.
The other challenging requirement for the detector is the separation of kaons from pions at high momentum. This is needed to distinguish from , which has similar kinematics and a branching fraction about three times larger. Two approaches to high momentum particle identification have been implemented at the factory experiments. Both are based on the use of Cerenkov radiation.
At Belle, aerogel Cerenkov radiators are used. Blocks of aerogel are readout by fine-mesh phototubes that have high-gain and operate comfortably in a 1.5 Tesla magnetic field. Since the threshold for the aerogel is around 1.5 GeV, below this momentum K/ separation is carried out using high precision time-of-flight scintillators with resolution of 95 ps. The aerogel and TOF counter system are complemented by dE/dx measurements in the central drift chamber. The dE/dx system provides additional K/ separation around 2.5 GeV in the relativistic rise region as well as below 0.7 GeV. For high momentum kaons, an efficiency of 88% with a misidentification probability below 9% has been achieved.
At BaBar, Cerenkov light is produced in quartz bars and then transmitted by total internal reflection outside the detector through a water tank to a large array of phototubes where the ring is imaged. The detector is referred to by the acronym DIRC. It provides separation that ranges from at 2 GeV to at 4 GeV.
| BaBar | Belle | CLEO | |
|---|---|---|---|
Hoewever, even after the application of high momentum particle identification, the CP eigenstate signal sits on a very large continuum background from () processes. Several analysis techniques to reduce this background have been developed.
BaBar uses a selection on the angle between the sphericity axis of the candidate and the sphericity axis of the rest of the event (denoted ). The cosine of this angle is uniformly distributed for the B signal and is concentrated at for continuum background. After requiring that , they form a Fisher discriminant, , from the energies in nine cones of increasing angular aperture opposite the candidate. No cut is applied, instead is used a variable to distinguish signal from continuum in their fit. This technique was originally developed by CLEO.
Belle uses a likelihood based technique in order to suppress continuum background. Signal and background likelihood functions, and , are formed from two variables. One is a Fisher discriminant determined from six modified Fox-Wolfram moments [7]; the other is the flight direction in the cms, with respect to the axis (). The signal likelihood is determined from Monte Carlo (MC) and from data, and is required for candidate events.


The signal to continuum background ratio is a strong function of the tagging method; this effect must be taken into account in the CP extraction. There is also still some residual background from misidentified as well, although this background is reasonably well separated by the kinematic variable .
After flavor tagging and vertexing requirements are applied, a likelihood fit is applied to extract the two CP violation parameters. At Belle, an unbinned fit to the distribution of 162 candidates in the signal region is applied. The signal of events is shown in Fig. 1. The signal to background fraction is a function of tagging purity and divided into six bins. The only free parameters in the Belle fit are and . At BaBar, a more complex fit to , , (the event shape Fisher discriminant), Cerenkov angles , , and is performed for a sample of 26070 events of which are signal events. A signal enhanced distribution is shown for a sub-sample in Fig. 2. The fit has a total of 76 parameters. These include the values of and (2); signal and background yields (5); charge asymmetries (2); signal and background tagging efficiencies (16) and efficiency asymmetries (16); signal mistag fraction and mistag fraction differences (8); signal resolution function (9); and parameterization of background shapes in (5), (2), (5) and (6). This somewhat more complex approach has good statistical reach. However, the background must be accurately parameterized since events with rather poor signal to background ratios (O(1/10)) are used.
To validate the analysis, a variety of consistency checks are performed. For example, both BaBar and Belle measure the lifetime and mixing frequency in the sample. They find results consistent with the world averages. A variety of control samples are also examined. For instance, Belle takes events, adds additional background from the sidebands to degrade the signal to background ratio to the level of the signal, and then performs the CP fit. They find and . No artificial CP asymmetries are found in any of the control samples that have been studied.
3 Results
The observed flavor tagged and asymmetry distributions in BaBar data with cuts to enhance the signal fraction are shown in Fig.3. No sin-like modulation is observed in the asymmetry distribution while there is a slight hint of a cos-like term. For the CP parameters, , BaBar obtains
| (2) | |||
| (3) |
From these results, BaBar obtains 90% confidence level intervals for of and for of .
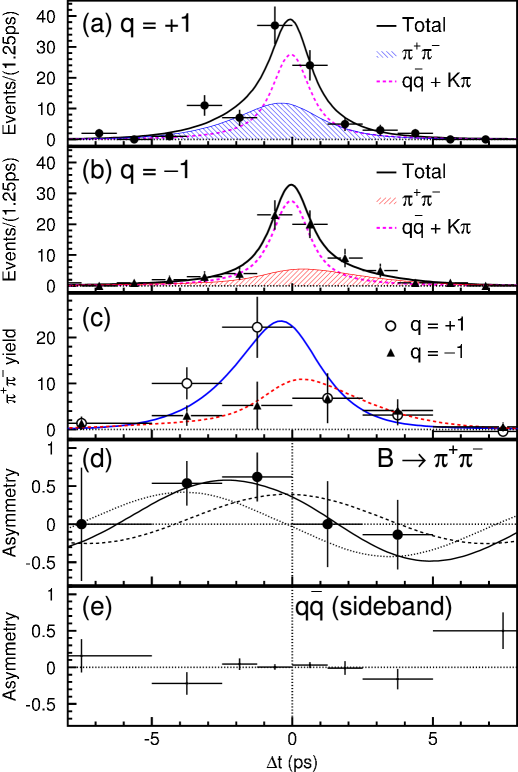
The Belle distributions before and after background subtractions are shown in Fig. 4. The difference in the height of the and tags in Fig. 4(c) is an indication of direct CP violation. The blue and red curves for and tags are also asymmetric in time. The asymmetry distribution in Fig. 4(d) suggests the presence of sin-like as well as cos-like modulations. In contrast to BaBar, Belle finds
| (4) | |||
| (5) |
Each of these two measurements is only from zero, which is not yet statistically overwhelming.
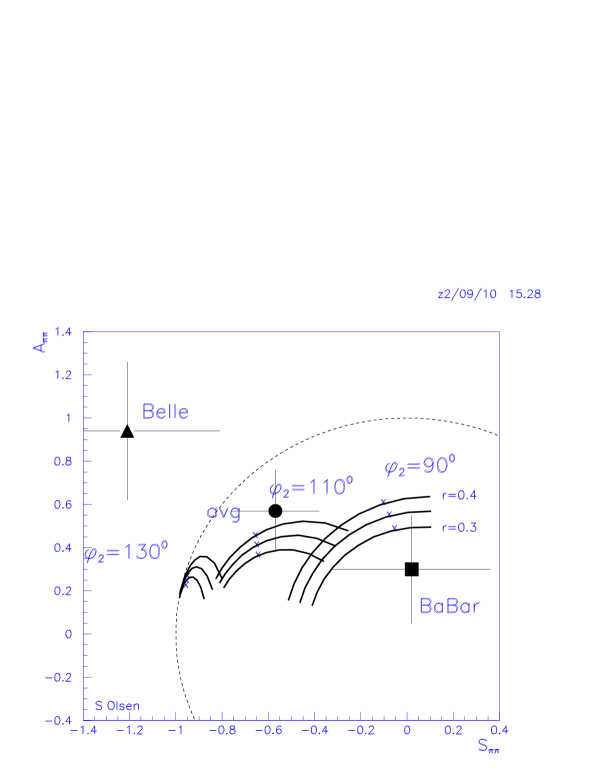
The two sets of results give somewhat different pictures of the physics. The results are statistically marginally consistent. Nevertheless we can try to assess the physics content of the results. The two measurements and their weighted average are shown in the space of and in Fig. 5. This figure also shows the physical boundary . The Belle measurement is 1.3 from the physical boundary, consistent with a statistical fluctuation. The curves in Fig. 5 correspond to different values of and to , the ratio of tree to penguin amplitudes. A given theoretical curve corresponds to the range of possible FSI phases. The ratio r is determined from data on , and [11].

4 Discussion and related modes
Gronau and London showed that it is possible to use isospin invariance and measurements of the flavor tagged branching fractions of all branching fractions to disentangle the effects of penguin pollution in time dependent measurements of asymmetries in and determine [10].
As shown in Table 1, all the decay modes except for have now been measured by Belle and Babar and are in good agreement with CLEO. Both -factory experiments have also searched for . With 29 Belle finds a 2.4 hint of a signal and sets an upper limit at 90% confidence level of . Babar uses their full dataset and also finds a modest excess. They set an upper limit of at the 90% confidence level. It is possible that the excesses seen will become signals with much larger data samples and that the branching fraction is of order .
It is also possible to determine ratios of partial widths of the modes and from the measured yields. Belle finds the ratio of widths
| (6) |
The factor of two in the denominator accounts for the wavefunction. A comparable ratio of is obtained from BaBar data. The deviation of this ratio from unity indicates either some kind of interference in or final state rescattering or the contribution of other diagrams. This is an important clue to understanding the system.
5 Conclusion
Although the samples of events are still relatively small and the continuum backgrounds are large, the first round of measurements and attempts to determine using the mode have been reported[8],[9]. Unlike the case of charmonium modes, the two experiments do not agree well. With 88 million pairs, BaBar finds no evidence for indirect CP violation and a direct CP violation parameter consistent with zero. By contrast, with 45 million pairs, Belle finds indications for both indirect and direct CP violation in the system. Belle plans to update their result with an additional 36 fb-1 ( pairs) in the near future. However, to fully resolve this discrepancy and precisely determine , much more data will be needed.
6 Acknowledgements
I wish to acknowledge the essential contributions of my colleagues on Belle, BaBar, KEK-B and PEP-II to the work described here. I also thank the organizers for a well run conference and especially Su Dong for his patience.
References
- [1] M. Kobayashi and T. Maskawa, Prog. Theor. Phys. 49, 652 (1973).
- [2] K. Abe et al. (Belle Collaboration), hep-ex/0208025 to appear in Phys. Rev. D; K. Abe et al. (Belle Collaboration), Phys. Rev. D 66, 032007 (2002); K. Abe et al. (Belle Collaboration), Phys. Rev. Lett 87 091802 (2001).
- [3] B. Aubert et al. (BaBar Collaboration), hep-ex/0207042; B. Aubert et al. (BaBar Collaboration), Phys. Rev. D 66, 032003 (2002); B. Aubert et al. (BaBar Collaboration), Phys. Rev. Lett. 87, 091801 (2001).
- [4] The observables and can be related to : and .
- [5] In BaBar papers a slightly different pair of observables are used: and , where .
- [6] Y. Pan, contribution to these proceedings.
- [7] The Fox-Wolfram moments were introduced in G. C. Fox and S. Wolfram, Phys. Rev. Lett. 41, 1581 (1978). The Fisher discriminant used by Belle is described in K. Abe et al. (Belle Collab.), Phys. Lett. B 511, 151 (2001).
- [8] B. Aubert et al. (BaBar Collaboration), hep-ex/0207055; B. Aubert et al. (BaBar Collaboration), Phys. Rev. D 65, 051502 (2002).
- [9] K. Abe et al. (Belle Collaboration), Phys. Rev. Lett. 89, 071801 (2002).
- [10] M. Gronau and D. London, Phys. Rev. Lett. 65, 2381 (1990).
- [11] M. Gronau and J.L. Rosner, Phys. Rev. D. 65, 093012 (2002).
- [12] B. Aubert et al. (BaBar Collaboration), hep-ex/0207065; The result for was taken from hep-ex/0206053.
- [13] B.C.K. Casey et al. (Belle Collaboration), hep-ex/0207090, to appear in Phys. Rev. D.
- [14] S. Chen et al. (CLEO Collaboration), Phys. Rev. Lett. 85, 525 (2000).