KTeV Results: and Rare Decay Results
The KTeV physics program encompasses many goals including a precision measurement of the direct CP violation parameter in decays, and studies of rare neutral kaon decays. The KTeV detector collected data during the Fermilab fixed-targed runs of 1996-97 and 1999. This article focuses on the precision measurement of the direct CP violation parameter using the 1996-97 data set. In addition, measurements of the neutral kaon parameters , , , from that data set and a new measurement of the branching fraction of from the 1997 and 1999 data also are presented.
1 Introduction
CP violation in the system comes mainly from a small () asymmetry between the transition rates of and , which is referred to as indirect CP violation. Direct CP violation is 3 orders of magnitude smaller and is CP violation in the decay amplitude itself. Experimentally, direct CP violation can be determined by comparing decay rates for and in the following double ratio
| (1) |
where refers to the parameter that governs indirect CP violation, and is the parameter that indicates the strength of direct CP violation. The double ratio allows for many systematic uncertainties in the measurement to cancel. The KTeV experiment was designed to make a precise determination of . KTeV can also measure the lifetime (), mass difference (), the phase of (), and the phase difference between and ().
In addition to being optimized for the detection of decays, the experiment is ideally suited for the detection of rare kaon decays such as and , where is either an electron or a muon. These decays are of interest because they can provide insight into the long distance contributions to the decay , which is sensitive to the CKM parameter .

The KTeV detector is shown in Fig. 1. The experiment features a 65m vacuum decay region followed by a large aperture charged spectrometer, consisting of 4 planar drift chambers, two on either side of a dipole magnet. Downstream is a 2m-by-2m calorimeter comprised of 3100 pure CsI crystals. Behind the calorimeter is 10cm of Pb, 5m of steel and a set of muon identification counters. Photon veto detectors surround the vacuum decay region, the perimeter of the drift chambers, and the CsI. During run periods, an additional upstream photon veto detector (Mask-Anti) and an active regenerator are used; the regenerator alternates beam positions once per minute to cancel possible left/right detector and beam asymmetries. A set of 8 transition radiation detectors (TRD) are placed in front of the CsI during rare decay running for improved identification. The charged spectrometer achieves a hit resolution of better than m, while the CsI calorimeter gets better than energy resolution over the energy range of interest.
The KTeV experiment took data for the measurement and for rare decays during 1996-97 and 1999. Between the two running periods, the detector was upgraded to improve its reliability and live time. During the data collecting, the transverse momentum kick of the analysis magnet was 410 MeV/c. The momentum kick for rare decay run periods was reduced from 205 MeV/c in 1997 to 150 MeV/c in 1999 to increase the acceptance for higher multiplicity modes. During 1996-97 data taking, KTeV collected events, which is the statistics limiting mode for the measurement. This paper presents results from the 1996-97 data set . For rare decay running, there were and decays during 1997 and 1999, respectively. In the case of the analysis, where published results are now available, numbers have been updated from those presented at the conference.
2 Measurements of and the Kaon Parameters
The measurement requires a source of and decays. The regenerator produces a coherent state; in KTeV, the regeneration amplitude, , is (at 70 GeV/c) and is momentum dependent. The measured quantities for the double ratio in Eq. 1 are extracted with a fitting program, where the interference in the regenerator beam is accounted for. The fitting for is performed in 10 GeV/c kaon momentum bins and a single, integrated z bin from 110m to 158m. The binning reduces the sensitivity to the momentum dependence of the detector acceptance and allows the momentum dependence of the regeneration amplitude, , to be accounted for in the fit.
Because the and events have very different lifetimes and produce distinctly different decay distributions in the detector, a key to making the measurement is understanding the acceptance. A detailed Monte Carlo simulation has been developed to understand the acceptance correction to the measurement. The acceptance correction shifts by ; of this correction is the result of detector geometry that is known precisely from surveys and from measurements in the data, while the remaining correction depends on details of the detector response and resolutions.
An important test of the acceptance is to compare distributions of the reconstructed Z-vertex positions in data and Monte Carlo. The charged and neutral samples are studied as well as the high statistics and modes. Fig 2 shows the data/Monte Carlo ratio for and decays along with the results to the linear fit.

A “z-slope” is measured in the events while the mode is consistent with zero slope. This translates to a uncertainty in and is the largest contribution to the systematic uncertainty from charged mode decays. No significant “z-slopes” are measured for the neutral mode samples, resulting in a systematic uncertainty in due to the z-dependence of the acceptance of .
The largest contribution to the systematic uncertainty on comes from the understanding of the neutral energy scale. The neutral mode energy calibration is determined using electrons from decays. The final energy scale adjustment is achieved by matching the downstream regenerator edge in data and MC for decays. The regenerator edge shift is determined in kaon energy bins. On average, the data edge is shifted upstream by 5 cm relative to the MC, corresponding to a 0.1% correction on the energy scale. A series of other decay modes are used to check the energy scale at other z positions (See Fig 3 (a)).

The uncertainty in due to the neutral energy scale is determined by introducing an energy scale distortion to data such that data and MC z-vertex distributions are made to match at both the downstream regenerator (fixed by construction) and the vacuum-window edges. This distortion introduces a shift to of and to 1996 and 1997 data sets, respectively, and results in a systematic uncertainty of . Additional contributions from energy non-linearities and reconstructed cluster position discrepancies lead to an overall systematic uncertainty on from neutral energy reconstruction of .
Table 1 summarizes the dominant contributions to the uncertainty of .
| Source | Contribution to uncertainty |
|---|---|
| on | |
| Neutral Energy Reconstruction | 1.47 |
| Neutral background from regenerator-scatters | 1.07 |
| Charged mode acceptance (data/MC z-slope) | 0.79 |
| Charged Level 3 online filter | 0.58 |
The combined result for for the 1996-97 data sets is
| (2) |
A crosscheck of the standard analysis was performed using a reweighting method that does not depend on a Monte Carlo acceptance correction. aaaThis technique is similar to the NA48 experimental method . The difference between the reweighting and standard results is , where the errors presented are the uncorrelated uncertainties. There is good agreement between the two analyses, although the statistical uncertainty of the reweighting analysis is a factor of 1.7 larger than the standard analysis because vacuum beam events are “lost” in the reweighting. In addition, the uncorrelated systematic uncertainties between the two methods are somewhat large, dominated by a sensitivity to low energy clusters in the reweighting analysis.
The regenerator beam decay distribution allows for measurements of the kaon parameters , , and . The parameters are measured by fitting the shape of the z decay distribution in the regenerator beam in 2m z-bins from 124-158m using the flux determined from the vacuum beam. The results are listed in Table 2.
| Measurement | Results |
|---|---|
3 The Decay
The decay provides the cleanest method for studying the vertex, which is useful for determining the long distance contributions to the decay. But because of its extremely small branching ratio , it is difficult to collect a sample large enough to probe the form factor. The combined KTeV 1997 and 1999 rare decay running periods yielded 132 events (see Fig. 4), corresponding to a
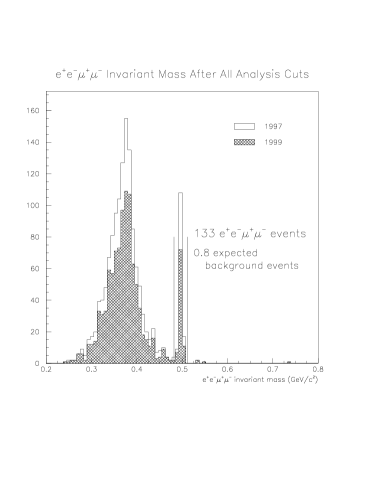
preliminary branching ratio measurement of BR() = .
Although the sample contains enough events to study the form factor by fitting the and mass distributions (See Fig. 5), the resulting uncertainties are expected to be larger than with other modes .

The decays are being analyzed to determine the form factors from the Bergstrom, Masso and Singer (BMS) model and from the D’Ambrosio, Isidori, and Pertoles (DIP) model . Because of the limited statistics, it is doubtful that a measurement of the DIP parameter will be possible.
4 Conclusions
KTeV has made a precision measurement of the direct CP violation parameter of . The status of the current measurements is summarized in Fig 6.

The current precision of the world average of measurements is better than 10%. These measurements firmly establish direct CP violation at the level. KTeV has also made precision measurements of the kaon parameters , , and using their 1996-97 data set. Analysis of the KTeV 1999 data set is ongoing. Inclusion of the 1999 data set will double the statistics of the 1996-97 result. Improvements in the neutral energy reconstruction are expected to reduce the systematic error.
In addition to the program, KTeV has made a significant contribution to the understanding of rare kaon decays. Decays that were once considered “rare” , such as with a branching ratio of , are now represented by data samples of events. In the case of the decay , the combined 1997 and 1999 data sets have yielded events, allowing for detailed studies of the form factor. With statistically large samples such as these, precision rare decay measurements are achievable.
Acknowledgments
The author would like to thank Elliott Cheu and Ed Blucher for their contributions to this paper.
References
References
- [1] A. Alavi-Harati, et al. (KTeV), “Measurement of Direct CP Violation, CPT Symmetry, and Other Parameters in the Neutral Kaon System,” submitted to Phys. Rev. D, hep-ex/0208007.
- [2] A. Lai, et al., (NA48), Eur. Phys. J. C 22, 231 (2001), hep-ex/0110019.
- [3] P. Gu, et al. (E731), Phys. Rev. Lett. 76, 4312 (1996).
- [4] A. Alavi-Harati, et al. (KTeV), Phys. Rev. Lett. 87, 111802 (2001), hep-ex/0108037.
- [5] J. Hamm, Ph. D. thesis, (2002).
- [6] A. Alavi-Harati, et al. (KTeV), Phys. Rev. Lett. 87, 71801 (2001).
- [7] A. Alavi-Harati, et al. (KTeV), Phys. Rev. Lett. 86, 5425 (2001), hep-ex/0104043.
- [8] L. Bergstrom, et al., Phys. Lett. B 131, 229 (1983).
- [9] G. D’Ambrosio, et al., Phys. Lett. B 423, 385 (1998).
- [10] L. Gibbons, et al., (E731), Phys. Rev. Lett. 70, 1203 (1993).
- [11] G. D. Barr, et al., (NA31), Phys. Lett. B 317, 233 (1193).