MEASUREMENT OF B MIXING FREQUENCY AND CP VIOLATION PARAMETER () AT B FACTORY EXPERIMENTS
Abstract
Recent results on B mixing and CP violation from the B-factory experiments, BABAR at PEP-II and Belle at KEK-B, are summarized. A discussion of CP violation is then presented which concentrates on the CP parameter (also known as ). The most recent measurements of this parameter from B-factory data yield
These two B-factory results contribute to the current world average of
1 Introduction
In the Standard Model, CP violation is made possible by an irreducible complex phase in the three-generation Cabibbo-Kobayashi-Maskawa(CKM) quark-mixing matrix [1]. CP violation is expected if this complex phase is non-zero. The unitarity of the CKM matrix results in six triangles of equal area in the complex plane (Unitarity Triangles). A non-zero area implies the existence of a CP-violating phase – in other words, if the inner angles of these Unitary Triangles are found to be non-zero, CP-violation is observed. For the neutral B-meson system, the angles in question are , and 111BaBar uses notation {} and Belle uses notation {} to address same three CP angles. In this paper, BABAR notation is used except for description of Belle-specific results. and are defined by the condition
| (1) |
In particular, the measurement of the angle , defined as
| (2) |
is the main focus of this paper.
Observation of CP violation in neutral decays222Charge-conjugation is implied throughout this document. through the measurement of was reported in summer 2001 by both the BABAR [2] and Belle [3] collaborations employing data luminosities of 29.7 and 29.1 , respectively. By summer 2002, each experiment’s total accumulated luminosity had almost tripled. The more precise results presented in this paper are based on the full samples obtained for summer 2002: 81 (88 million decays) for BABAR and 78 (85 million decays) for Belle.
2 B-Factory Experiments: BABAR and Belle
The BABAR and Belle B-factory experiments share similar design concepts. Both experiments center around a high luminosity asymmetric electron-positron collider operating at the resonance. Each experiment also depends on a high-precision detector designed specifically for high-rate, Lorentz-boosted production. The PEP-II collider (BABAR) counter-circulates an electron beam of 9.0 GeV against a positron beam of 3.1 GeV, resulting in a center-of-mass boost of = 0.55. The KEKB collider (Belle) collides electrons and positrons at 8.0 GeV and 3.5 GeV, respectively, resulting in a boost of = 0.425. B-mesons produced at each collider are boosted along the direction because of the asymmetric energies, allowing for the measurement of the decay-time difference of the two Bs.
The primary sub-detectors of BABAR include a drift chamber (DCH) and a silicon vertex tracker (SVT), both operating inside a 1.5 T magnetic field provided by a super-conducting solenoid. Surrounding the tracking volume is a detector of internally reflected Čerenkov radiation (DIRC), an electromagnetic calorimeter (EMC) and an instrumented flux return (IFR).
The Belle apparatus consists of a silicon vertex detector (SVD), a central drift chamber (CDC), an array of aerogel threshold Čerenkov counters (ACC), time-of-flight scintillation counters (TOF), and an electromagnetic calorimeter (ECL) located inside a super-conducting solenoid coil that provides a 1.5 T magnetic field. An iron flux-return located outside of the coil is instrumented to detect mesons and to identify muons (KLM).
3 Overview Of Measurement Technique
3.1 Production of
As a consequence of Bose-Einstein statistics, the pairs produced from the decays remain in a coherent P-wave state until one of the two B-mesons decays. At the moment of the first decay (), the two B-mesons are in opposite flavor states – knowing the flavor state of one B implies knowledge of the other. Between the first decay and its own decay, the second B-meson’s flavor evolves according to a time-dependent oscillatory pattern. If the flavor of one B is known when it decays then the flavor state of the other B at its decay point is solely determined by the proper time between decays () and mixing frequency .
3.2 Exclusive Reconstruction of One B-Meson
Given the large number of B-mesons produced at B-Factories, it is conceivable to exclusively reconstruct one of the two B-mesons into a known decay mode. Excluding from consideration the decay products of this reconstructed B (), the remaining particles in the event then presumably belong to the “other B”. Often, the flavor of this “other B” can be determined through an inclusive flavor tagging method (B Flavor-Tagging). For this reason, this inclusively “reconstructed” second B-meson is commonly referred as the (). The and can be individually vertexed, and the distance between the two vertices used to determine the proper-time difference .
The choice of exclusive decay modes is determined according to physics objectives. For a B-mixing measurement, the has to decay into one of the (self-tagged) flavor eigenstates. The mixing frequency is determined by comparing the flavor of the and (both known) in a time-dependent way. For CP measurements, ’s are required to be reconstructed in a CP eigenstate, such as , etc.
3.3 Decay Time Interval
In asymmetric production, as at BABAR and Belle, the large boost causes the mesons to fly preferentially along the beam direction (conventionally the z-axis). Accordingly, the time interval between the two decays is calculated, to a good approximation, as
| (3) |
where is the distance between the decay vertices of and along the z-axis. The vertex is determined by using the charged tracks from its exclusive decay products; intermediate vertices, such as those from decay, are also reconstructed. The vertex is obtained by an inclusive fit on charged tracks which do not belong to the exclusive . Constraints from the beam spot locations and momentum are applied when fitting for .
The resolution is affected by the detector resolution for both the and vertices, by a shift on the vertex due to secondary charmed decays, and by kinematic smearing due to the fact that the flight is not exactly in the z-direction. Accordingly, an empirical resolution function is used to model these effects. In both experiments, the parameters in the resolution functions are determined in data from fits to the neutral and charged meson lifetime. An average r.m.s. resolution is 1.1ps for BABAR and 1.43ps for Belle, both obtained from data.
3.4 Flavor Tagging
The flavor of the is determined through various flavor signatures among its daughter tracks. High momentum (primary) leptons, kaons and soft pions from decay are primary sources for flavor tagging. In addition, baryons and lower momentum (secondary) leptons can also be used to assist tagging. To obtain optimal tagging efficiency, both experiments use multivariate algorithms to combine various sources of flavor information in an event. Similar events, judged by their physics content or estimated tagging purity, are usually grouped into tagging categories to aid in the study of tagging-based systematic errors.
The figure of merit for B flavor-tagging is the effective tagging efficiency,
| (4) |
where sums over tagging categories. Since the measurement error and tagging efficiency are related (), a higher effective tagging efficiency reduces measurement error.
At BABAR, events are grouped into four hierarchical, mutually exclusive tagging categories based on their physics contents. The category contains events with an identified high momentum lepton. Events with a kaon are assigned to either the or category. Among the two, the category contains events with higher estimated tagging probability, contributed by additional tagging sources such as a soft pion compatible with decay. The category also contains remaining events with a soft pion. All other events are assigned to the category except for those that have no useful tagging information (which are excluded from further analysis). A set of neural networks have been developed to classify events and to provide estimated mistag probability. The efficiency and mistag probability for each of the four tagging categories can be obtained from data as shown in table 1. Based on these measured efficiencies and mistag probability, the effective tagging efficiency() is calculated to be .
| Category | (%) | (%) | (%) | (%) |
|---|---|---|---|---|
| Lepton | ||||
| Kaon I | ||||
| Kaon II | ||||
| Inclusive | ||||
| All |
At Belle, events are instead grouped into tagging categories based solely on estimated tagging probability. A quantity is assigned to each event. An value of zero signifies no tagging power and an value of 1 means perfect tagging. Events are sorted into six intervals of between 0 and 1, according to flavor purity. The event fraction and mistag probability for each category are determined directly from data as summarized in table 2. The corresponding value for Belle is , similar to that of BABAR’s.
| 1 | 0.000 0.250 | 0.399 | |
| 2 | 0.250 0.500 | 0.146 | |
| 3 | 0.500 0.625 | 0.104 | |
| 4 | 0.625 0.750 | 0.122 | |
| 5 | 0.750 0.875 | 0.094 | |
| 6 | 0.875 1.000 | 0.137 |
4 Measurement Of Oscillation Frequency
To measure the mixing parameter , the flavors of both the and need to be determined. The mixing frequency is extracted from the time evolution of opposite-flavor (“unmixed”) and same-flavor (“mixed”) B-decays. The physics probability density function (PDF), before accounting for detector and background effects, is:
| (5) |
where is the lifetime, and “” denotes “” for unmixed events and “” for mixed events.
Samples that can be used for the mixing measurement include:
-
1.
“Fully Hadronic”, where is completely reconstructed to the exclusive hadronic decays (where ), .
-
2.
“Semileptonic”, where is reconstructed to .
-
3.
“Partial ”, where is partially reconstructed to ().
-
4.
“Dilepton”, where instead of attempting to reconstruct one of the B decays, events with two high momentum leptons are used.
For the first three samples above, the flavor of the is determined by the charge of its daughters and the flavor of the is provided by flavor tagging. The time-difference is determined using the and vertices. For dilepton samples, the charges of the two leptons (which are presumed to be from semileptonic B decays) indicate the flavor of the B-mesons. Proper-time information is obtained using the impact parameters of the two leptons.
BaBar has reported results from three measurements [7]:
-
•
(“Hadronic” , 30 )
-
•
(“Semileptonic”, 21 )
-
•
(“Dilepton”, 21 )
Belle has reported results from four measurements [8]:
-
•
(“Hadronic”, 29 )
-
•
(“Semileptonic”, 29 )
-
•
(“Partial ” , 29 )
-
•
(“Dilepton”, 29 )
Combining BABAR and Belle results yields , as compared with combined non B-factory results (LEP+SLD+CDF).
If all results are combined, a world average value of is obtained.
5 CP Violation Measurement With Charmonium Final States
For the measurement of CP asymmetries, the needs to be reconstructed in a CP eigenstate () with eigenvalue or . For events where = and the flavor of is known to be , the decay rate is given by
| (6) |
where is a complex parameter that depends on both the - oscillation amplitude and the amplitudes describing and decays to a common final state. violation arises if is not unity. In other words, violation is manifested with a non vanishing sine or cosine term in the equation. Experimentally, violation can be observed as a difference between the distributions of - and -tagged events or as an asymmetry with respect to for either flavor tag.
Among many possible CP modes, (charmonium) decays offer the best opportunity for CP violation measurement [9]. These modes include the CP-odd () final states , , , and , and CP-even () state . In addition, a CP-mixed state , where decays to , can also be used after its CP composition is measured through an angular analysis. For this CP-mixed decay, BABAR and Belle find the CP-odd fraction to be and , respectively. This fraction can be used to compute an effective () for use in the CP extraction.
| Sample | |||
|---|---|---|---|
| ,,, | |||
| () | |||
| () | |||
| () | |||
| Lepton category | |||
| Kaon I category | |||
| Kaon II category | |||
| Inclusive category | |||
| tags | |||
| tags | |||
| sample | |||
| charged sample | |||
| Full sample |
| Sample | Purity | |||
| 1285 | 1116 | 0.98 | ||
| 188 | 162 | 0.82 | ||
| 91 | 76 | 0.96 | ||
| 112 | 96 | 0.91 | ||
| 77 | 67 | 0.96 | ||
| 72 | 63 | 0.65 | ||
| 49 | 44 | 0.72 | ||
| 21 | 15 | 0.94 | ||
| 101 | 89 | 0.92 | ||
| 1330 | 1230 | 0.63 | ||
| All CP Sample | 3326 | 2958 | 0.81 |
In the Standard Model, is expected to be (, ) for these charmonium decays. Thus, a measurement with the time dependent decay rates in equation 6 directly reveals the CP parameter with little ambiguity.
Both BABAR and Belle reconstruct these charmonium modes for use in their measurements [12, 13]. Yields on each signal mode are summarized in table 3 for BaBar 333Only events with a flavor tag are included, total Tagging efficiency is . and in table 4 for Belle. Shown also in these two tables are measured () value for each sub-sample (see text below).
After the flavor of the and time-difference are determined for each event in the CP sample, the whole sample is used to construct a likelihood function based on the PDF
| (7) |
where when is tagged as () and is the estimated mistag probability for the tagging category to which the event belongs. As mentioned earlier, both BABAR and Belle obtain from data. The CP-parameter in the PDF serves as a free parameter and is to be extracted from a fit on the data employing the PDF.
The above physics PDF has to be modified to take into account the time resolution function and background time distribution. Details of time resolution treatment and fitting procedure can be found in [10] for BABAR and in [11] for Belle.
The value of is determined by an unbinned maximum-likelihood fit to the observed distribution. For all CP modes combined, the fitted () values are:
Fitted values for various sub-samples are included in table 3 for BABAR and table 4 for Belle. No inconsistency between the samples is observed.
Combining these latest two results from BABAR and Belle with earlier (non B-factory) results, namely () from Aleph, () from CDF and () from OPAL, a world average of is obtained.
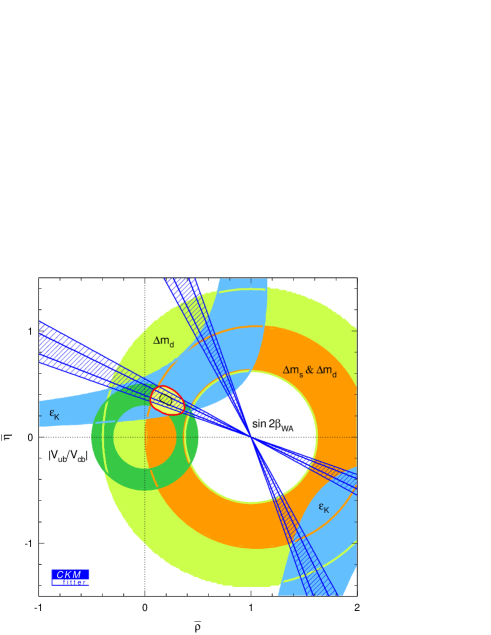
This world average value on (directly measured) can be compared with the Standard Model constraints in the plane, as shown in figure 1. The indirect constraints are realized from measurements on , , and CP-violation in the kaon system. Within the current measurement uncertainties, good agreement is observed. Measurements with improved precision and, in particular, measurements of other CP angles are necessary to provide a more stringent test on the Standard Model CKM theory of CP-violation.
The measurements discussed so far are performed with the assumption , as is predicted by the Standard Model for the decays. To test this assumption, a more general physics PDF, shown earlier in equation 6, can instead be used. A fitting based on this generalized PDF gives 444Belle uses all modes in this generalized fit while BABAR fits only on -odd modes.
The coefficient of term is simultaneously fitted to be at BABAR and at Belle, respectively. These results are consistent with the original assumption of .
6 CP Violation Measurement With Other Modes
In addition to the charmonium modes, violation measurement can be performed with many other decays. In this section, results measured from two classes of 555Results on are summarized in a separate article in this proceedings. sensitive samples, the Cabibbo-suppressed decays and the penguin dominated decays, are briefly summarized. More details can be found in [14, 15].
Unlike the theoretically clean decays with which can be directly measured, these additional modes may be affected by more than one -violating phases. The Standard Model assumption can not always be applied; often, a generic form of physics PDF as defined in equation 6 has to be used. With this generic PDF, asymmetry coefficients and can be extracted and compared with theoretical predictions. In the limit that only one weak phase contributes, the coefficient should be equal to , where is the eigen value of the corresponding mode, and the coefficient should be equal to zero.
6.1 Time Dependent CP Asymmetries With Decays
One useful mode is the decay where a even () final state is produced. The decay process receives both tree and penguin contributions. The Cabibbo-suppressed tree contribution has the same weak phase as the modes but the penguin contribution of comparable strength may bring in a different weak phase. Both BABAR and Belle have reconstructed events in this mode; the measured asymmetry coefficients are:
In addition to , BABAR has also constructed the decay. This decay is also a process but the final state is not a eigenstate – an angular analysis is necessary to determine the composition. With their sample, BABAR has measured a -odd fraction of and extracted the effective asymmetry parameters as:
If the decay is a tree-only process, and are expected. In the Standard Model, penguin-induced correction is predicted to be small () compared to this tree-only assymmetry.
6.2 Time Dependent CP Asymmetries With Decays
The penguin dominated process is also sensitive to . If only the Standard Model weak phase contributes, the coefficients and are expected to be and zero, respectively. Significant deviations to these expected value probe for new physics (in the penguin loops, for example).
BABAR has reported results from the -odd decays. The effective value is found to be .
Belle has presented results with two -odd, and modes, and a mixed mode666For this mixed mode, Belle has measured its composition to be 97% -odd and 3% -even. as well. The “” valuses measured from these three decays are , , and , respectively 777The systematic error for the mode is subject to an additional contribution from the uncertainty in the fraction of the -odd component. In the meantime, asymmetry parameter is also measured with each mode and found to be consistent with zero.
7 Acknowledgments
It is a pleasure to thank the organizers of the XXII Physics In Collision Conference for their kind invitation to present this review. This work is not possible without the aid of many individuals in the BABAR and the Belle Collaborations who provided me their latest results. I am grateful to P. Burchat, M. Hazumi, A. Jawahery, Y. Sakai, S. Sekula, S. L. Wu, and many others for their very helpful inputs and comments. This work is supported by the US Department of Energy contract DE-FG0295-ER40896.
References
- [1] N. Cabibbo, Phys. Rev. Lett. 10, 531 (1963); M. Kobayashi and T. Maskawa, Prog. Th. Phys. 49, 652 (1973).
- [2] B. Aubert et al. (BABAR Collab.), , Phys. Rev. Lett. 87, 091801 (2001).
- [3] K. Abe et al. (Belle Collab.), Phys. Rev. Lett. 87, 091802 (2001).
- [4] B. Aubert et al. (BABAR Collab.), Nucl. Instr. and Methods A479, 1 (2002).
- [5] A. Abashian et al. (Belle Collab.), Nucl. Instr. and Meth. A 479, 117 (2002).
- [6] E. Kikutani ed., KEK Preprint 2001-157 (2001), to appear in Nucl. Instr. and Meth. A.
- [7] B. Aubert et al. (BABAR Collab.), Phys. Rev. Lett. 88, 221802 (2002); B. Aubert et al. (BABAR Collab.), Phys. Rev. Lett. 88, 221803 (2002); B. Aubert et al. (BABAR Collab.), hep-ex/02070071.
- [8] K. Abe et al. (Belle Collab.), hep-ex/0207022; K. Abe et al. (Belle Collab.), BELLE-CONF 0203, hep-ex/0207045; K. Abe et al. (Belle Collab.), BELLE-CONF 0204; K. Abe et al. (Belle Collab.), BELLE-CONF 0205.
- [9] A.B. Carter and A.I. Sanda, Phys. Rev. D23, 1567 (1981); I.I. Bigi and A.I. Sanda, Nucl. Phys. B193, 85 (1981).
- [10] BABAR Collaboration, B. Aubert et al. (BABAR Collab.), SLAC-PUB-9060, hep-ex/0201020, to appear in Phys. Rev. D .
- [11] K. Abe et al. (Belle Collab.), Phys. Rev. Lett. 87, 091802 (2001); K. Abe et al. (Belle Collab.), hep-ex/0202027, accepted for publication in Phys. Rev. D.
- [12] B. Aubert et al. (BABAR Collab.), SLAC-PUB-9293, hep-ex/0207042;
- [13] K. Abe et al. (Belle Collab.), hep-ex/0207098;
- [14] B. Aubert et al. (BABAR Collab.), SLAC-PUB-9297, hep-ex/0207070; B. Aubert et al. (BABAR Collab.), SLAC-PUB-9298, hep-ex/0207058; B. Aubert et al. (BABAR Collab.), SLAC-PUB-9299, hep-ex/0207072;
- [15] K.-F. Chen et al, hep-ex/0207033, to appear in Phys. Lett. B (2002); K. Abe et al., BELLE-CONF-0232 (2002); K. Abe et al., BELLE-CONF-0209 (2002); K. Abe et al., BELLE-CONF-0225 (2002).