Limits on mass by DELPHI
Abstract
A limit on the tau neutrino mass is obtained using all the data collected at LEP by the DELPHI detector between 1992 and 1995. In this analysis events in which one of the taus decays into one charged particle, while the second decays into five charged pions (1-5 topology) have been used.
The neutrino mass is determined from a bidimensional fit on the invariant mass and on the energy of the five system. The result found is 48.0 MeV at 95% confidence level.
1 Introduction
The question whether neutrinos are massive is one of the outstanding issues in particle physics, astrophysics and cosmology.
Among the possible frameworks, the “see-saw” mechanism [1] is considered to be the most interesting because it explains the smallness of neutrino masses by connecting them to the scale of new physics. In fact the see-saw mechanism assumes a neutrino mass hierarchy similar to that of quarks or leptons.
On the basis of cosmological arguments a stable tau neutrino with a mass larger than a few eV cannot exist; however unstable neutrinos can be more massive, so a direct neutrino mass measurement of the order of a few MeV would suggest that the is unstable [2].
The clearest evidence of neutrinos having mass comes from the oscillation experiments [3], even if this kind of experiments cannot give the neutrino mass scale. Only direct measurements can do it and the most recent experiments [4] have fixed the mass of the to be about 2 eV. However the results of the oscillation experiments must be confirmed before concluding that massive unstable neutrinos cannot exist.
The kinematic properties of the observed final state in hadronic decays give direct bounds on . The best decay channels for a missing mass measurement are those with a high hadronic mass, where the little energy is available for undetected neutrinos. This kind of decays presents a small branching fraction , so the data sample generally consists of a few events.
High multiplicity decays have been selected for this analysis. The end point of the invariant mass distribution of the hadronic system, compared to , gives a limit on the mass.
2 The method
Multi-hadron decays of the lepton [7, 8] are due to the couplings of the charged weak current to hadrons, which in the case of decays reduces to the coupling of the boson to the current.
We can describe the tau decay as a two-body decay:
| (1) |
where the hadronic system is composed by five pions. In the tau rest frame, the energy of the hadronic system is used to compute the value of because of its dependence on , and :
| (2) |
In the laboratory frame this energy becomes:
| (3) |
where is the tau velocity, is the boost factor and is the angle between the direction of the and that of the hadronic system in the tau rest frame. We assume that the energy, , is equal to the beam energy, . Initial (ISR) and final (FSR) state radiation can reduce and will be considered later in section 6.
Because of the undetected neutrino, the direction of the is not determined, so cannot be computed directly. However, the energy of the hadronic system is helpful because it partially recovers the loss of information. In fact depends on and it must fall inside the interval :
| (4) |
As a consequence kinematic allowed regions are defined for different values assumed by , as shown in Fig. 1.
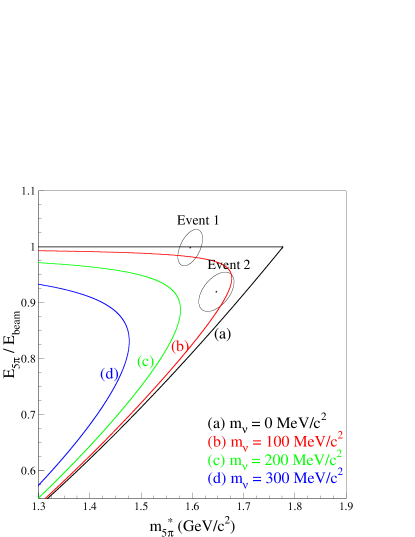
The probability to find an event in the allowed region clearly depends on the kinematic of the decay and on the resonance structure. Because both the invariant mass and the of the hadronic system are functions of the measured momenta, a positive correlation arises between these two quantities. The error ellipses for each event must be taken into account, so that, as shown in Fig. 1, event 1 constrains the neutrino mass much more than event 2, even if the latter has a higher hadronic mass. This is the advantage of fitting the distribution of the two variables and , rather than alone.
3 The DELPHI detector
The DELPHI detector and its performances are described in detail in [9, 10]. The whole detector, composed by a main central part (barrel) and by two forward regions (end-caps), covers the full solid angle. A superconducting solenoid provides a uniform axial magnetic field of 1.23 T. Charged particles are tracked in the barrel region using a combination of four cylindrical subdetectors: the silicon Vertex Detector (VD), the Inner Detector (ID), the Time Projection Chamber (TPC) and the Outer Detector (OD). Electron and photon idenification is provided by the High density Projection Chamber (HPC) located outside the OD.
4 Data selection
For LEP centre-of-mass energies of , and are produced back-to-back (ignoring radiative effects). Each decays producing one, three or more charged particles in addition to one or two neutrinos and, possibly, neutral mesons. All particles apart from neutrinos can be detected by DELPHI. decays are easy to identify because the two back-to-back jets are narrow and with low charged multiplicity. The presence of neutrinos implies that not all the energy in the event is seen and the invariant mass of the final state particles is less than .
The background from multi-hadron production at LEP energies can easily be reduced since it is characterized by a relatively high charged multiplicity and by a high invariant mass. Final states from and leave very characteristic signatures in DELPHI and are effectively discriminated.
The analysis presented here is based on the data collected by DELPHI from 1992 to 1995; the centre-of-mass energy of the system was between 89 and 93 GeV.
4.1 selection
The first step in data selection was to reject all non decay (cosmics, secondary interactions in the vacuum pipe, etc.). Each event has been divided into two hemispheres defined by the plane perpendicular to the thrust axis. It was required that the reconstructed topology was one charged particle in one side and five in the other (1-5 topology).
Events were accepted if , the sum of the momenta of all the charged particles plus the total neutral electromagnetic energy, was greater than 0.09, rejecting some of the hadronic decays, interactions and beam gas interactions. To reject cosmics and to reduce further the contamination from beam gas events it was required that, defining particles 1 and 2 as the most energetic in each hemisphere, 1.5 cm and 4.5 cm, where and are their transverse and longitudinal distances of closest approach to the average beam spot.
Part of the hadronic background was rejected by the requirement on the topology and on the impact parameters as described above. The remaining low multiplicity and events can be easily rejected by requiring that the isolation angle be greater than 160°. The isolation angle is defined as the minimum angle between any pair of tracks belonging to opposite hemispheres.
| Background Class | Background Source | |
|---|---|---|
| 5 | 8.3% | |
| (*) | 3 | 2.3% |
| 3 | 3.4% | |
| non | all at | |
(*) in the fit region it is reasonably flat
Another discriminating variable was the total momentum of the 5-prong system, . It must be greater than 30 GeV. Even if either and are related to the invariant mass of the hadronic system, the distribution of in the region of the end point is not affected by these selections.
To reduce further it was required that the total number of neutrals must be less than six. The hadronic decays usually have a large number of neutrals, whereas events should have no or few neutrals. Four-fermion background was suppressed by the requirement on the topology.
4.2 selection
The minimum momentum among the five charged particles and the minimum number of hits in the Vertex Detector help to reject those events that are reconstructed with a 5-prong multiplicity because of a secondary interaction or a Dalitz decay (), as for example . For this kind of events, secondary interactions or successive decays cause a degradation of the outcoming momenta. Events with less than 0.5 GeV were rejected.
The minimum invariant mass of pairs of oppositely charged particles in the hemisphere containing five tracks, (assuming the electron mass for both), was required to be greater than 0.05 GeV, to reject events with a conversion. The decays are rejected requiring the maximum value of the electromagnetic energy being less than 4 GeV.
4.3 Final data sample
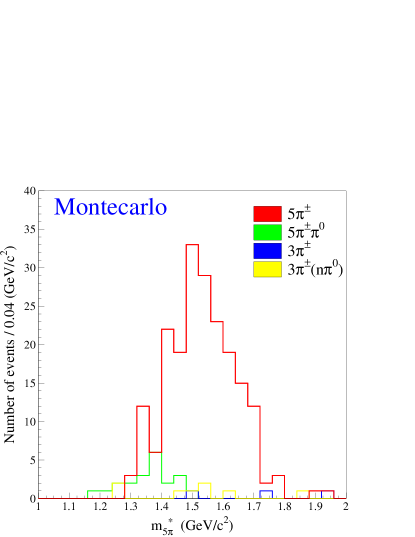
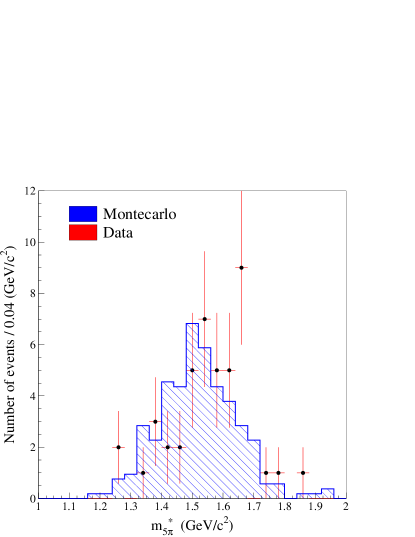
The composition of the selected data sample, as determined with the Montecarlo, is listed in Table 1.
A total of 47 candidates have been selected in the data. Fig. 2 shows the distribution of the hadronic invariant mass for the simulation (signal and backgrounds) and a comparison between the simulation and data. events have values of the invariant mass greater than 2 GeV; other kind of decays have small values of , so they are located on the left side of the invariant mass spectrum.
5 The likelihood function
In order to determine the upper limit on an unbinned likelihood fit has been performed. The likelihood function depends both on the invariant mass and on the energy of the hadronic system:
| (5) |
where is the number of the selected candidates, while is the probability for observing each selected event at the position (, ) in the kinematic plane defined as a function of the tau neutrino mass :
| (6) |
where is the experimental resolution function of the detector and is the selection efficiency. Both and could be a function of either the invariant mass and the normalized energy. The shape of the resolution function has been determined from simulation. Since the two variables are correlated, is a 2D gaussian depending on the three parameters , and . The invariant mass resolution is about 16 MeV (in average) and the normalized energy resolution is of the order of 10-2 ( 500 MeV). If the resolution is constant, the experimental resolution function can be factorized, and the likelihood becomes simpler. In this analysis each event is considered with its proper resolution.
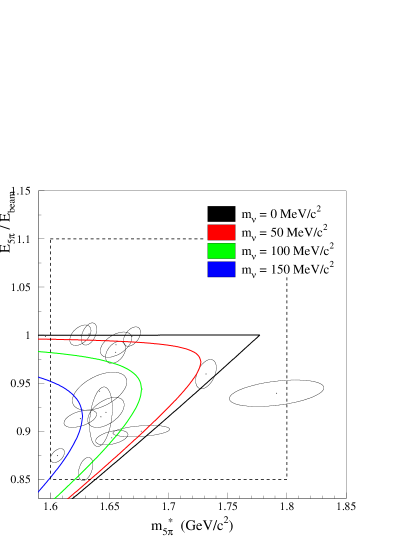
The selection efficiency was found to be constant with respect to the invariant mass and the energy if 1.6 GeV and greater than 0.85. As a consequence, the fit will be restricted to this region of the (, ) plane. Fig. 3 shows this upper part of the plane with the 15 candidates used in the fit.
The theoretical prediction has been calculated as a function of including initial (ISR) and final (FSR) state radiation with the KORALZ 4.0 [11] Montecarlo event generator for . The KORALZ 4.0 simulator incorporated the TAUOLA 2.4 [12] package for modelling the lepton decays.
The factor in equation (6) ensures that the probability density used in the event likelihood is normalized for any values of neutrino mass because the distribution of events in the kinematic allowed region of the (, ) plane depends on the value of .
The fraction of backgrounds has been determined from simulation. As shown in Fig. 2, hadronic events have values of the invariant mass greater than , while background from or gives contribution in the low invariant mass part of the spectrum. The end point of is therefore reasonably background-free. However a flat background (6% of signal) has been considered, so the likelihood was expanded as:
| (7) |
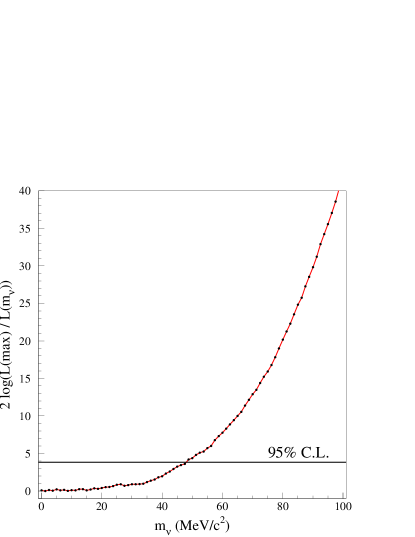
where is the background fraction. Only 15 of the 47 selected candidates are in the fit region. The fit gives an upper limit on the neutrino mass of 48.0 MeV at 95% CL. Fig. 4 shows the log-likelihood for these 15 events.
A possible bias in the analysis method has been investigated by fitting high statistics Montecarlo samples with three different input values of : 0, 30 and 60 MeV. In all cases the best fit results are in good agreement with the input values. The corrisponding values are listed in Table 2.
| (MeV) | Best Fit (MeV) |
|---|---|
| 0.0 | 7.3 |
| 30.0 | 34.0 |
| 60.0 | 55.2 |
The expected best limit for 0 MeV is about 30 MeV.
6 Systematic effects
Four sources of systematic errors have been considered. For each source a new fit has been performed after having changed the parameter of that particular source by one standard deviation. The difference between the 95% CL upper limit on the tau neutrino mass computed in section 5 and the one obtained by the modified likelihood has been considered as the systematic effect due to that particular source. Then all these variations have been summed in quadrature to obtain the global systematic error which can be added linearly to the upper limit of the original fit.
| (MeV) | CL | |
|---|---|---|
| pure phase space | 48.0 | 95% |
| 47.9 | 95% | |
| 46.3 | 95% | |
| 44.5 | 95% |
The systematic sources considered in this analysis are summarized in the following:
-
•
the tau mass and its energy ;
-
•
detector effects such as the hadronic mass scale and the experimental resolution function. The DELPHI hadronic mass scale studied using the decay shows a shift of +4 MeV [13];
-
•
the selection efficiency and the effect of the size of the fitted region;
-
•
the intermediate structure of the decay. The hadronic invariant mass depends on the dynamics of the decay. Intermediate resonances have the effect of shifting the shape of spectrum to higher values. Some studies have been performed by assuming decay, or .
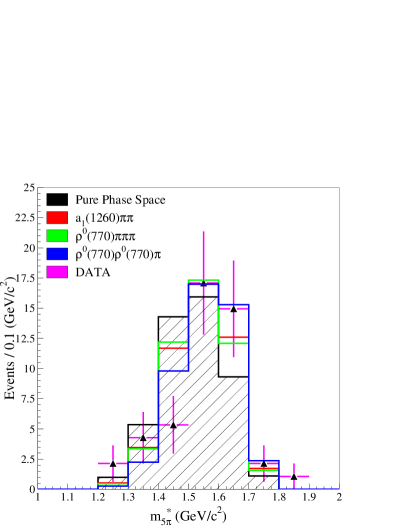
Figure 5: Distributions of the hadronic invariant mass for data (dots) and four models of decay. The black hatched histogram indicates the pure phase space model, while the red, green and blue lines are the distributions obtained by means of three different intermediate resonance structures. Fig. 5 shows the invariant mass distribution compared with those predicted by a pure phase space model and by the models with intermediate resonances. A model with a seems to be preferred. However, because of the small number of observed events, it is not possible to state which is the correct resonance. Table 3 shows the 95% CL upper limits obtained for the resonance structures considered.
| Source | Variation of |
|---|---|
| limit (MeV) | |
| 0.3 | |
| 0.1 | |
| experimental resolution | 2.5 |
| mass calibration | 1.0 |
| fit region | 0.7 |
| total | 2.8 |
| hadronic mass scale | +4.0 |
Table 4 summarises all the variations considered in this analysis.
7 Review of the existing collider results
There are some interesting limits on the mass obtained by collider experiments. Recent results are summarized in Table 5 and shortly presented in the following sections.
| Experiment | Mode | ||||
|---|---|---|---|---|---|
| Combined | |||||
| ARGUS | 31.0 | ||||
| CLEO | 28.0 | 35.9 | 33.9 | 30.0 | |
| ALEPH | 26.5 | 22.3 | 18.2 | ||
| OPAL | 35.3(*) | 43.2 | 27.6 | ||
(*) from decays
7.1 Low energy measurements
The main difference between measurements performed at different values is that the selection between high multiplicity decays and low multiplicity hadronic events from becomes easier and easier with the increasing of the center-of-mass energy. So LEP experiments select events more efficiently and with a higher purity. On the other hand, taus are produced more abundantly at CESR.
CLEO collected tau pairs produced at a center-of-mass energy of 10.6 GeV. The analysis was performed using events and fitting the 36 selected events, using the invariant mass and the hadronic energy. The 95% CL upper limit was 33.9 MeV [14].
In addition CLEO analyzed decays. This channel can be studied better at low energy machine, because at LEP photons from conversions are highly collimated and the selection more difficult. An upper limit at the 95% confidence level of 35.9 MeV was found. The combined result found by CLEO is 30.0 MeV [14].
An analysis with decays was also done [15]. This is a useful decay because of the larger branching ratio than 5-prong, and in addition the invariant mass is very close to . From a data sample of 29058 candidates, the obtained 95% CL upper limit on the tau neutrino mass is 28.0 MeV.
Fig. 6 shows the distribution of the 5 body selected events in the (, ) plane.
ARGUS used events collected at center-of-mass energy of about 10.6 GeV. Performing a fit only to the hadronic invariant mass, the result was 31.0 MeV [16].
7.2 High energy measurements
At LEP energy, events present a typical two back-to-back narrow jets structure. ALEPH and OPAL, as DELPHI, have analyzed data collected at center-of-mass energy equal or close to the resonance.
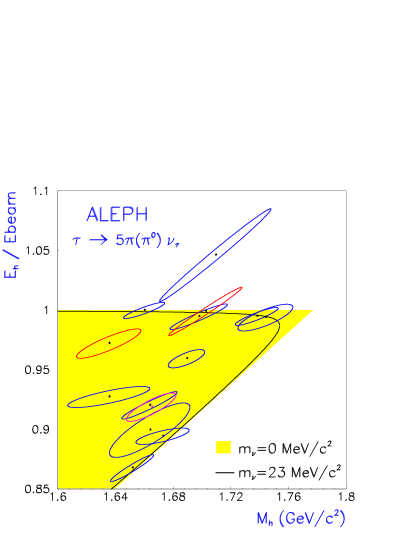
ALEPH obtained two separate limits by fitting the distribution of the visible energy and the invariant mass. The fits to the 2939 and to the 55 events have given 95% CL upper limits on of 26.5 MeV and 22.3 MeV respectively. These two results have been combined to obtain a 95% confidence level upper limit of 18.2 MeV, and this is the world’s best limit on [6]. Fig. 7 shows the distribution of events in the upper part of the (, ) plane for the 5-prong data.
Also OPAL determined an upper limit for with the decay . A limit of 43.2 MeV at 95% CL has been obtained using a two-dimensional method in the hadronic invariant mass and energy distributions from 22 selected candidates [17]. Combining this result with OPAL’s previously published measurement using decays, a new limit of 27.6 MeV (95% CL) was obtained [18].
Before the 5-prong analysis presented here, DELPHI has set a limit with a measurement of the leptonic branching fractions of the lepton. The 95% confidence level limit found was 66.0 MeV [19]. This method is however limited by the precision of the leptonic branching ratio measurements, and is not competitive with the one described in this talk.


8 Conclusions
The CLEO experiment had analyzed a very large statistics sample and its mass and energy resolutions were better than LEP experiments.
Looking at Fig. 3 and 7, it’s easy to outline that with comparable mass and energy resolutions, the position of events in the (, ) plane determines a “luck factor” for an experiment. So, the ALEPH limit is strongly driven by the two candidates lying in top right-hand corner of the kinematic allowed region. The most sensitive region of that plane for OPAL and DELPHI is empty. OPAL and DELPHI’s 5-prong analysis present very similar results.
Acknowledgemets
The author thanks Clara Matteuzzi, Tommaso Tabarelli de Fatis and Francisco Matorras for their helpful suggestions and for many discussions for this analysis.
References
- [1] M. Gell-Mann, P. Ramond, R. Slansky, Supergravity, North-Holland, Amsterdam, 1979.
- [2] H. Harari, Nucl. Phys. B (Proc. Suppl.) 13 (1990), 103; Proceedings of the Third Workshop on Tau Lepton Physics, Ed. by L. Roladi, Noth Holland (1994).
- [3] T. Kajita for SUPERKAMIOKANDE and KAMIOKANDE Coll., talk given at NEUTRINO 98, Takayama, Japan, hep-ex/9810001.
- [4] E. W. Otten, Prog. in Part. and Nucl. Phys., 48 (2002), 133.
- [5] ALEPH Coll., Phys. Lett., B349 (1995), 585.
- [6] ALEPH Coll., Eur. Phys. J., C2 (1998), 395.
- [7] Lev B. Okun, Leptons and Quarks, North-Holland, Amsterdam, 1982.
- [8] J.J. Gomez-Cadenas et al., Phys. Rev., D41 (1990), 2179.
- [9] DELPHI Coll., Nucl. Instr. and Meth., A303 (1991), 233.
- [10] DELPHI Coll., Nucl. Instr. and Meth., A378 (1996), 57.
- [11] S. Jadach, B.F.L. Ward, Z. Wa̧s, Comp. Phys. Comm., 79 (1994), 503.
- [12] R. Decker, J.H. Kühn, S. Jadach, Z. Wa̧s, Comp. Phys. Comm., 76 (1993), 361.
- [13] DELPHI Coll., Phys. Lett. B426 (1998), 231.
- [14] CLEO Coll., Phys. Lett. B431 (1998), 209.
- [15] CLEO Coll., Phys. Rev., D61 (2000), 052002.
- [16] ARGUS Coll., Phys. Lett. B292 (1992), 221.
- [17] OPAL Coll., Eur. Phys. J., C5 (1998), 229.
- [18] OPAL Coll., Zeit. Phys., C72 (1996), 231.
- [19] DELPHI Coll., Eur. Phys. J., C10 (1999), 201.